2025 ELON Price Prediction: Will the Dogelon Mars Token Reach New Heights in the Crypto Market?
Introduction: ELON's Market Position and Investment Value
Dogelon Mars (ELON), as a meme-inspired cryptocurrency, has gained attention in the crypto space since its inception in 2021. As of 2025, ELON's market cap has reached $32,781,124, with a circulating supply of approximately 549,649,971,723,242 tokens, and a price hovering around $0.00000005964. This asset, often referred to as a "community-driven token," is playing an increasingly significant role in the meme coin and social token ecosystems.
This article will provide a comprehensive analysis of ELON's price trends from 2025 to 2030, considering historical patterns, market supply and demand, ecosystem development, and macroeconomic factors to offer professional price predictions and practical investment strategies for investors.
I. ELON Price History Review and Current Market Status
ELON Historical Price Evolution
- 2021: Launch year, price reached all-time high of $0.00000259 on October 31
- 2022: Market downturn, price declined significantly
- 2023: Continued bearish trend, price fluctuated at lower levels
- 2024: Slight recovery, but price remained well below all-time high
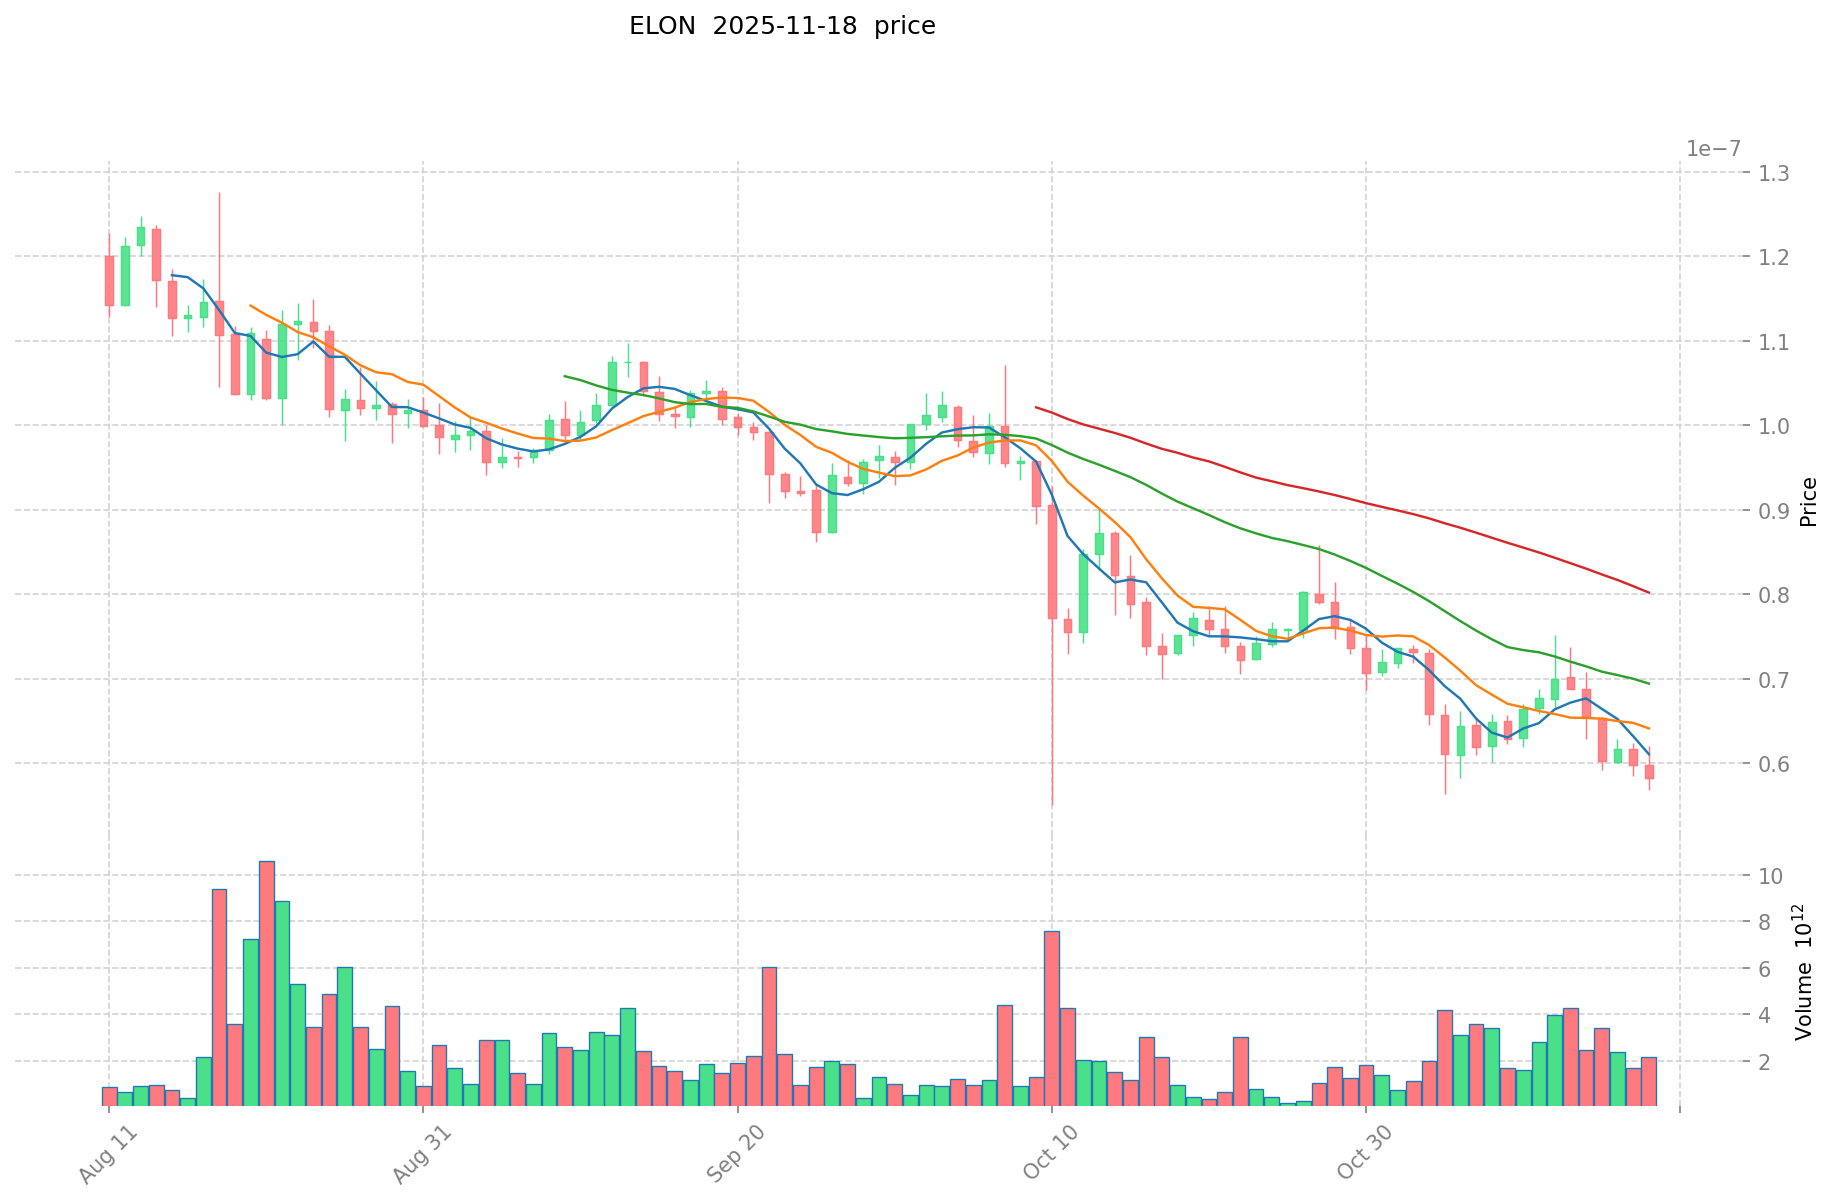
- 2025: Current year, price stabilized around $0.00000005964
ELON Current Market Situation
As of November 19, 2025, ELON is trading at $0.00000005964. The token has shown a 1.23% increase in the last hour and a 0.16% gain in the past 24 hours. However, it has experienced significant declines over longer periods, with a 16.93% drop in the last 7 days and a 22.05% decrease over the past 30 days. The yearly performance shows a substantial 71.94% decline.
The current market capitalization stands at $32,781,124, ranking ELON at 737th position in the crypto market. The 24-hour trading volume is $159,643, indicating moderate trading activity. The circulating supply is 549,649,971,723,242 ELON tokens, which represents 54.96% of the total supply of 1,000,000,000,000,000 tokens.
Click to view the current ELON market price
ELON Market Sentiment Indicator
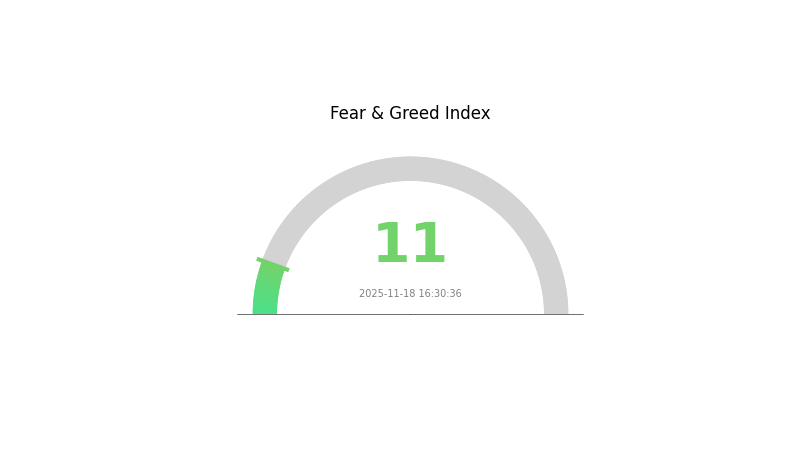
2025-11-18 Fear and Greed Index: 11 (Extreme Fear)
Click to view the current Fear & Greed Index
The crypto market is gripped by extreme fear, with the sentiment index plummeting to 11. This level of pessimism often precedes significant market movements. Historically, such extreme fear has presented opportunities for contrarian investors. However, it's crucial to approach with caution. While some may see this as a potential buying opportunity, others might interpret it as a sign of further downside. As always, thorough research and risk management are essential in navigating these turbulent market conditions.
ELON Holdings Distribution
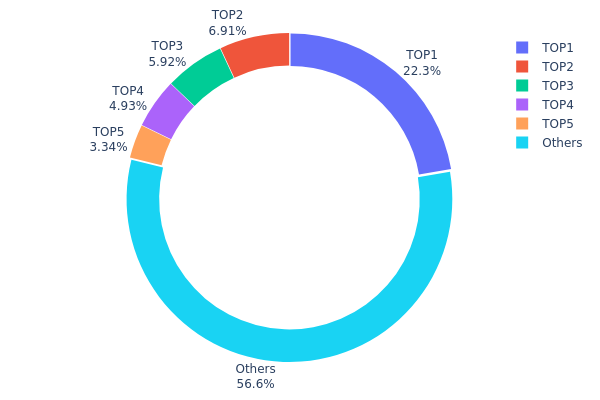
The address holdings distribution data provides crucial insights into the concentration of ELON tokens among various wallet addresses. Analysis of this data reveals a significant level of concentration, with the top address holding 22.32% of the total supply. The top five addresses collectively control 43.41% of ELON tokens, indicating a relatively centralized distribution.
This concentration pattern raises concerns about potential market manipulation and price volatility. The dominant position of the top holders could lead to sudden large-scale transactions that may significantly impact ELON's market price. Furthermore, the substantial holdings of these top addresses suggest a lower level of decentralization than ideal for a cryptocurrency aiming for widespread adoption and stability.
However, it's noteworthy that 56.59% of ELON tokens are distributed among "Others," which may indicate a degree of broader market participation. This distribution pattern reflects a market structure with a mix of large stakeholders and smaller holders, potentially creating a complex dynamic for future price movements and overall market stability.
Click to view the current ELON Holdings Distribution
| Top | Address | Holding Qty | Holding (%) |
|---|---|---|---|
| 1 | 0xa023...fc947e | 223208231450.27K | 22.32% |
| 2 | 0x7b73...315860 | 69103779881.65K | 6.91% |
| 3 | 0xcffa...290703 | 59188244937.64K | 5.91% |
| 4 | 0xa7b3...634882 | 49330241039.19K | 4.93% |
| 5 | 0x5438...18a0e6 | 33400663788.16K | 3.34% |
| - | Others | 565768732878.80K | 56.59% |
II. Key Factors Influencing ELON's Future Price
Supply Mechanism
- Circulating Supply: Currently, only 55% of ELON's total supply is in circulation, which may make future price movements more unpredictable.
- Historical Pattern: The limited circulating supply has historically contributed to price volatility.
- Current Impact: The potential release of the remaining 45% supply could significantly impact price dynamics in the future.
Institutional and Whale Dynamics
- Community Strength: ELON has a growing community, particularly among meme coin enthusiasts, which could influence future price movements.
Macroeconomic Environment
- Inflation Hedging Properties: As a meme coin, ELON may be viewed by some as a speculative hedge against inflation, similar to other cryptocurrencies.
Technical Development and Ecosystem Building
- Meme Coin Ecosystem: ELON's future development is largely influenced by the overall meme coin ecosystem, which relies heavily on community strength and cultural appeal.
III. ELON Price Prediction for 2025-2030
2025 Outlook
- Conservative prediction: $0.00000110 - $0.00000130
- Neutral prediction: $0.00000130 - $0.00000150
- Optimistic prediction: $0.00000150 - $0.00000170 (requires increased adoption and positive market sentiment)
2027-2028 Outlook
- Market phase expectation: Potential growth phase with increased volatility
- Price range forecast:
- 2027: $0.00000150 - $0.00000200
- 2028: $0.00000180 - $0.00000240
- Key catalysts: Meme coin market revival, broader crypto market recovery, and potential Elon Musk-related events
2029-2030 Long-term Outlook
- Base scenario: $0.00000250 - $0.00000350 (assuming steady market growth and maintained community interest)
- Optimistic scenario: $0.00000350 - $0.00000450 (with significant ecosystem developments and mainstream adoption)
- Transformative scenario: $0.00000450 - $0.00000600 (with groundbreaking use cases or major celebrity endorsements)
- 2030-12-31: ELON $0.00000434 (potential peak based on bullish market conditions)
| 年份 | 预测最高价 | 预测平均价格 | 预测最低价 | 涨跌幅 |
|---|---|---|---|---|
| 2025 | 0 | 0 | 0 | 0 |
| 2026 | 0 | 0 | 0 | 10 |
| 2027 | 0 | 0 | 0 | 33 |
| 2028 | 0 | 0 | 0 | 52 |
| 2029 | 0 | 0 | 0 | 78 |
| 2030 | 0 | 0 | 0 | 117 |
IV. ELON Professional Investment Strategy and Risk Management
ELON Investment Methodology
(1) Long-term Holding Strategy
- Suitable for: Risk-tolerant investors with a long-term perspective
- Operation suggestions:
- Accumulate ELON tokens during market dips
- Set target prices for partial profit-taking
- Store tokens in secure hardware wallets
(2) Active Trading Strategy
- Technical analysis tools:
- Moving Averages: Use to identify trends and potential reversal points
- RSI (Relative Strength Index): Monitor overbought/oversold conditions
- Key points for swing trading:
- Set strict stop-loss orders to limit potential losses
- Take profits at predetermined resistance levels
ELON Risk Management Framework
(1) Asset Allocation Principles
- Conservative investors: 1-2% of crypto portfolio
- Aggressive investors: 3-5% of crypto portfolio
- Professional investors: 5-10% of crypto portfolio
(2) Risk Hedging Solutions
- Diversification: Spread investments across multiple crypto assets
- Options strategies: Use put options for downside protection
(3) Secure Storage Solutions
- Hot wallet recommendation: Gate Web3 wallet
- Cold storage solution: Use hardware wallets for long-term holdings
- Security precautions: Enable two-factor authentication, use strong passwords
V. Potential Risks and Challenges for ELON
ELON Market Risks
- High volatility: Significant price swings can lead to substantial losses
- Low liquidity: Limited trading volume may impact entry and exit points
- Meme coin perception: May face challenges in gaining long-term credibility
ELON Regulatory Risks
- Uncertain regulatory environment: Potential for increased scrutiny of meme coins
- Compliance issues: May face challenges in meeting evolving regulatory requirements
- Exchange delistings: Risk of removal from trading platforms due to regulatory concerns
ELON Technical Risks
- Smart contract vulnerabilities: Potential for exploits or bugs in the token contract
- Network congestion: High gas fees on Ethereum network may impact transactions
- Limited utility: Lack of real-world use cases may hinder long-term adoption
VI. Conclusion and Action Recommendations
ELON Investment Value Assessment
ELON presents a high-risk, speculative investment opportunity with potential for significant volatility. While it has gained popularity as a meme coin, its long-term value proposition remains uncertain. Short-term risks include extreme price fluctuations and regulatory uncertainties.
ELON Investment Recommendations
✅ Beginners: Limit exposure to a small portion of portfolio, if any
✅ Experienced investors: Consider small, speculative positions with strict risk management
✅ Institutional investors: Approach with caution, conduct thorough due diligence
ELON Trading Participation Methods
- Spot trading: Buy and sell ELON tokens on supported exchanges
- Staking: Participate in liquidity provision if available on decentralized platforms
- Dollar-cost averaging: Gradually accumulate tokens over time to mitigate price volatility
Cryptocurrency investments carry extremely high risks, and this article does not constitute investment advice. Investors should make decisions carefully based on their own risk tolerance and are advised to consult professional financial advisors. Never invest more than you can afford to lose.
FAQ
Will Dogelon Mars ever hit $1?
While possible, reaching $1 is highly speculative for Dogelon Mars. Market dynamics and investor sentiment will be crucial factors in determining its future price trajectory.
What will Dogelon Mars be worth in 2025?
Based on current forecasts, Dogelon Mars is expected to reach $0.0₇6660 by December 2025, representing a 10.98% increase from its current value.
How much will Dogelon Mars be worth in 2040?
Dogelon Mars could reach $0.000001027 by 2040, based on market projections. This represents significant growth potential for long-term investors.
What is the all time high for Dogelon?
The all-time high for Dogelon Mars is $0.00000258, reached on October 30, 2021. This price is currently down by 97.7%.
Share
Content
Introduction: ELON's Market Position and Investment Value
I. ELON Price History Review and Current Market Status
II. Key Factors Influencing ELON's Future Price
III. ELON Price Prediction for 2025-2030
IV. ELON Professional Investment Strategy and Risk Management
V. Potential Risks and Challenges for ELON
VI. Conclusion and Action Recommendations
FAQ

