GITCOIN vs GRT: A Comprehensive Comparison of Two Leading Web3 Ecosystem Tokens


Introduction: GITCOIN vs GRT Investment Comparison
In the cryptocurrency market, comparisons between Gitcoin and The Graph have become an important consideration for investors. The two projects not only differ significantly in market capitalization rankings, application scenarios, and price performance, but also represent distinct positioning within the crypto asset landscape. Gitcoin (GITCOIN): Since its launch in 2021, it has gained market recognition by providing an open-source platform that enables developers to earn compensation for contributing to public goods through various programming languages and technologies. The Graph (GRT): Since its inception in 2020, it has been recognized as a decentralized protocol for indexing and querying blockchain data on Ethereum, enabling accessible data infrastructure for the entire ecosystem. This article will provide a comprehensive analysis of the investment value comparison between Gitcoin and The Graph across historical price trends, supply mechanisms, market positioning, ecosystem development, and future outlook, while addressing the key question investors are most concerned with:
"Which is the better buy right now?"
Comparative Analysis of Gitcoin (GTC) and The Graph (GRT): Market Performance and Asset Overview
I. Historical Price Comparison and Current Market Status
Gitcoin (GTC) and The Graph (GRT) Historical Price Trends
Historical Performance:
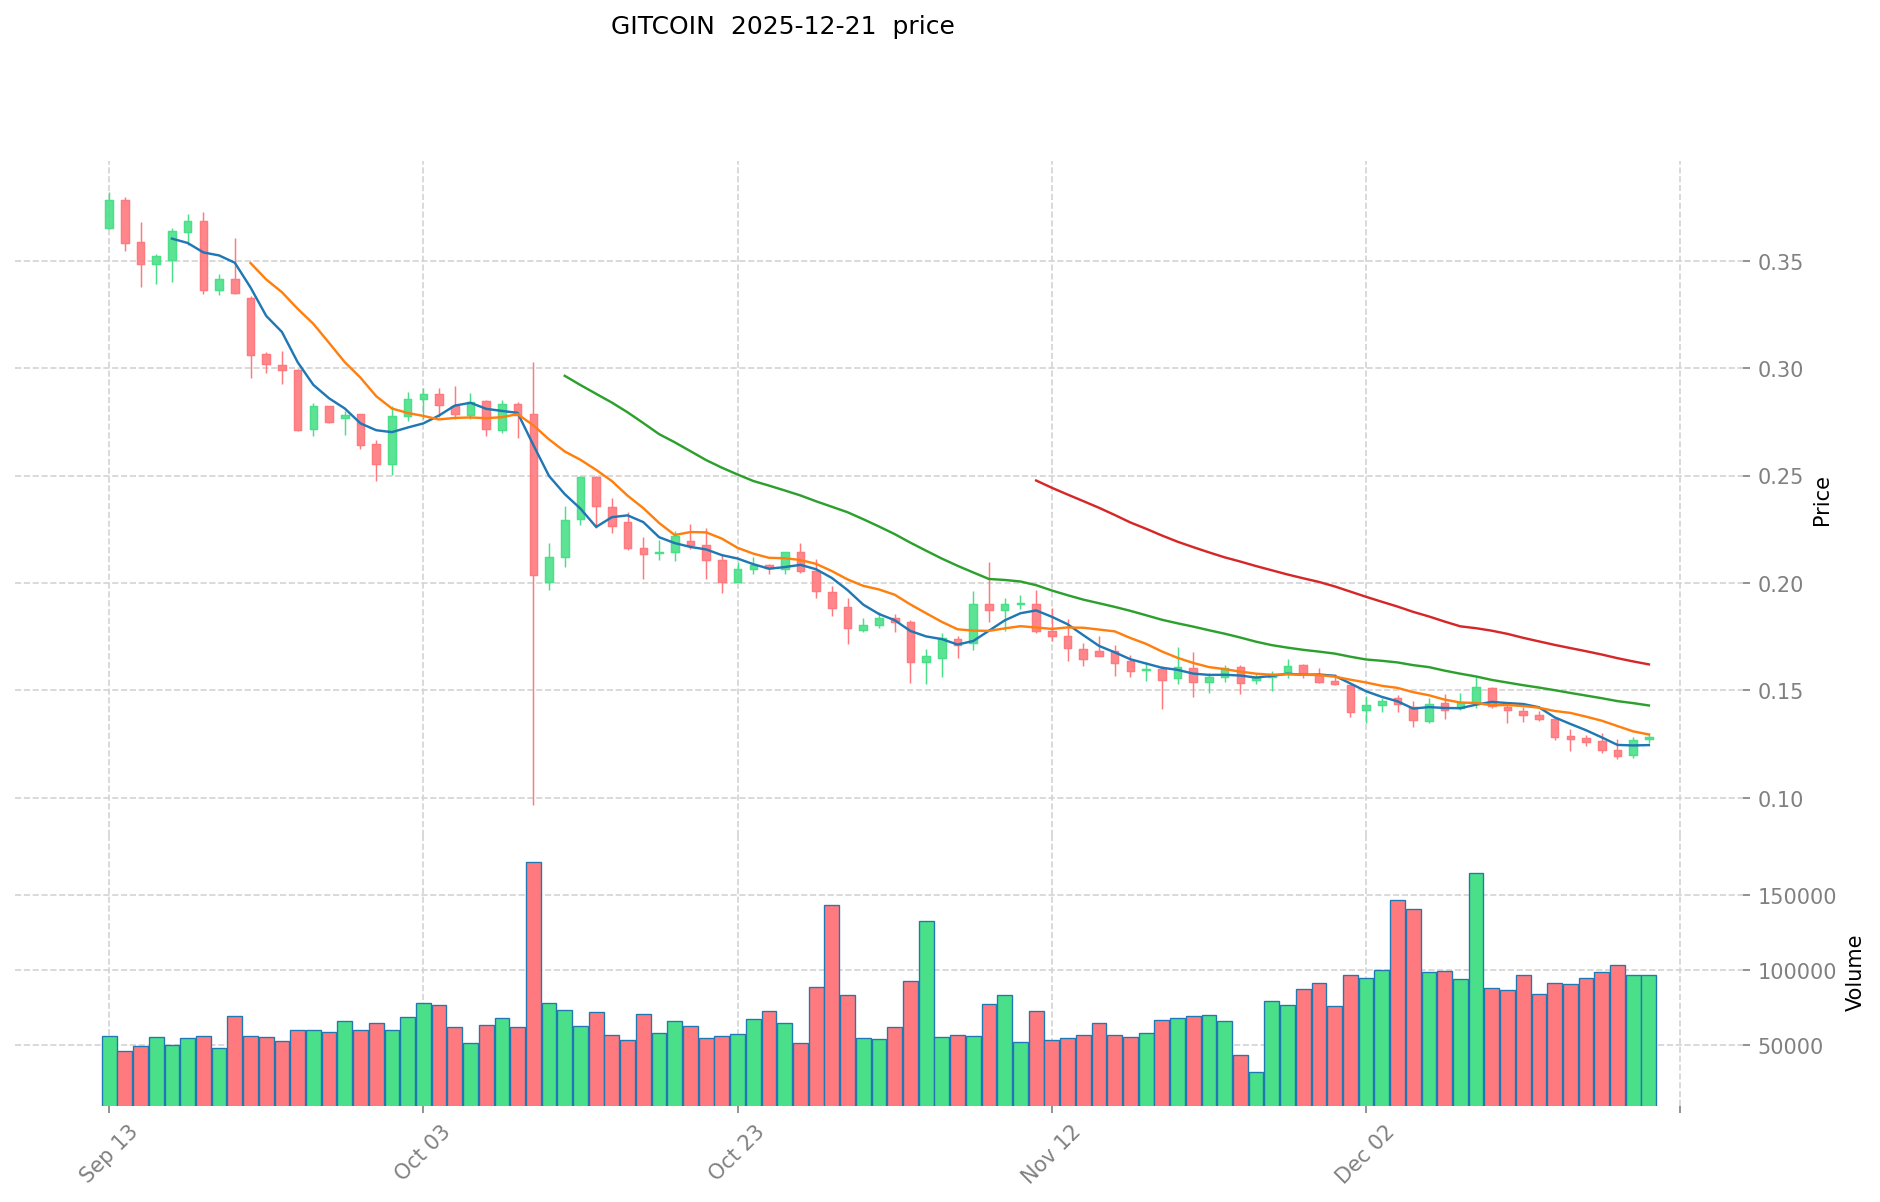
- Gitcoin reached its all-time high of $22.37 on November 27, 2021, and subsequently experienced significant depreciation to its recent low of $0.118188 on December 19, 2025.
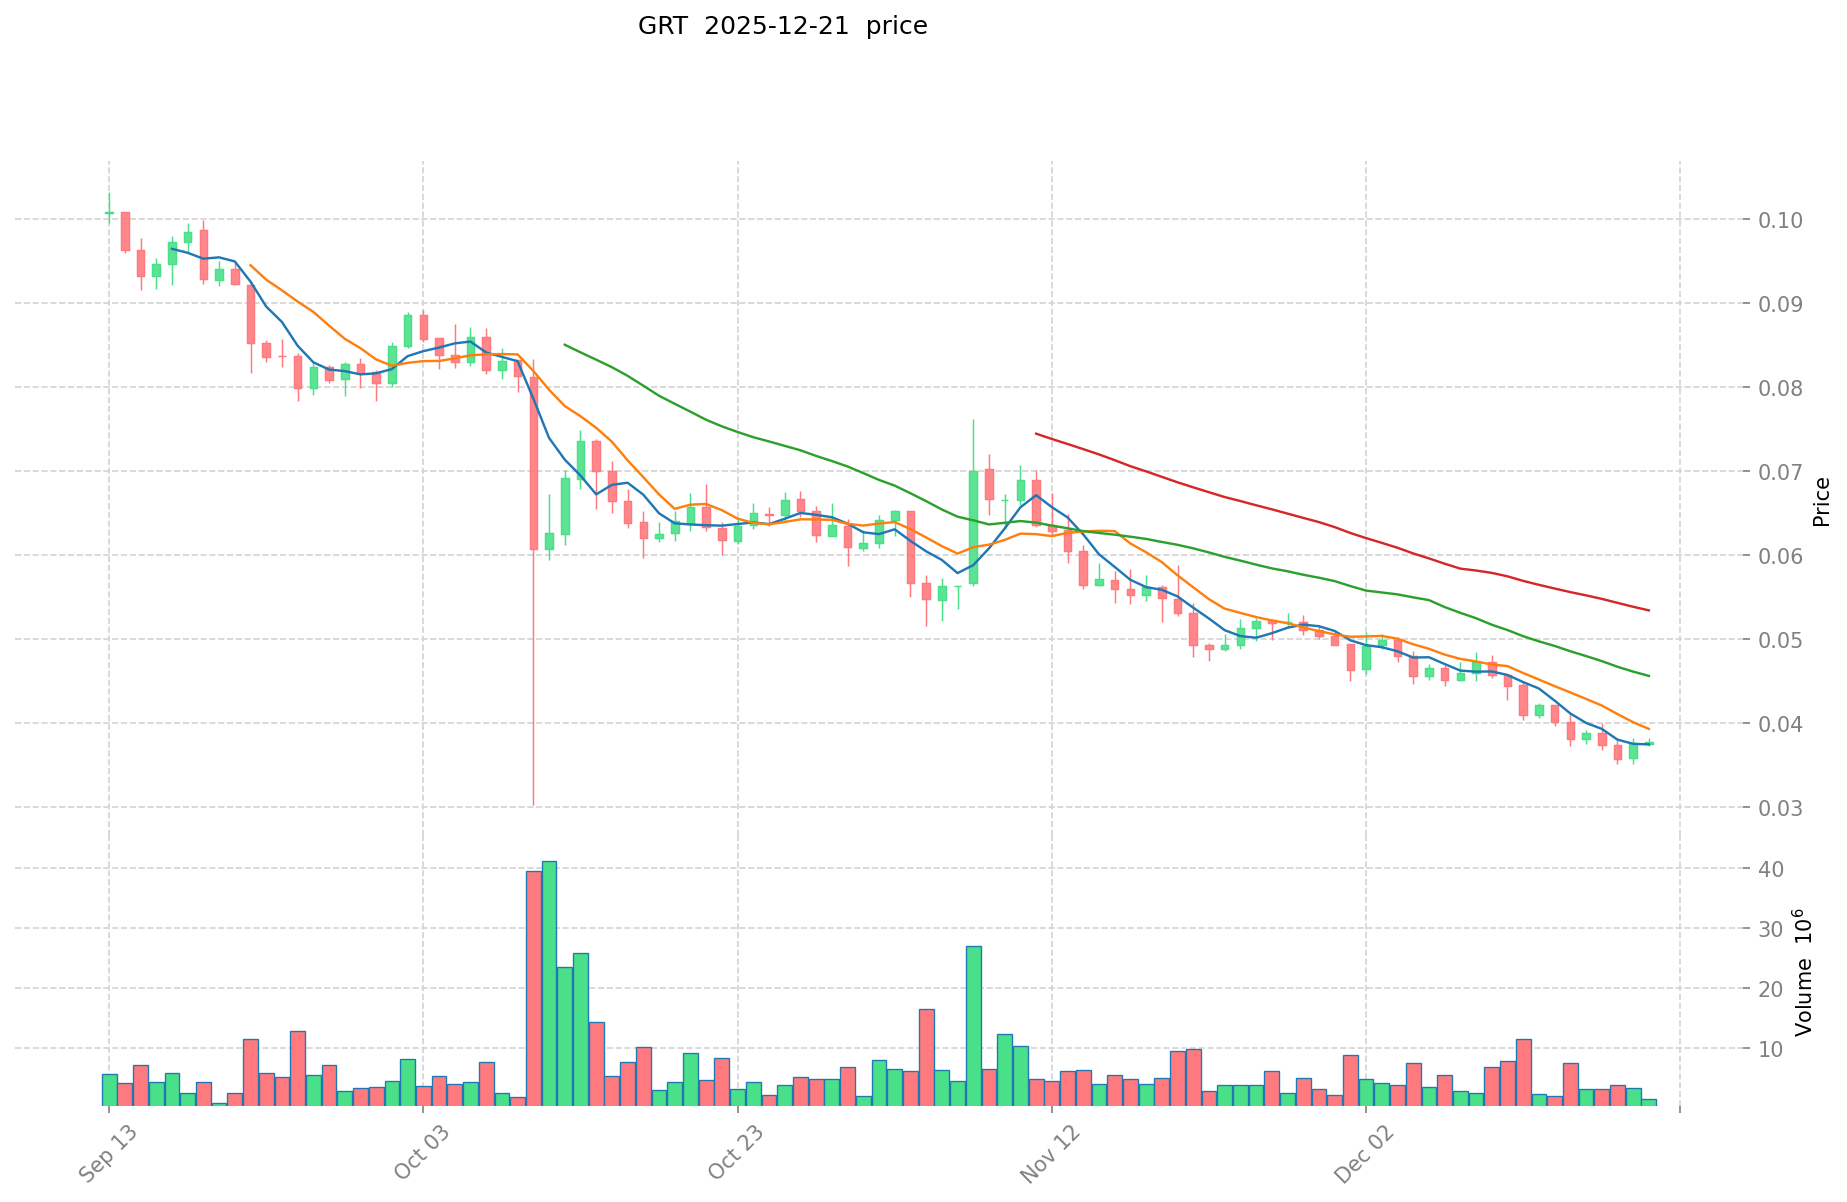
- The Graph achieved its all-time high of $2.84 on February 12, 2021, declining to a recent low of $0.03519341 on December 19, 2025.
Comparative Analysis: Both assets have experienced substantial year-over-year declines reflecting challenging market conditions in the broader cryptocurrency sector. Gitcoin's one-year performance shows a -82.33% decline, while The Graph demonstrates a -83.0099% annual decline, indicating comparable downward pressure on both infrastructure-focused tokens during the current market cycle.
Current Market Status (December 21, 2025)
| Metric | Gitcoin (GTC) | The Graph (GRT) |
|---|---|---|
| Current Price | $0.1282 | $0.03718 |
| 24-Hour Change | +0.94% | -1.24% |
| 7-Day Change | -4.33% | -9.46% |
| 30-Day Change | -15.55% | -24.18% |
| 24-Hour Volume | $12,234.15 | $40,253.30 |
| Market Cap | $12,820,000 | $401,553,771.50 |
| Circulating Supply | 96,384,727.71 | 10,655,891,273.82 |
| Market Cap to FDV Ratio | 96.38% | 98.66% |
Market Sentiment: The Crypto Fear & Greed Index stands at 20, indicating "Extreme Fear" in the market, reflecting heightened risk aversion among market participants as of December 21, 2025.
Reference Links:
- Gitcoin Current Price: https://www.gate.com/price/gitcoin-gitcoin
- The Graph Current Price: https://www.gate.com/price/the-graph-grt
II. Project Overview and Utility
Gitcoin (GTC)
Project Description: Gitcoin is an open-source platform enabling developers to create open-source software using Python, Rust, Ruby, JavaScript, Solidity, HTML, CSS, and design tools while earning compensation. GTC functions as a governance token for the GitcoinDAO ecosystem, facilitating decentralized decision-making regarding the allocation of funding toward next-generation public goods.
Token Utility:
- Governance participation in GitcoinDAO
- Distribution mechanism within the ecosystem
- Public goods funding coordination
Market Position: Ranked 1,073 by market capitalization, Gitcoin maintains a market share of 0.00039%.
The Graph (GRT)
Project Description: The Graph is a decentralized protocol for indexing and querying blockchain data, with primary implementation on Ethereum. It enables developers to construct and publish open APIs called subgraphs, democratizing access to blockchain information. GRT is the native token powering the protocol's economic layer.
Token Utility:
| Role | Description |
|---|---|
| Indexer Staking | Indexers stake GRT tokens to participate in query markets and provide economic security during work execution. |
| Curator Signal | Curators stake GRT in curation markets to signal which subgraphs hold network value, receiving rewards for accurate predictions. |
| Query Settlement | Final settlement of query transactions occurs in GRT, establishing a unified accounting unit across the protocol. |
| Monetary Policy | Native token holding enables stimulation of specific behaviors through inflation mechanisms, with dynamic adjustment capabilities. |
Market Position: Ranked 142 by market capitalization, The Graph maintains a market share of 0.012%.
III. Price Performance Analysis
Short-term Price Dynamics (Past 30 Days)
Gitcoin (GTC):
- 1-Hour: -0.16%
- 24-Hour: +0.94%
- 7-Day: -4.33%
- 30-Day: -15.55%
- 1-Year: -82.33%
The Graph (GRT):
- 1-Hour: -0.88%
- 24-Hour: -1.24%
- 7-Day: -9.46%
- 30-Day: -24.18%
- 1-Year: -83.0099%
Trading Volume and Liquidity
The Graph demonstrates significantly higher trading volume ($40,253.30 in 24-hour volume) compared to Gitcoin ($12,234.15), suggesting greater market liquidity and trading interest in GRT across the 53 supported exchanges versus Gitcoin's 21 exchanges.
IV. Blockchain Implementation and Network Distribution
Gitcoin (GTC)
Blockchain Network:
- Native Chain: Ethereum (ETH)
- Contract Address: 0xde30da39c46104798bb5aa3fe8b9e0e1f348163f
- Token Holders: 91,778 addresses
- Listed Exchanges: 21
The Graph (GRT)
Blockchain Networks:
- Ethereum (ETH): Primary network
- Contract Address: 0xc944e90c64b2c07662a292be6244bdf05cda44a7
- Arbitrum (ARBEVM): Secondary network
- Contract Address: 0x9623063377AD1B27544C965cCd7342f7EA7e88C7
- Token Holders: 173,484 addresses
- Listed Exchanges: 53
The Graph's multi-chain presence and significantly larger holder base (173,484 vs. 91,778) indicate broader adoption and network effects.
V. Supply Dynamics
| Parameter | Gitcoin (GTC) | The Graph (GRT) |
|---|---|---|
| Total Supply | 100,000,000 | 10,800,262,816.04821 |
| Max Supply | 100,000,000 | 10,800,262,823.32 |
| Circulating Supply | 96,384,727.71 | 10,655,891,273.82 |
| Circulation Ratio | 96.38% | 98.66% |
| Fully Diluted Valuation | $12,820,000 | $401,553,771.50 |
The Graph exhibits higher inflation potential through its maximum supply structure, with approximately 98.66% of tokens already in circulation, reflecting an mature tokenomics design.
VI. Risk Considerations
Both assets exhibit significant price volatility characteristic of the cryptocurrency sector:
- Market Cycle Risk: Year-over-year declines exceeding 82% for both tokens indicate substantial exposure to broad market downturns.
- Liquidity Risk: Despite Gitcoin's recent price point of $0.1282, its lower trading volume suggests potential execution challenges during periods of high volatility.
- Regulatory Risk: Infrastructure-focused tokens face uncertain regulatory treatment in evolving jurisdictions.
- Market Sentiment: The current "Extreme Fear" index reading suggests elevated market stress conditions.
VII. Community and Ecosystem Engagement
Gitcoin (GTC):
- Official Website: https://gitcoin.co/
- Twitter: https://twitter.com/gitcoin
- Community: Reddit community available at https://www.reddit.com/r/gitcoincommunity
The Graph (GRT):
- Official Website: https://thegraph.com/
- Twitter: https://twitter.com/graphprotocol
- Community: Reddit at https://www.reddit.com/r/thegraph
- Development Resources: Multiple GitHub repositories available for developers
Conclusion
Gitcoin and The Graph represent distinct segments within the blockchain infrastructure ecosystem. The Graph commands a substantially larger market capitalization ($401.55M vs. $12.82M), broader exchange listing coverage, and greater holder distribution, reflecting deeper market integration. Both assets currently experience downward price pressure consistent with the broader cryptocurrency market decline and prevailing "Extreme Fear" sentiment. Investment consideration should account for protocol utility, ecosystem development trajectory, and individual risk tolerance within the volatile cryptocurrency asset class.
Gitcoin (GTC) Investment Value Analysis Report
Executive Summary
This report analyzes the core investment factors of Gitcoin (GTC) based on available reference materials. The analysis focuses on tokenomics, ecosystem mechanisms, and governance structures that influence investment value.
I. Core Investment Value Factors of Gitcoin
Token Economics Model
Gitcoin (GTC) Supply Mechanism:
- Fixed issuance of 100 million tokens
- Tokens are fully in circulation
- Governance token with value recovery mechanisms through token burning and repurchase mechanisms
Ecosystem Mechanism & Public Goods Financing
Grant Distribution Model:
- Gitcoin employs a quadratic voting model for project crowdfunding and capital allocation
- Addresses inefficient public product financing in the Ethereum ecosystem
- Functions as a positive feedback loop: success → reinvestment → continued success
Support Functions:
- Provides funding, technical support, and marketing assistance to ecosystem development
- Evolved from initial open-source software developer incentives to establishing funding pools for projects, education, and media
- Promotes Web3 open-source technology development
Governance & DAO Structure
Governance Characteristics:
- Serves as a governance token for the Gitcoin ecosystem
- Community DAO ownership of liquidity assets ensures token value remains within the network
- Part of treasury building mechanisms rather than simple mining rewards
II. Factors Influencing Investment Value
Core Value Drivers
The investment value of Gitcoin primarily depends on:
- Ability to Support Open-Source Projects: Effectiveness in distributing grants and supporting ecosystem development
- Governance Mechanism Quality: Strength of DAO governance structures and community participation
- Ecosystem Resilience: The sustainability of the success-reinvestment-success cycle
Market Influence Factors
- Market volatility and blockchain ecosystem conditions
- Overall cryptocurrency market cycles
- Adoption rates of quadratic voting and grant mechanisms within the Web3 community
III. Key Observations
Supply constraints through fixed issuance combined with deflationary mechanisms (token burning and repurchases) create potential long-term value support.
The utility value of GTC is fundamentally tied to Gitcoin's effectiveness as a decentralized public goods funding platform, distinguishing it from purely speculative assets.
Report Date: December 21, 2025
Disclaimer: This report is based on available reference materials and should not be construed as investment advice. Cryptocurrency investments carry significant risks.
III. 2025-2030 Price Forecast: GITCOIN vs GRT
Short-term Forecast (2025)
- GITCOIN: Conservative $0.087108 - $0.1281 | Optimistic $0.143472
- GRT: Conservative $0.0267192 - $0.03711 | Optimistic $0.0452742
Mid-term Forecast (2027-2028)
- GITCOIN may enter a consolidation and recovery phase, with projected price range of $0.1375 - $0.2369
- GRT may enter a growth acceleration phase, with projected price range of $0.0342 - $0.0711
- Key drivers: institutional capital inflows, spot ETF approvals, ecosystem development expansion
Long-term Forecast (2030)
- GITCOIN: Base case $0.203933 - $0.261452 | Optimistic scenario $0.284983
- GRT: Base case $0.043755 - $0.076764 | Optimistic scenario $0.102096
Disclaimer: This analysis is based on historical data and statistical models. Cryptocurrency markets are highly volatile and subject to regulatory, technological, and macroeconomic factors. Past performance does not guarantee future results. This content is for informational purposes only and should not be construed as investment advice. Please conduct your own research and consult with qualified financial advisors before making investment decisions.
GITCOIN:
| 年份 | 预测最高价 | 预测平均价格 | 预测最低价 | 涨跌幅 |
|---|---|---|---|---|
| 2025 | 0.143472 | 0.1281 | 0.087108 | 0 |
| 2026 | 0.19553184 | 0.135786 | 0.08011374 | 6 |
| 2027 | 0.2368922556 | 0.16565892 | 0.1374969036 | 29 |
| 2028 | 0.267696531774 | 0.2012755878 | 0.128816376192 | 57 |
| 2029 | 0.28841785353801 | 0.234486059787 | 0.22276175679765 | 83 |
| 2030 | 0.28498263276213 | 0.261451956662505 | 0.203932526196753 | 104 |
GRT:
| 年份 | 预测最高价 | 预测平均价格 | 预测最低价 | 涨跌幅 |
|---|---|---|---|---|
| 2025 | 0.0452742 | 0.03711 | 0.0267192 | 0 |
| 2026 | 0.056433177 | 0.0411921 | 0.030482154 | 10 |
| 2027 | 0.065897061975 | 0.0488126385 | 0.03416884695 | 31 |
| 2028 | 0.0711200142945 | 0.0573548502375 | 0.03097161912825 | 54 |
| 2029 | 0.08929003084974 | 0.064237432266 | 0.03918483368226 | 72 |
| 2030 | 0.102095762971967 | 0.07676373155787 | 0.043755326987985 | 106 |
Comparative Investment Analysis: Gitcoin (GTC) vs The Graph (GRT)
IV. Investment Strategy Comparison: GTC vs GRT
Long-term vs Short-term Investment Strategies
Gitcoin (GTC): Suitable for investors focused on public goods funding mechanisms and ecosystem development potential within the Web3 open-source community. The fixed supply of 100 million tokens combined with deflationary mechanisms (token burning and repurchases) may provide long-term value support. Best suited for investors with medium to long-term horizons (2-3+ years) who believe in the GitcoinDAO governance model.
The Graph (GRT): Suitable for investors seeking exposure to decentralized data infrastructure with broader market adoption and network effects. The multi-chain presence (Ethereum and Arbitrum) and significantly larger holder base (173,484 addresses) suggest greater ecosystem integration. The higher trading volume and exchange listings provide better liquidity for both short-term trading and long-term positioning.
Risk Management and Asset Allocation
Conservative Investor Profile:
- Gitcoin (GTC): 15-20% | The Graph (GRT): 80-85%
- Rationale: GRT's larger market capitalization ($401.55M vs $12.82M), superior liquidity, and broader exchange coverage reduce execution risk. GTC's smaller market cap introduces higher volatility and liquidity concerns.
Aggressive Investor Profile:
- Gitcoin (GTC): 35-45% | The Graph (GRT): 55-65%
- Rationale: Aggressive investors may allocate higher percentages to GTC given its potential for greater upside in favorable market conditions, though acknowledging elevated volatility.
Hedging Tools:
- Stablecoin allocation (USDC, USDT) for downside protection during "Extreme Fear" periods
- Cross-asset diversification across infrastructure-focused tokens
- Consider dollar-cost averaging entry strategies given the current extreme fear sentiment (20 on Fear & Greed Index)
V. Potential Risk Comparison
Market Risk
Gitcoin (GTC):
- Smaller market capitalization ($12.82M) creates vulnerability to sudden liquidity events and price swings
- Limited exchange presence (21 exchanges vs GRT's 53) reduces trading options during market stress
- Year-over-year decline of -82.33% reflects significant exposure to market cycle downturns
- 30-day decline of -15.55% suggests continued downward pressure
The Graph (GRT):
- Year-over-year decline of -83.0099% indicates comparable market vulnerability despite larger scale
- 30-day decline of -24.18% demonstrates steeper recent deterioration than GTC
- However, substantially higher trading volume ($40,253.30 vs $12,234.15) provides greater execution liquidity
Technology Risk
Gitcoin (GTC):
- Reliant on Ethereum blockchain (single-chain deployment)
- Smart contract risk associated with governance mechanisms and fund distribution protocols
- Dependence on quadratic voting algorithm implementation and potential exploitation vectors
The Graph (GRT):
- Multi-chain implementation reduces single-point-of-failure risk
- Indexing protocol reliability critical to ecosystem functionality
- Network security depends on adequate indexer participation and stake levels
- Query accuracy and data freshness contingent on indexer economic incentives
Regulatory Risk
Global Regulatory Environment:
- Both tokens face uncertainty regarding classification as securities or utility tokens in major jurisdictions
- Gitcoin's public goods funding model may face scrutiny regarding governance token utility
- The Graph's data indexing protocol less likely to face payment-related regulatory constraints
- Infrastructure tokens generally receive more favorable regulatory treatment than speculative assets
VI. Conclusion: Which Is the Better Buy?
📌 Investment Value Summary:
Gitcoin (GTC) Strengths:
- Fixed supply of 100M tokens with deflationary mechanisms (token burning and repurchases)
- Addresses critical public goods funding gap in Web3 ecosystem
- Governance utility through GitcoinDAO participation
- Potential for value appreciation if ecosystem adoption accelerates
- Smaller market cap offers greater upside potential in favorable scenarios
The Graph (GRT) Strengths:
- 30x larger market capitalization ($401.55M) providing greater stability
- Multi-chain deployment (Ethereum and Arbitrum) reduces dependency risk
- Significantly larger holder base (173,484 vs 91,778) indicates broader adoption
- Superior trading liquidity across 53 exchanges versus 21 for GTC
- Core utility deeply embedded in blockchain data infrastructure layer
- Higher trading volume enables easier position entry/exit
✅ Investment Recommendations:
Beginner Investors: The Graph (GRT) is the more appropriate choice. Superior liquidity, broader market adoption, and larger ecosystem footprint reduce execution risk and learning complexity. The infrastructure utility proposition is more straightforward than Gitcoin's public goods funding model.
Experienced Investors: Consider a dual-position allocation with primary weighting toward GRT (65-75%) for portfolio stability, supplemented by GTC (25-35%) for asymmetric upside exposure. Employ dollar-cost averaging given the "Extreme Fear" market sentiment. Actively monitor GitcoinDAO governance developments and The Graph's multi-chain expansion roadmap.
Institutional Investors: GRT represents the more appropriate institutional allocation due to its significantly larger market cap, superior liquidity infrastructure, and established ecosystem partnerships. GTC may be considered as a smaller satellite position for emerging ecosystem exposure, requiring substantial due diligence on governance mechanisms and fund utilization efficiency.
⚠️ Risk Disclaimer: Cryptocurrency markets exhibit extreme volatility with year-over-year declines exceeding 82% for both analyzed assets. The current market sentiment reading of "Extreme Fear" (index: 20) indicates heightened risk conditions. This analysis is based on historical data and available reference materials as of December 21, 2025. Past performance does not guarantee future results. This content is provided for informational purposes only and should not be construed as investment advice. Conduct independent research and consult qualified financial advisors before making investment decisions. None
FAQ: GITCOIN vs THE GRAPH Investment Comparison
I. Frequently Asked Questions
Q1: What are the key differences in market positioning between Gitcoin (GTC) and The Graph (GRT)?
A: The Graph maintains significantly larger market dominance with a market capitalization of $401.55M compared to Gitcoin's $12.82M—approximately 31 times larger. The Graph is ranked 142 by market cap while Gitcoin ranks 1,073. The Graph operates as a decentralized data indexing protocol with broader ecosystem integration across Ethereum and Arbitrum blockchains, while Gitcoin functions as a public goods funding platform with governance utility through GitcoinDAO. The Graph's 173,484 token holders significantly outnumber Gitcoin's 91,778 holders, indicating deeper market adoption.
Q2: Which asset demonstrates better liquidity and trading accessibility?
A: The Graph exhibits substantially superior liquidity characteristics. GRT maintains 24-hour trading volume of $40,253.30 across 53 supported exchanges, compared to Gitcoin's $12,234.15 volume across 21 exchanges. This 3.3x higher trading volume and 2.5x greater exchange coverage enables substantially easier position entry and exit for investors of all sizes, reducing execution risk during volatile market conditions.
Q3: How have both assets performed relative to their all-time highs?
A: Both assets have experienced dramatic depreciation from their peaks. Gitcoin declined from an all-time high of $22.37 (November 27, 2021) to current levels of $0.1282, representing a -99.43% decline from peak. The Graph fell from $2.84 (February 12, 2021) to $0.03718, representing a -98.69% decline from peak. Recent year-over-year performance shows Gitcoin down -82.33% and The Graph down -83.0099%, indicating comparable vulnerability to current market cycle dynamics despite vastly different scales.
Q4: What are the supply dynamics and inflation risks for each token?
A: Gitcoin operates under fixed tokenomics with a maximum supply of 100 million tokens, currently 96.38% in circulation (96,384,727.71 tokens). This creates potential deflationary pressure through token burning and repurchase mechanisms. The Graph has substantially larger supply dynamics with maximum supply of 10.8B tokens and 98.66% already in circulation (10.655B tokens), indicating mature tokenomics with higher inflation potential. Gitcoin's constrained supply may provide stronger long-term value support mechanisms.
Q5: Which investment is more suitable for conservative investors?
A: The Graph (GRT) represents the more appropriate choice for risk-averse investors. Conservative allocation recommendations suggest 80-85% in GRT and 15-20% in GTC. GRT's superior market capitalization, broader exchange coverage, higher trading liquidity, larger holder base, and multi-chain infrastructure reduce execution and liquidity risks. The current "Extreme Fear" market sentiment (Fear & Greed Index: 20) favors larger-capitalization assets with established ecosystem integration over smaller-cap alternatives.
Q6: What are the core utility differences between these tokens?
A: Gitcoin (GTC) functions primarily as a governance token for GitcoinDAO, enabling community participation in public goods funding allocation decisions through quadratic voting mechanisms. Token utility centers on ecosystem coordination and treasury management rather than protocol-level economic functions. The Graph (GRT) possesses deeper protocol-level utility: indexers stake GRT for economic security and query market participation, curators stake GRT to signal valuable subgraphs, and GRT serves as the settlement mechanism for all query transactions. GRT's utility is more fundamentally embedded within protocol operations.
Q7: What is the long-term price outlook for each asset through 2030?
A: Price forecasts through 2030 (base case scenarios) project Gitcoin reaching $0.203933 - $0.261452 with optimistic scenarios reaching $0.284983, representing approximately 104% appreciation from current levels. The Graph forecasts project $0.043755 - $0.076764 with optimistic scenarios at $0.102096, representing approximately 106% appreciation from current levels. Both forecasts acknowledge substantial volatility, regulatory uncertainty, and dependence on ecosystem adoption acceleration. Mid-term forecasts (2027-2028) suggest Gitcoin consolidation-recovery phases while GRT may experience growth acceleration driven by institutional capital inflows and protocol expansion.
Q8: Which asset presents better risk-adjusted investment potential for different investor profiles?
A: Beginner Investors: The Graph (GRT) offers superior risk-adjusted potential through larger market cap, broader adoption, and straightforward infrastructure utility proposition. Experienced Investors: Dual-position allocation with 65-75% GRT and 25-35% GTC enables portfolio stability while capturing asymmetric GTC upside. Aggressive Investors: Higher GTC allocation (35-45%) acceptable for investors tolerating elevated volatility. Institutional Investors: GRT represents primary allocation vehicle due to scale and liquidity; GTC considered only as satellite emerging-ecosystem exposure. All profiles should employ dollar-cost averaging strategies given current extreme market fear conditions.
Report Date: December 21, 2025
Disclaimer: This FAQ content is based on reference materials and historical data as of December 21, 2025. Cryptocurrency markets exhibit extreme volatility with both assets declining over 82% year-over-year. This analysis is provided for informational purposes only and does not constitute investment advice. Conduct independent research and consult qualified financial advisors before making investment decisions.
Share
Content
Introduction: GITCOIN vs GRT Investment Comparison
I. Historical Price Comparison and Current Market Status
II. Project Overview and Utility
III. Price Performance Analysis
IV. Blockchain Implementation and Network Distribution
V. Supply Dynamics
VI. Risk Considerations
VII. Community and Ecosystem Engagement
Conclusion
Executive Summary
I. Core Investment Value Factors of Gitcoin
II. Factors Influencing Investment Value
III. Key Observations
III. 2025-2030 Price Forecast: GITCOIN vs GRT
IV. Investment Strategy Comparison: GTC vs GRT
V. Potential Risk Comparison
VI. Conclusion: Which Is the Better Buy?
I. Frequently Asked Questions
How to Buy Cryptocurrency


Trending Cryptocurrencies


How Does SIREN Token Distribution Work: Team, Investor, and Community Allocation Explained

What is Hedera: Understanding its Blockchain technology and application cases in 2025

MileVerse (MVC) Project Analysis: How Its White Paper Drives DeFi Mileage Exchange Innovation

What is QNT: Understanding the Cryptocurrency Powering Enterprise Blockchain Solutions

What is ICP: Understanding the Internet Content Provider License and Its Importance for Websites in China
What is GT: Understanding the Meaning and Applications of Gran Turismo in Automotive World

Guide to Claiming Digital Asset Airdrops
Is IDEX (IDEX) a good investment?: A Comprehensive Analysis of Price Potential, Market Risks, and Future Prospects in 2024
Is SIX Network (SIX) a good investment?: A Comprehensive Analysis of Features, Market Potential, and Risk Factors
Top Bitcoin Wallets for Users in Bangladesh
Is Gearbox (GEAR) a good investment?: A Comprehensive Analysis of Risk, Potential Returns, and Market Position in 2024