CCI разработал Дональд Ламберт для выявления циклических движений на товарных рынках, но со временем индикатор стал широко применяться и на других рынках. Трейдеры обращаются к CCI, потому что он показывает, когда цена движется с необычной силой относительно своего недавнего поведения. Благодаря этому индикатор помогает оценивать импульс, выявлять возможные начала тренда и замечать состояния, которые могут быть перегреты.
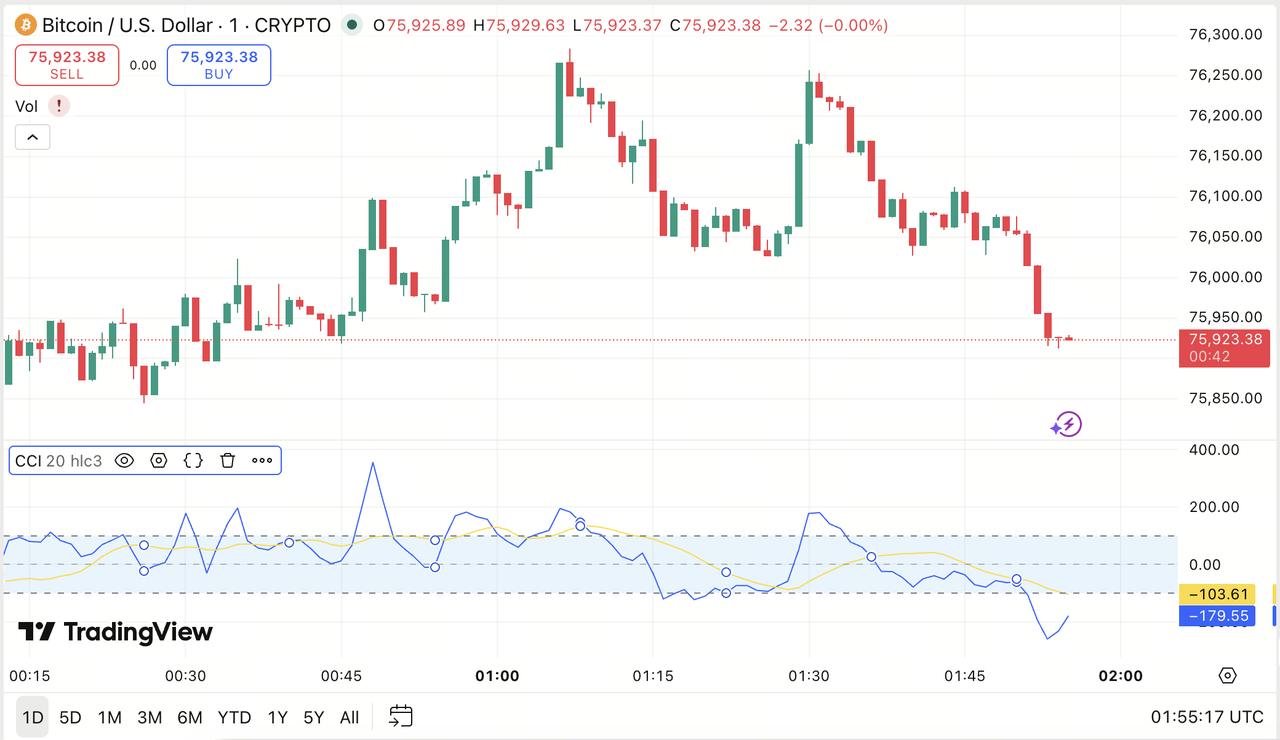
Источник: TradingView
Что такое CCI
CCI — это осциллятор технического анализа, который не предсказывает направление цены, а измеряет, насколько она отклонилась вверх или вниз от своего статистического среднего. Проще говоря, индикатор не говорит трейдерам, что будет дальше, а показывает, торгуется ли актив в пределах своего нормального диапазона или далеко выходит за его границы.
Хотя в названии есть слово «товар», CCI не ограничивается сырьевыми рынками. Его широко применяют для акций, биржевых фондов, валют и криптоактивов. Причина проста: индикатор строится вокруг поведения цены, и эта логика работает на любых рынках.
По сути, CCI выделяет импульс и циклические сдвиги. Когда значение резко растет, цена значительно превышает недавнее среднее. Когда оно резко падает, цена торгуется значительно ниже этого среднего. Такие движения не означают автоматического разворота, но указывают на то, что рыночное поведение стало более экстремальным, чем обычно.
Как рассчитывается CCI
CCI рассчитывается через типичную цену, скользящую среднюю и среднее отклонение. Типичная цена — это среднее арифметическое максимума, минимума и закрытия за период. Затем это значение сравнивается с простой скользящей средней за выбранный период, а результат корректируется на среднее отклонение, чтобы показать, насколько текущее движение необычно по сравнению с недавними ценами.
Стандартная формула:
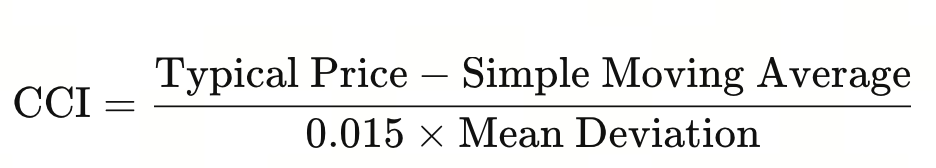
где:
Типичная цена — цена актива в конкретный день за период
Простая скользящая средняя — среднее арифметическое цены актива за период
Среднее отклонение — среднее абсолютных отклонений цены актива за период
Константа 0,015 масштабирует индикатор так, чтобы при нормальных рыночных условиях большинство значений попадало в диапазон от -100 до +100. Именно поэтому эти два уровня стали стандартными ориентирами в техническом анализе.
Обычно используется 20 периодов, но трейдеры могут корректировать окно в зависимости от актива. Более короткий период делает CCI чувствительнее — сигналов становится больше, но и шума тоже. Более длинный период сглаживает индикатор, снижая число ложных сигналов, хотя реакция замедляется.
Для новичков важнее не формула, а идея: CCI измеряет, насколько необычна текущая цена по сравнению с ее недавним средним поведением. Чем дальше от нуля, тем более исключительным считается движение.
Чтение уровней CCI: перекупленность, перепроданность и нулевая линия
CCI чаще всего интерпретируют через три зоны: выше +100, ниже -100 и около нулевой линии. Эти уровни превращают математическое значение в практический инструмент рыночного анализа.
Когда CCI уходит выше +100, это обычно указывает на сильный восходящий импульс: цена значительно превысила недавнее среднее. Такое состояние часто называют перекупленностью. Однако перекупленность не означает, что цена немедленно упадет. В сильном восходящем тренде CCI может оставаться повышенным продолжительное время.
Когда CCI падает ниже -100, это говорит о сильном нисходящем импульсе: цена ушла значительно ниже недавнего среднего. Это состояние называют перепроданностью. Но, как и в случае с перекупленностью, перепроданность может сохраняться в рамках устойчивого тренда.
Нулевая линия дает простой способ определить направление. Если CCI выше нуля, цена в целом торгуется выше своего недавнего среднего — это бычий сигнал. Если ниже нуля — цена ниже среднего, что указывает на медвежий настрой.
Поэтому многие трейдеры используют CCI сразу в двух режимах: следят за уровнями +100 и -100 для экстремального импульса, а нулевую линию — для понимания общего направленного уклона. Так индикатор помогает не только выявлять перегретые состояния, но и отслеживать общий тон тренда.
CCI для выявления начал трендов и разворотов
Одно из самых практичных применений CCI — определение моментов, когда тренд только зарождается. Движение выше +100 может указывать на достаточно сильный бычий импульс для начала восходящего тренда. Движение ниже -100 — на сильный медвежий импульс, сигнализирующий о начале нисходящего тренда.
Именно поэтому CCI часто считают не просто индикатором перекупленности-перепроданности. Во многих случаях сильные значения — это не предупреждения об истощении, а признаки расширения импульса и решительного отрыва цены от своего недавнего среднего.
CCI также используют для поиска возможных разворотов через дивергенцию. Медвежья дивергенция возникает, когда цена продолжает расти или держится около максимумов, а CCI начинает снижаться. Бычья дивергенция — когда цена продолжает падать или остается у минимумов, а CCI начинает расти. В обоих случаях сигнал один: импульс, возможно, больше не поддерживает текущее направление цены.
Тем не менее, с сигналами разворота нужно быть осторожным. Дивергенция может появиться задолго до фактического разворота цены. Поэтому трейдеры часто комбинируют CCI с другими инструментами: свечными паттернами, зонами поддержки и сопротивления, скользящими средними или линиями тренда. В изоляции CCI информативен, но в контексте он становится гораздо полезнее.
| Показание или поведение CCI |
Распространенная интерпретация |
Что трейдеры часто отслеживают дальше |
| Выше +100 |
Сильный восходящий импульс, возможна перекупленность |
Продолжается ли тренд или начинает ослабевать |
| Ниже -100 |
Сильный нисходящий импульс, возможна перепроданность |
Остается ли давление продаж сильным или начинает ослабевать |
| Пересечение выше нуля |
Бычий сдвиг относительно недавнего среднего |
Подтверждение от пробоя или более высоких минимумов |
| Пересечение ниже нуля |
Медвежий сдвиг относительно недавнего среднего |
Подтверждение от пробоя вниз или более низких максимумов |
| Бычья дивергенция |
Нисходящий импульс может ослабевать |
Признаки стабилизации или отскока цены |
| Медвежья дивергенция |
Восходящий импульс может ослабевать |
Признаки отклонения или разворота около сопротивления |
CCI в криптовалютах против традиционных рынков
CCI работает и на криптовалютных, и на традиционных рынках по одной причине: он измеряет соотношение между текущей ценой и недавней средней ценой. Логика индикатора одинакова для всех классов активов, но его поведение может различаться из-за разной структуры рынка и волатильности.
На традиционных рынках, например акциях крупной капитализации или диверсифицированных ETF, ценовые колебания обычно менее экстремальны, чем в криптовалютах. Это делает показания CCI несколько проще для интерпретации, особенно около уровней +100 и -100. Сигналы появляются реже, но и хаотичность ниже.
Криптовалютные рынки быстрее и волатильнее. Резкие движения чаще загоняют CCI на экстремальные уровни, и индикатор может быстро разворачиваться вслед за сменой настроений. Поэтому новичок, использующий CCI на криптографиках, заметит больше сигналов и больше ложных срабатываний.
Это не делает CCI менее полезным для криптовалют. Просто интерпретация требует большего контекста. Важен временной горизонт, сила тренда, и особенно подтверждение. На высоковолатильных рынках CCI все еще эффективно выделяет импульс, но трейдерам стоит читать его вместе с ценовой структурой, а не рассматривать каждое пересечение порога как самостоятельное решение.
Ограничения CCI
CCI полезен, но у него есть четкие ограничения. Первое: он может давать ложные сигналы, особенно на нестабильных или боковых рынках. Когда цена лишена направления, индикатор колеблется выше и ниже ключевых уровней, не приводя к значимому тренду.
Второе ограничение: настройки имеют значение. Период, который хорошо работает для одного актива, может не подойти другому. Если временной интервал плохо согласован с поведением рынка, CCI становится либо слишком чувствительным, либо слишком медленным.
Третье: показания перекупленности и перепроданности можно неправильно истолковать. Эти термины звучат решительно, но на деле они описательные, а не прогностические. Они показывают, что цена далеко ушла от среднего, а не то, что разворот неизбежен.
Еще одно ограничение: CCI лучше всего работает как часть более широкого фреймворка. Сам по себе он дает полезную информацию об импульсе, но не учитывает структуру рынка, объем, макроновости или ключевые уровни поддержки и сопротивления. Поэтому многие трейдеры сочетают его с другими индикаторами и инструментами на графиках.
В этом смысле CCI — не полноценная торговая система, а способ яснее читать поведение цены. Его ценность — в интерпретации, а не в обещании определенности.
Заключение
CCI — это осциллятор импульса, который измеряет отклонение цены от ее недавнего среднего. Трейдеры используют его для выявления сильного импульса, распознавания перекупленности или перепроданности, а также для обнаружения возможных начал трендов или разворотов.
Польза CCI — в способности превращать поведение цены в четкий сигнал импульса. Значение выше или ниже ключевых уровней показывает, когда рынок движется с необычной силой, а нулевая линия помогает определить общий направленный уклон.
В то же время CCI эффективен только в контексте. Это не самостоятельный ответ на вопрос о направлении рынка, а практичный инструмент для понимания того, когда цена ведет себя нормально, а когда начинает двигаться с необычной интенсивностью. Для новичков это один из самых доступных индикаторов для изучения анализа импульса.
Часто задаваемые вопросы
Что означает аббревиатура CCI?
CCI расшифровывается как Commodity Channel Index (Индекс товарного канала). Это технический индикатор, который измеряет отклонение цены от ее недавнего среднего.
Используется ли CCI только для товаров?
Нет. Хотя изначально индикатор был разработан для товарных рынков, сейчас его применяют для акций, форекса, ETF и криптовалют.
Что означает значение CCI выше +100?
Значение выше +100 обычно указывает на сильный восходящий импульс: рынок торгуется значительно выше недавнего среднего. Это может свидетельствовать о силе тренда, а не о скором развороте.
Что означает значение CCI ниже -100?
Значение ниже -100 обычно указывает на сильный нисходящий импульс: рынок торгуется значительно ниже недавнего среднего. Это сигнал слабости, но не обязательно немедленного отскока.
Надежен ли CCI сам по себе?
CCI может быть полезен и самостоятельно, но в сочетании с другими индикаторами или инструментами графического анализа он работает эффективнее. Лучше всего использовать его в рамках более широкого взгляда на рыночные условия.