Una puntuación alta señala que una parte significativa de las principales altcoins está superando el rendimiento de Bitcoin, mientras que una puntuación baja indica que Bitcoin sigue mostrando mayor fortaleza relativa. Según la metodología habitual, una Altcoin Season comienza cuando al menos el 75 % de las principales altcoins seleccionadas superan a Bitcoin en un periodo de 90 días. Normalmente, las stablecoins y los tokens respaldados por activos quedan excluidos de la comparación.
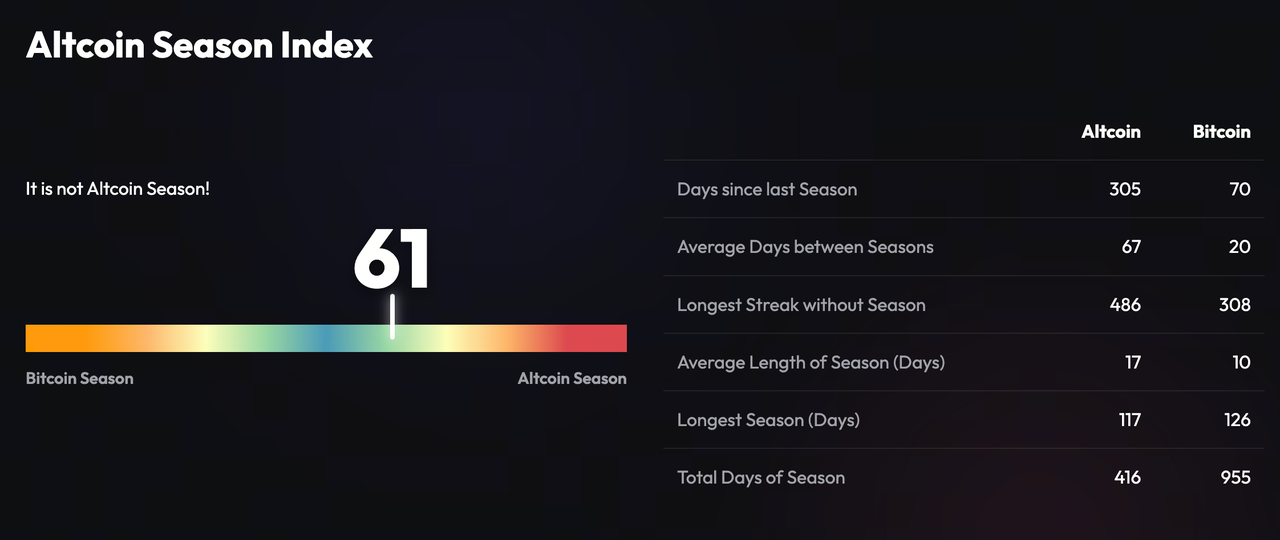
En la instantánea de mercado actualizada para este artículo, el Índice de Temporada de Altcoins se sitúa en 61. Esto confirma que las altcoins han ganado fuerza relativa, aunque la lectura permanece por debajo del umbral de 75 necesario para validar una Altcoin Season. A partir de aquí, el artículo detalla cómo se calcula el índice, cómo interpretar sus señales, qué ha desencadenado temporadas de altcoins en ciclos anteriores, cómo lo utilizan los traders en sus estrategias y dónde resultan más relevantes sus ventajas, limitaciones e implicaciones para la gestión del riesgo.
¿Qué es la Altcoin Season?
La Altcoin Season es un periodo en el que un amplio conjunto de criptomonedas distintas de Bitcoin obtiene rentabilidades superiores a las de Bitcoin. No basta con que algunas altcoins suban o que Bitcoin caiga: la clave es una superación relativa generalizada y sostenida en todo el mercado de altcoins.
Una Altcoin Season puede coincidir con un mercado cripto alcista, pero también puede producirse cuando Bitcoin se mantiene lateral y el capital rota hacia otros activos. En estos escenarios, los traders buscan oportunidades de mayor crecimiento en sectores como plataformas de smart contracts, finanzas descentralizadas, inteligencia artificial, gaming, infraestructura y activos reales tokenizados.
Las altcoins suelen contar con menor capitalización de mercado y liquidez que Bitcoin. Esto les permite registrar mayores aumentos porcentuales cuando sube la demanda, pero también las expone a correcciones bruscas, diferenciales más amplios y cambios repentinos en el sentimiento del mercado.
¿Cómo funciona el Índice de Temporada de Altcoins?
El Índice de Temporada de Altcoins compara el rendimiento del precio de Bitcoin en 90 días con el de un grupo seleccionado de altcoins líderes. Calcula el porcentaje de esas altcoins que han generado una rentabilidad superior a la de Bitcoin.
El cálculo básico es:
Índice de Temporada de Altcoins = Número de altcoins que superan a Bitcoin ÷ Total de altcoins medidas × 100
Por ejemplo, si 30 de las 50 altcoins medidas superan a Bitcoin, el índice marcaría 60. Si al menos el 75 % supera a Bitcoin, el mercado entra en Altcoin Season según el umbral estándar del índice.
La ventana móvil de 90 días reduce el peso de movimientos diarios aislados. Sin embargo, el índice se basa en datos históricos, por lo que describe la estructura actual del mercado sin predecir con certeza la evolución futura de los precios.
Cómo interpretar el Índice de Temporada de Altcoins
El índice se presenta en una escala de 0 a 100. Valores bajos favorecen a Bitcoin, valores altos a las altcoins, y las lecturas intermedias reflejan un mercado mixto o en transición.
| Rango del índice |
Interpretación general |
Lo que indica |
| 0–24 |
Bitcoin Season |
La mayoría de las altcoins medidas rinden por debajo de Bitcoin |
| 25–49 |
Mercado inclinado hacia Bitcoin |
Bitcoin sigue siendo más fuerte, pero el rendimiento se vuelve más mixto |
| 50–74 |
Mercado de transición o con fortaleza creciente de altcoins |
Más altcoins superan a Bitcoin, pero no se ha alcanzado el umbral de 75 |
| 75–100 |
Altcoin Season |
Al menos el 75 % de las altcoins medidas han superado a Bitcoin |
Estos rangos no son señales automáticas de trading. Una lectura de 74 no implica que todas las altcoins sean fuertes, ni un salto a 75 garantiza que la tendencia continúe.
También importa la dirección del índice. Un ascenso de 30 a 60 puede indicar una mejora general, aunque la Altcoin Season no haya comenzado formalmente. Una caída de 85 a 65 puede señalar que el impulso de las altcoins se debilita, aunque la puntuación siga siendo alta.
Fuente: Blockchain Center
¿Qué significa la lectura actual de 61 en el Índice de Temporada de Altcoins?
Una lectura de 61 indica que una proporción relevante de altcoins líderes ha superado a Bitcoin en los últimos 90 días. Sin embargo, la puntuación sigue 14 puntos por debajo del umbral de 75, por lo que el mercado aún no cumple la definición de Altcoin Season según el índice.
Esta lectura corresponde a una fase de transición o de fortaleza creciente en altcoins. El capital puede estar rotando fuera de Bitcoin hacia sectores y tokens concretos, pero la superación no es lo suficientemente amplia como para confirmar una rotación generalizada.
Los datos históricos muestran que las Altcoin Season suelen ser menos frecuentes y más cortas que las Bitcoin Season. En la instantánea analizada, la Altcoin Season promedio duró 17 días, frente a 10 días para una Bitcoin Season, y el número total de días de Bitcoin Season fue mucho mayor. Esto refuerza que las Altcoin Season confirmadas son condiciones de mercado selectivas, no una constante en cada ciclo alcista.
El índice puede variar a medida que se actualiza la ventana móvil de 90 días. Activos con buenos rendimientos anteriores pueden dejar de influir en el cálculo, mientras que ganancias o pérdidas recientes pueden hacer que más altcoins superen o no a Bitcoin.
El gráfico actualizado del Top 50 revela diferencias notables entre los principales criptoactivos en el último periodo de 90 días. RAIN lideró el grupo con una subida del 78,8 %, seguido por ONDO con 52,6 %, ZEC con 47,5 %, HYPE con 41,7 % y WLD con 33,8 %.
Otros activos con rentabilidad positiva fueron NEAR (30,1 %), UNI (19,4 %), STABLE (15,0 %), XLM (10,3 %), AAVE (6,2 %), WBT (5,5 %), JTRSY (3,6 %), TRX (3,2 %), USDG0 (2,8 %), BUILDL (2,7 %) y MORPHO (2,4 %).
Bitcoin registró una caída del 14,2 % en el mismo periodo. Varios activos que también tuvieron rentabilidades negativas superaron igualmente a Bitcoin porque cayeron menos, como BNB (−5,9 %), LINK (−6,3 %), SOL (−9,3 %), ICP (−9,8 %) y LTC (−13,7 %).
Este matiz es clave: una altcoin no necesita registrar ganancias para superar a Bitcoin. Si Bitcoin cae un 14,2 % y una altcoin cae un 5 %, esa altcoin cuenta como superior bajo la metodología relativa, aunque los holders igualmente sufran una pérdida.
Fuente:Blockchain Center
Por eso, el gráfico explica cómo el índice puede situarse en 61 sin confirmar una Altcoin Season completa. Varias altcoins superaron ampliamente a Bitcoin, pero la fortaleza se concentró en una parte del mercado y no se extendió al 75 % de los activos medidos.
¿Qué muestra el Índice de Temporada de Altcoins histórico?
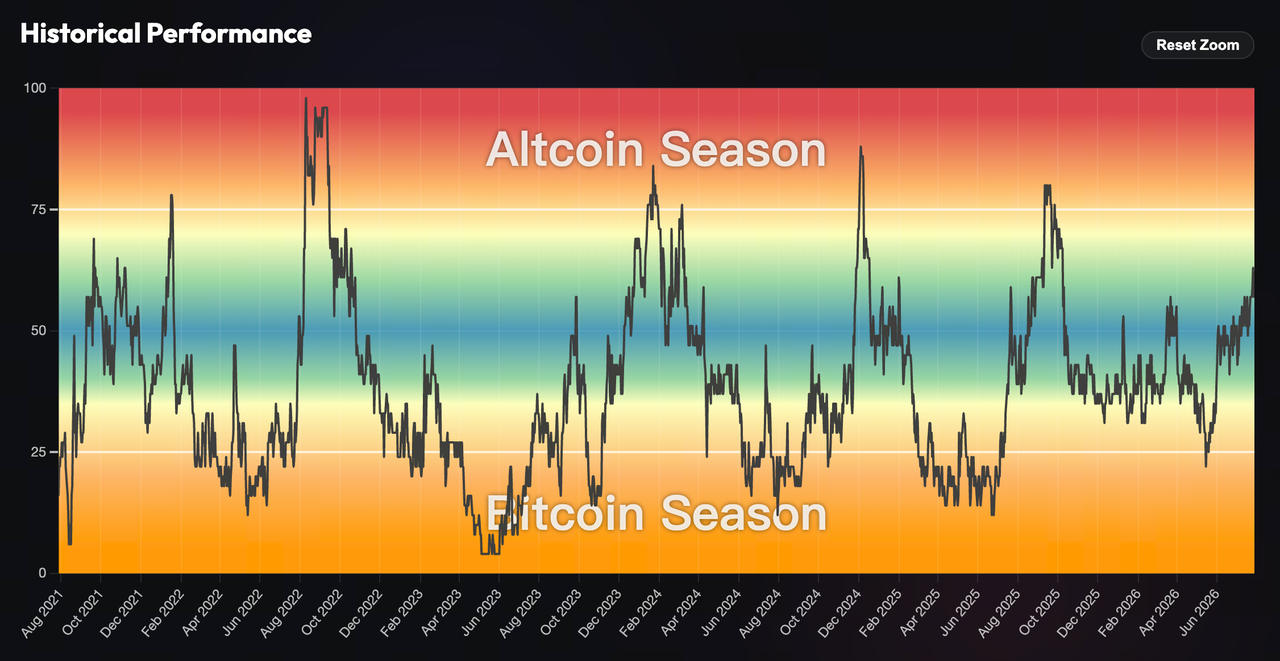
El gráfico histórico refleja la evolución del índice desde agosto de 2021 hasta mediados de 2026, con alternancia entre periodos dominados por Bitcoin, fases de transición y Altcoin Season relativamente breves.
Lecturas superiores a 75 se dieron en varios momentos concretos: finales de 2021, segunda mitad de 2022, inicios y finales de 2024, y finales de 2025. Sin embargo, estos picos fueron seguidos a menudo por caídas rápidas, lo que evidencia que la fortaleza generalizada de altcoins suele ser temporal.
También se observan periodos prolongados por debajo de 25, especialmente a mediados de 2023 y en partes de 2025, señalando que Bitcoin superó a la mayoría de altcoins durante esas ventanas móviles de 90 días.
Para mediados de 2026, el índice había rebotado desde un mínimo y rondaba el 61. Esta tendencia al alza sugiere una mayor amplitud en altcoins, pero el historial demuestra que el índice puede revertirse antes de alcanzar o mantener el umbral de Altcoin Season.
Fuente: Blockchain Center
¿Qué factores pueden desencadenar una Altcoin Season?
Una Altcoin Season suele surgir de la combinación de rotación de capital, mayor apetito por el riesgo, narrativas sectoriales, liquidez de mercado y el comportamiento del precio de Bitcoin. Ningún factor por sí solo garantiza que el índice supere 75.
Bitcoin lidera normalmente la primera fase de una expansión del mercado cripto. Cuando Bitcoin ya ha subido mucho o empieza a consolidar, algunos traders rotan capital hacia altcoins de mayor riesgo en busca de mejores rentabilidades. Esta rotación puede causar que cada vez más altcoins superen a Bitcoin.
Una caída en la dominancia de Bitcoin refuerza este escenario. La dominancia mide la cuota de Bitcoin sobre la capitalización total del mercado cripto. Si el capital entra en altcoins más rápido que en Bitcoin, la dominancia baja y el Índice de Temporada de Altcoins sube.
Narrativas sectoriales potentes también amplían el rendimiento de altcoins. Avances en IA, DeFi, redes capa 1 y capa 2, activos tokenizados, gaming, tecnología de privacidad o interoperabilidad pueden atraer capital a varios tokens relacionados.
Otras condiciones que pueden favorecer la fortaleza de altcoins son:
-
Más liquidez y volumen de trading en stablecoins.
-
Mayor apetito por el riesgo en mercados globales.
-
Incremento de la actividad on-chain y los ingresos de protocolos.
-
Lanzamientos de productos, mejoras o incentivos en el ecosistema.
-
Mayor claridad regulatoria.
-
Más participación minorista y actividad especulativa.
Estos factores pueden crear un escenario favorable para altcoins, pero también pueden generar subidas sectoriales puntuales sin derivar en una Altcoin Season generalizada.
¿Cómo pueden los traders utilizar el Índice de Temporada de Altcoins?
El índice resulta especialmente útil como indicador de amplitud de mercado en el conjunto de las criptomonedas. Permite a inversores y traders identificar posibles rotaciones de cartera hacia altcoins para buscar rentabilidad, mostrando si el rendimiento está concentrado en Bitcoin, limitado a unas pocas altcoins o extendiéndose a una proporción mayor del mercado.
Un índice en ascenso puede animar a los traders que siguen tendencias a investigar qué sectores y activos impulsan el cambio. En vez de comprar directamente el activo más fuerte, pueden usar el índice como uno de varios indicadores clave para fundamentar decisiones de inversión, analizando volumen de trading, capitalización de mercado, liquidez, suministro de tokens, fundamentales del proyecto y si las subidas recientes responden a desarrollos concretos.
Un índice en descenso puede indicar que el capital retorna a Bitcoin o que el impulso de altcoins se debilita, lo que puede señalar el final de una temporada de altcoins. Esta información ayuda a revisar exposición, ajustar estrategias o acumular posiciones en proyectos con buenos fundamentales, pero no implica que todas las altcoins vayan a caer.
El índice puede combinarse con otros indicadores para analizar tendencias, sentimiento general y posibles rotaciones sectoriales con mayor precisión:
| Indicador |
Utilidad |
| Dominancia de Bitcoin |
Indica si Bitcoin gana o pierde cuota de capitalización total; los traders suelen comparar el índice con gráficos de Dominancia de Bitcoin para confirmar el contexto y detectar cuándo algunos activos superan a BTC |
| Capitalización total de mercado de altcoins |
Permite ver si el capital entra o sale del conjunto de altcoins |
| Volumen de trading |
Confirma si los movimientos de precio tienen respaldo real |
| Liquidez de mercado |
Indica si se pueden abrir o cerrar posiciones sin deslizamiento excesivo |
| Fortaleza relativa frente a BTC |
Mide el rendimiento de una altcoin concreta frente a Bitcoin |
| Datos de desbloqueo de tokens |
Detecta posibles cambios en el suministro circulante |
| Actividad on-chain |
Permite evaluar si el uso de la red respalda el interés de mercado y revela oportunidades potenciales |
El Índice de Temporada de Altcoins no está diseñado para acertar el timing de entrada. Al usar una ventana de 90 días, una lectura alta puede darse después de que muchos activos ya hayan subido, así que debe combinarse con otros análisis, ya que no anticipa rentabilidades futuras ni valora los fundamentales de cada proyecto.
¿Un índice en ascenso implica que todas las altcoins subirán?
No. El índice mide cuántas altcoins seleccionadas superan a Bitcoin, no si todas son rentables o tienen potencial de apreciación.
El rendimiento puede variar mucho incluso durante una Altcoin Season confirmada. Los activos de gran capitalización pueden absorber la mayor parte de la liquidez, mientras que tokens más pequeños permanecen planos o caen. El liderazgo sectorial también puede rotar rápidamente según cambien las narrativas.
El índice solo refleja los activos incluidos en su metodología. Miles de criptomonedas pequeñas o poco líquidas no se incluyen y pueden comportarse de forma muy diferente a los activos principales.
Un token puede considerarse superior a Bitcoin aunque registre una rentabilidad negativa. Por tanto, la fortaleza relativa no equivale a rentabilidad absoluta.
¿Cuáles son los beneficios del Índice de Temporada de Altcoins?
El principal beneficio del Índice de Temporada de Altcoins es que sintetiza datos complejos de rendimiento relativo en una sola puntuación. En vez de comparar manualmente decenas de activos con Bitcoin, permite evaluar rápidamente si la amplitud del mercado de altcoins se fortalece o debilita.
Su metodología móvil de 90 días reduce el impacto de subidas puntuales. Un rally de uno o varios días en algunos tokens no basta para crear una Altcoin Season si el grupo amplio no mantiene ese rendimiento superior durante más tiempo.
El índice es sencillo de interpretar. Los umbrales de 25 y 75 marcan puntos de referencia claros, y el gráfico histórico aporta contexto sobre la duración y frecuencia de fases anteriores.
Combinado con volumen, liquidez, dominancia de Bitcoin e investigación fundamental, el índice ayuda a organizar el análisis del mercado sin ser una señal de trading independiente.
¿Cuáles son las limitaciones del Índice de Temporada de Altcoins?
El índice es retrospectivo, ya que se basa en el rendimiento de los últimos 90 días. Cuando la lectura llega a 75, algunos de los activos más fuertes pueden haber agotado su potencial y estar listos para toma de beneficios.
Los resultados dependen del grupo de activos y la metodología. Cambios en el ranking por capitalización pueden modificar qué criptomonedas se incluyen, mientras que stablecoins y ciertos tokens respaldados por activos se excluyen. Otro proveedor o método de selección puede arrojar una lectura distinta.
La superación relativa puede ser engañosa en mercados bajistas. Si Bitcoin pierde un 20 % y una altcoin un 10 %, la altcoin supera a Bitcoin aunque ambos caigan.
El índice no mide directamente:
-
Fundamentales del proyecto ni adopción del protocolo.
-
Desbloqueos de tokens ni cambios en el suministro circulante.
-
Liquidez de trading ni profundidad de mercado.
-
Riesgos regulatorios o de seguridad.
-
Valoración ni potencial de ingresos futuros.
-
Si un token concreto está sobreextendido.
Por eso, el índice no debe usarse como señal para comprar todas las altcoins ni para reducir automáticamente la exposición a Bitcoin. Describe la amplitud del mercado, no la calidad ni el rendimiento futuro de cada activo.
Cómo gestionar el riesgo durante una Altcoin Season
Las altcoins pueden mostrar alta volatilidad y menor liquidez que Bitcoin, especialmente en fases especulativas, que suelen durar entre 2 y 3 meses, con los movimientos más intensos concentrados en pocas semanas. Un token que sube rápido puede corregir bruscamente si los traders toman beneficios o cambia el sentimiento del mercado.
Por eso, el tamaño de la posición es clave en la gestión del riesgo. No conviene asignar más capital del que se está dispuesto a perder y siempre hay que valorar cómo afectaría una caída sustancial de una posición a la cartera total.
El tipo de orden y la liquidez también importan. Las órdenes de mercado pueden generar deslizamiento en libros de órdenes poco profundos, mientras que las órdenes límite ofrecen más control pero pueden no ejecutarse. El volumen de trading debe analizarse junto al último precio cotizado.
Es fundamental verificar el suministro de tokens, los calendarios de desbloqueo, los riesgos de smart contracts y los desarrollos oficiales del proyecto. Un buen rendimiento pasado no garantiza que la demanda futura absorba nueva oferta ni un uso sostenible del proyecto.
Resumen
El Índice de Temporada de Altcoins mide cuántas altcoins líderes superan a Bitcoin en una ventana móvil de 90 días. Un valor superior a 75 suele indicar Altcoin Season, mientras que por debajo de 25 señala Bitcoin Season.
La lectura actualizada del índice en 61 indica que la fortaleza relativa de las altcoins ha mejorado, pero el mercado aún no supera el umbral que confirma una Altcoin Season. El gráfico de rendimientos lo respalda: varias altcoins superaron claramente a Bitcoin, pero la fuerza no fue lo suficientemente amplia.
Los datos históricos muestran que las Altcoin Season confirmadas pueden ser breves y revertirse rápidamente. El índice es útil para entender la amplitud del mercado y la rotación de capital, no para anticipar puntos exactos de entrada o salida.
Conviene combinar el índice con dominancia de Bitcoin, capitalización de mercado, volumen de trading, liquidez, suministro de tokens y fundamentales del proyecto. La superación relativa no garantiza rentabilidad positiva y ningún índice elimina los riesgos de operar con altcoins volátiles.
Preguntas frecuentes
¿Qué es el Índice de Temporada de Altcoins?
El Índice de Temporada de Altcoins es un indicador de 0 a 100 que mide cuántas altcoins líderes seleccionadas han superado a Bitcoin en una ventana móvil de 90 días.
¿Qué puntuación confirma una Altcoin Season?
Una Altcoin Season se confirma cuando al menos el 75 % de las altcoins medidas superan a Bitcoin en 90 días, obteniendo una lectura de 75 o superior.
¿Una lectura de 61 indica que hay una Altcoin Season en marcha?
No. Una puntuación de 61 refleja una mayor fortaleza de altcoins, pero está por debajo del umbral de 75 necesario para confirmar una Altcoin Season.
¿Qué significa Bitcoin Season?
Bitcoin Season es un periodo en el que Bitcoin supera a la mayoría de las altcoins incluidas en el índice. Suele asociarse a una lectura inferior a 25.
¿El índice puede subir aunque las altcoins estén cayendo?
Sí. Las altcoins pueden superar a Bitcoin en términos relativos aunque ambas pierdan valor. Por ejemplo, una altcoin que cae un 5 % supera a Bitcoin si Bitcoin cae un 15 %.
¿El Índice de Temporada de Altcoins predice qué altcoin subirá?
No. El índice mide el rendimiento relativo general y no anticipa qué token concreto subirá. Cada activo requiere su propio análisis de liquidez, suministro, valoración y fundamentales del proyecto.