Trade
Basic
Futures
Futures
Hundreds of contracts settled in USDT or BTC
Options
HOT
Trade European-style vanilla options
Unified Account
Maximize your capital efficiency
Demo Trading
Futures Kickoff
Get prepared for your futures trading
Futures Events
Participate in events to win generous rewards
Demo Trading
Use virtual funds to experience risk-free trading
Earn
Launch
CandyDrop
Collect candies to earn airdrops
Launchpool
Quick staking, earn potential new tokens
HODLer Airdrop
Hold GT and get massive airdrops for free
Launchpad
Be early to the next big token project
Alpha Points
NEW
Trade on-chain assets and enjoy airdrop rewards!
Futures Points
NEW
Earn futures points and claim airdrop rewards
Investment
Simple Earn
Earn interests with idle tokens
Auto-Invest
Auto-invest on a regular basis
Dual Investment
Buy low and sell high to take profits from price fluctuations
Soft Staking
Earn rewards with flexible staking
Crypto Loan
0 Fees
Pledge one crypto to borrow another
Lending Center
One-stop lending hub
VIP Wealth Hub
Customized wealth management empowers your assets growth
Private Wealth Management
Customized asset management to grow your digital assets
Quant Fund
Top asset management team helps you profit without hassle
Staking
Stake cryptos to earn in PoS products
Smart Leverage
NEW
No forced liquidation before maturity, worry-free leveraged gains
GUSD Minting
Use USDT/USDC to mint GUSD for treasury-level yields
More
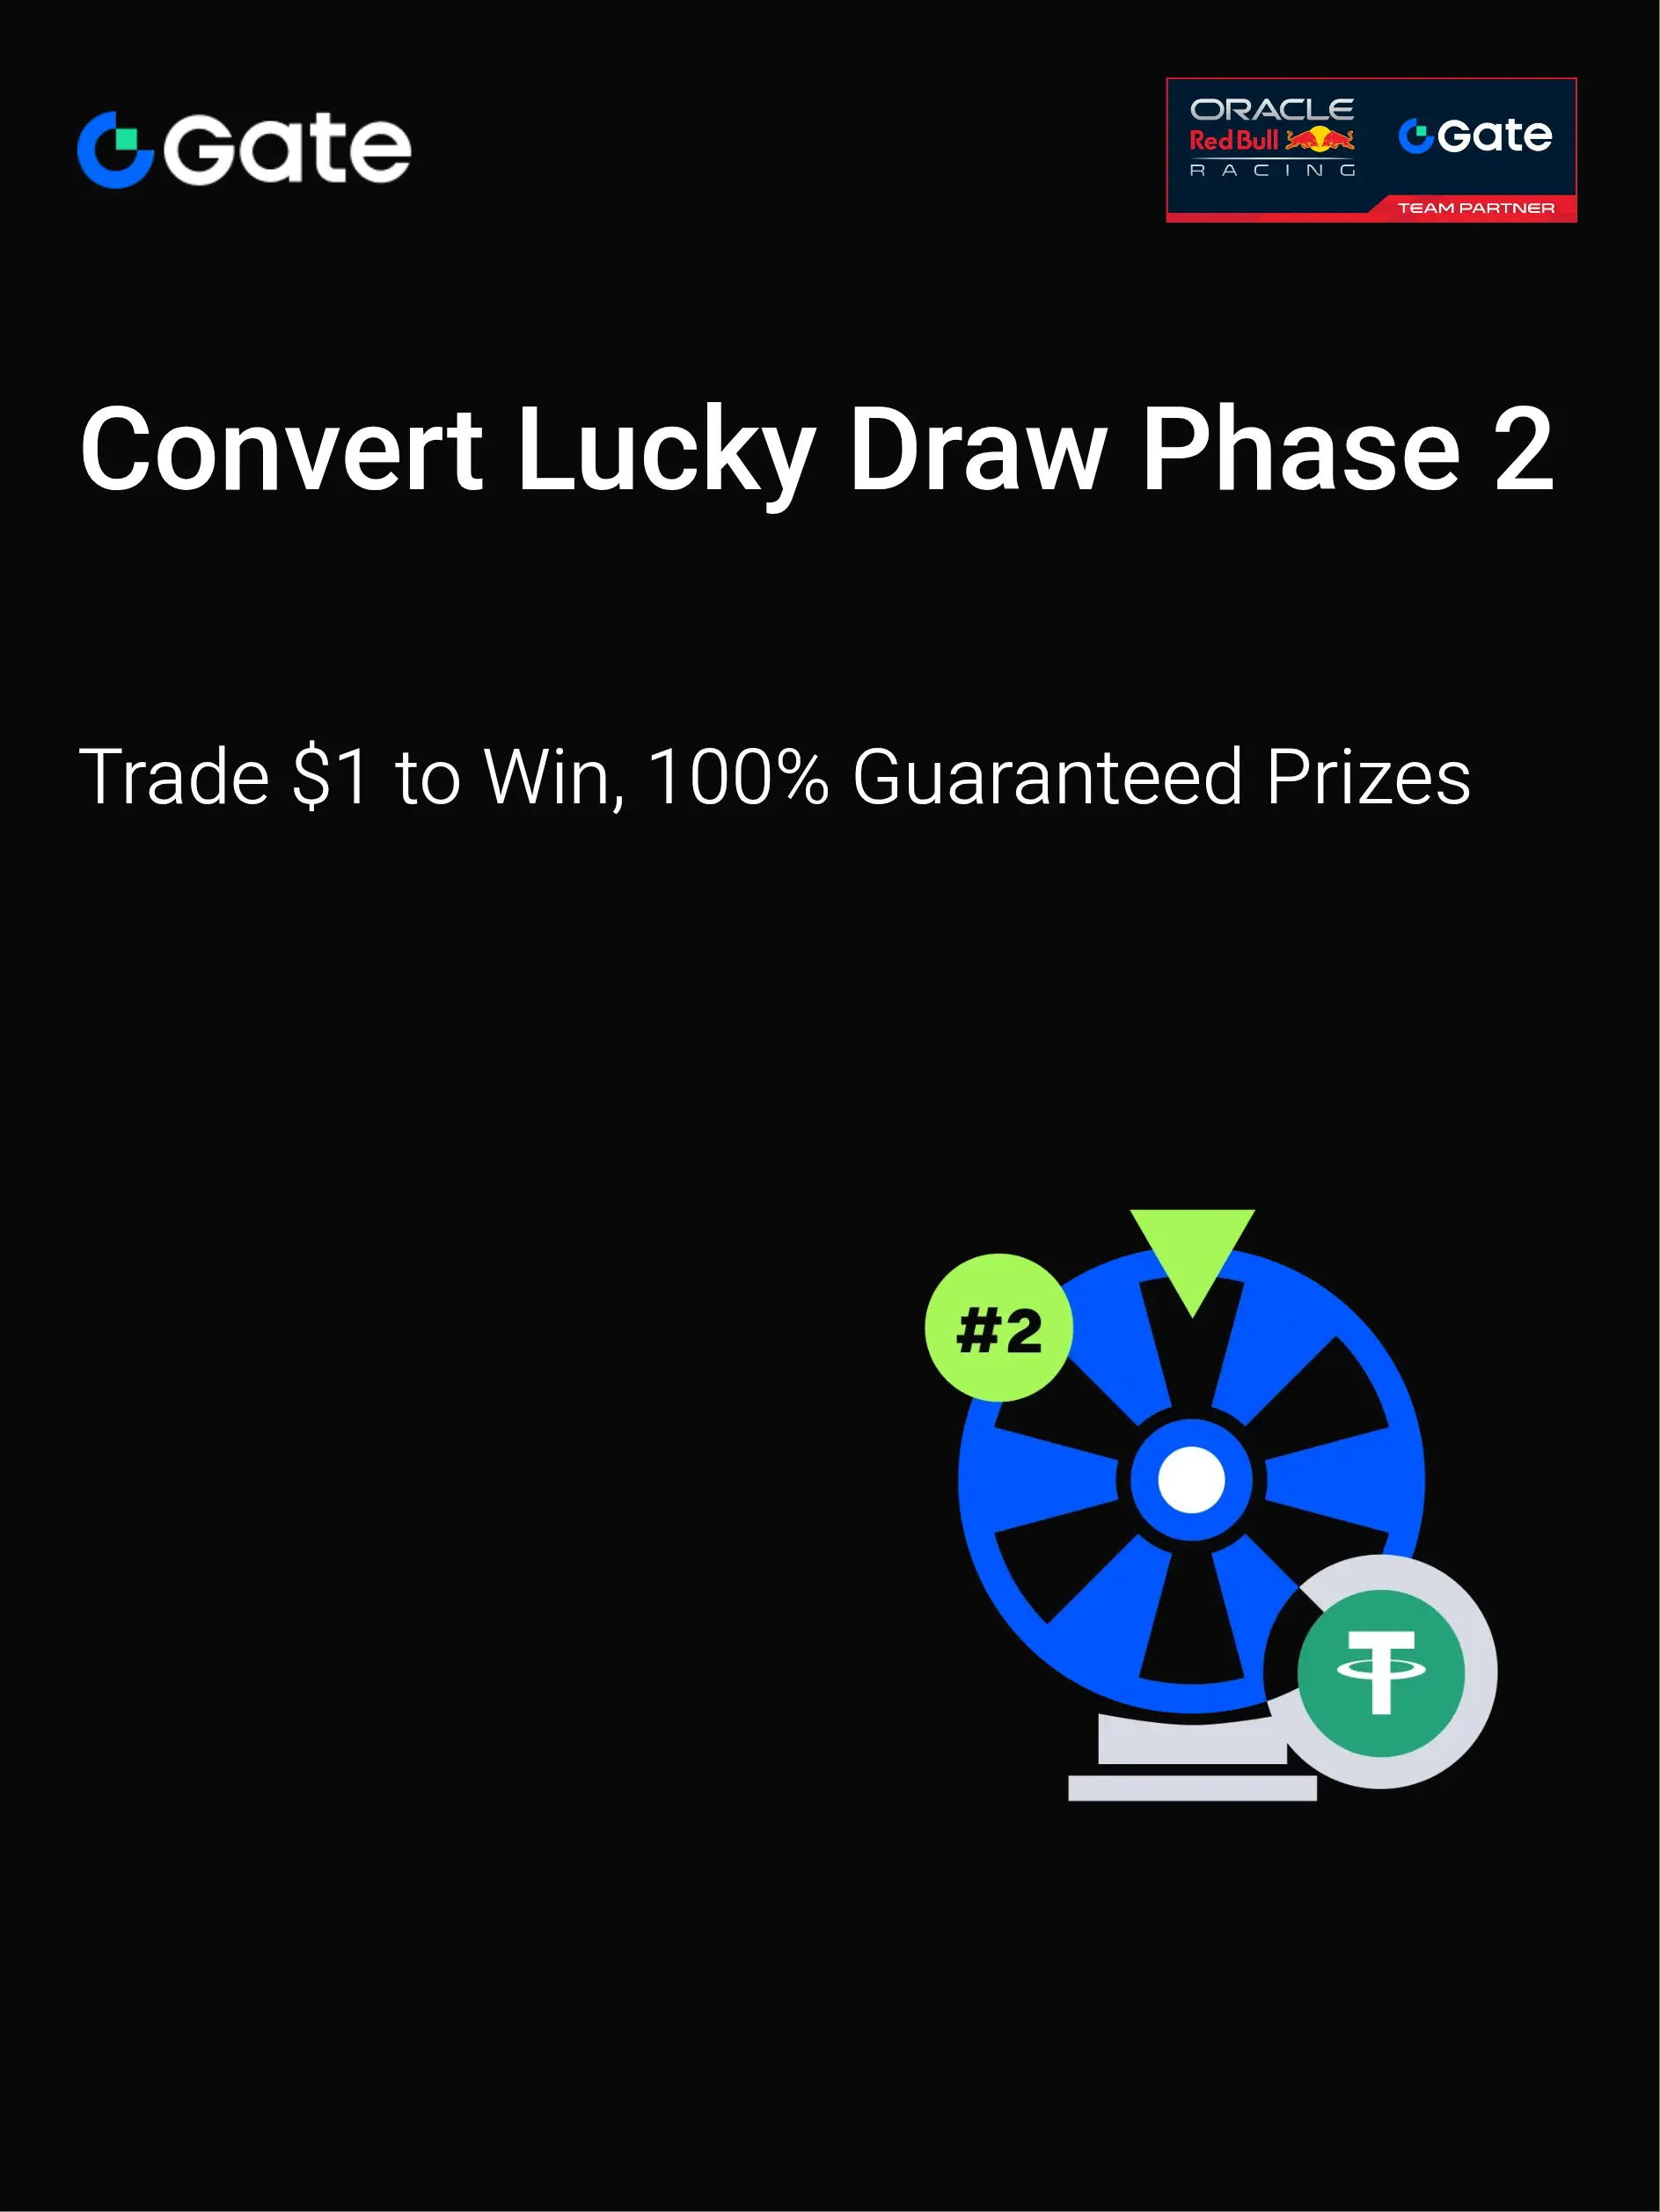
The Convert Lucky Draw event is officially live. Complete a trade of just $1 to enter the draw—every draw is a winner. You can start a convert trade with as little as $1 and enjoy a fast, zero-fee trading experience. Complete simple tasks to unlock exclusive rewards and start your Convert journey now. https://www.gate.com/campaigns/3850?ref_type=132
- Reward
- like
- Comment
- Repost
- Share
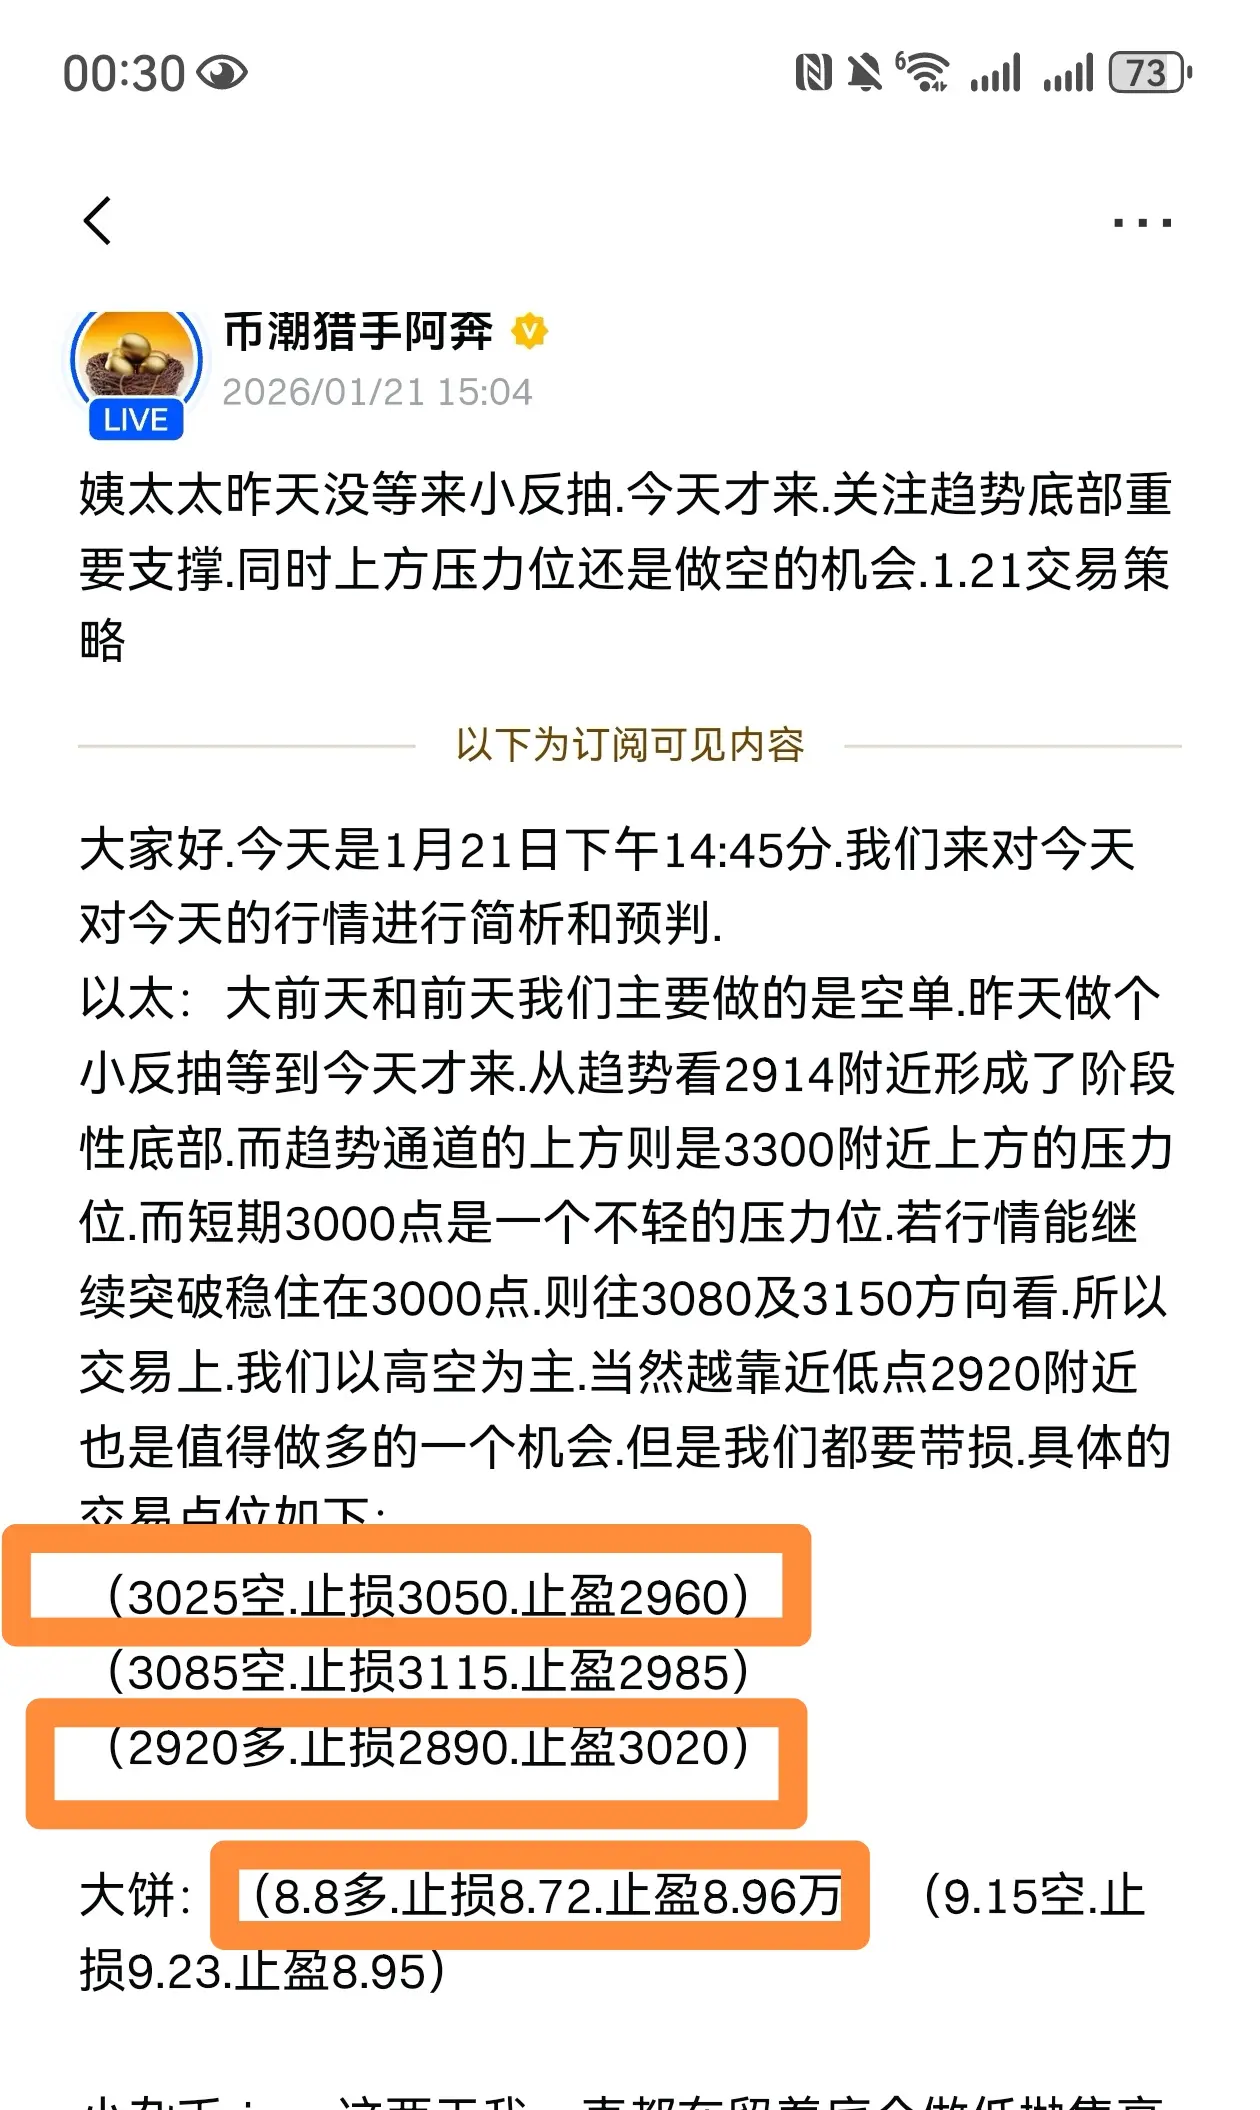
#晒出我的合约收益#
First order, plus two scam orders, high profit and loss ratio, rest after opening.
In this market, stability is more important than暴利, welcome everyone to follow the trades.
View OriginalFirst order, plus two scam orders, high profit and loss ratio, rest after opening.
In this market, stability is more important than暴利, welcome everyone to follow the trades.
- Reward
- like
- Comment
- Repost
- Share
🌞
🌞你仙人板板
Created By@gatefunuser_fc61
Listing Progress
0.06%
MC:
$3.41K
Create My Token
🌟Gate Live Bonus Task -Simple Earn OWL
193
- Reward
- like
- Comment
- Repost
- Share
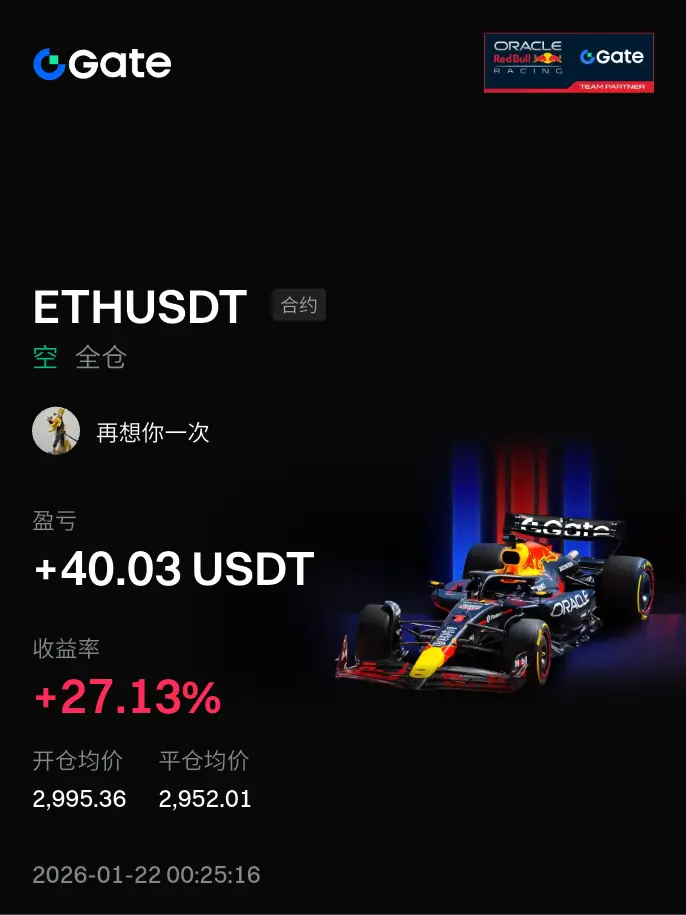
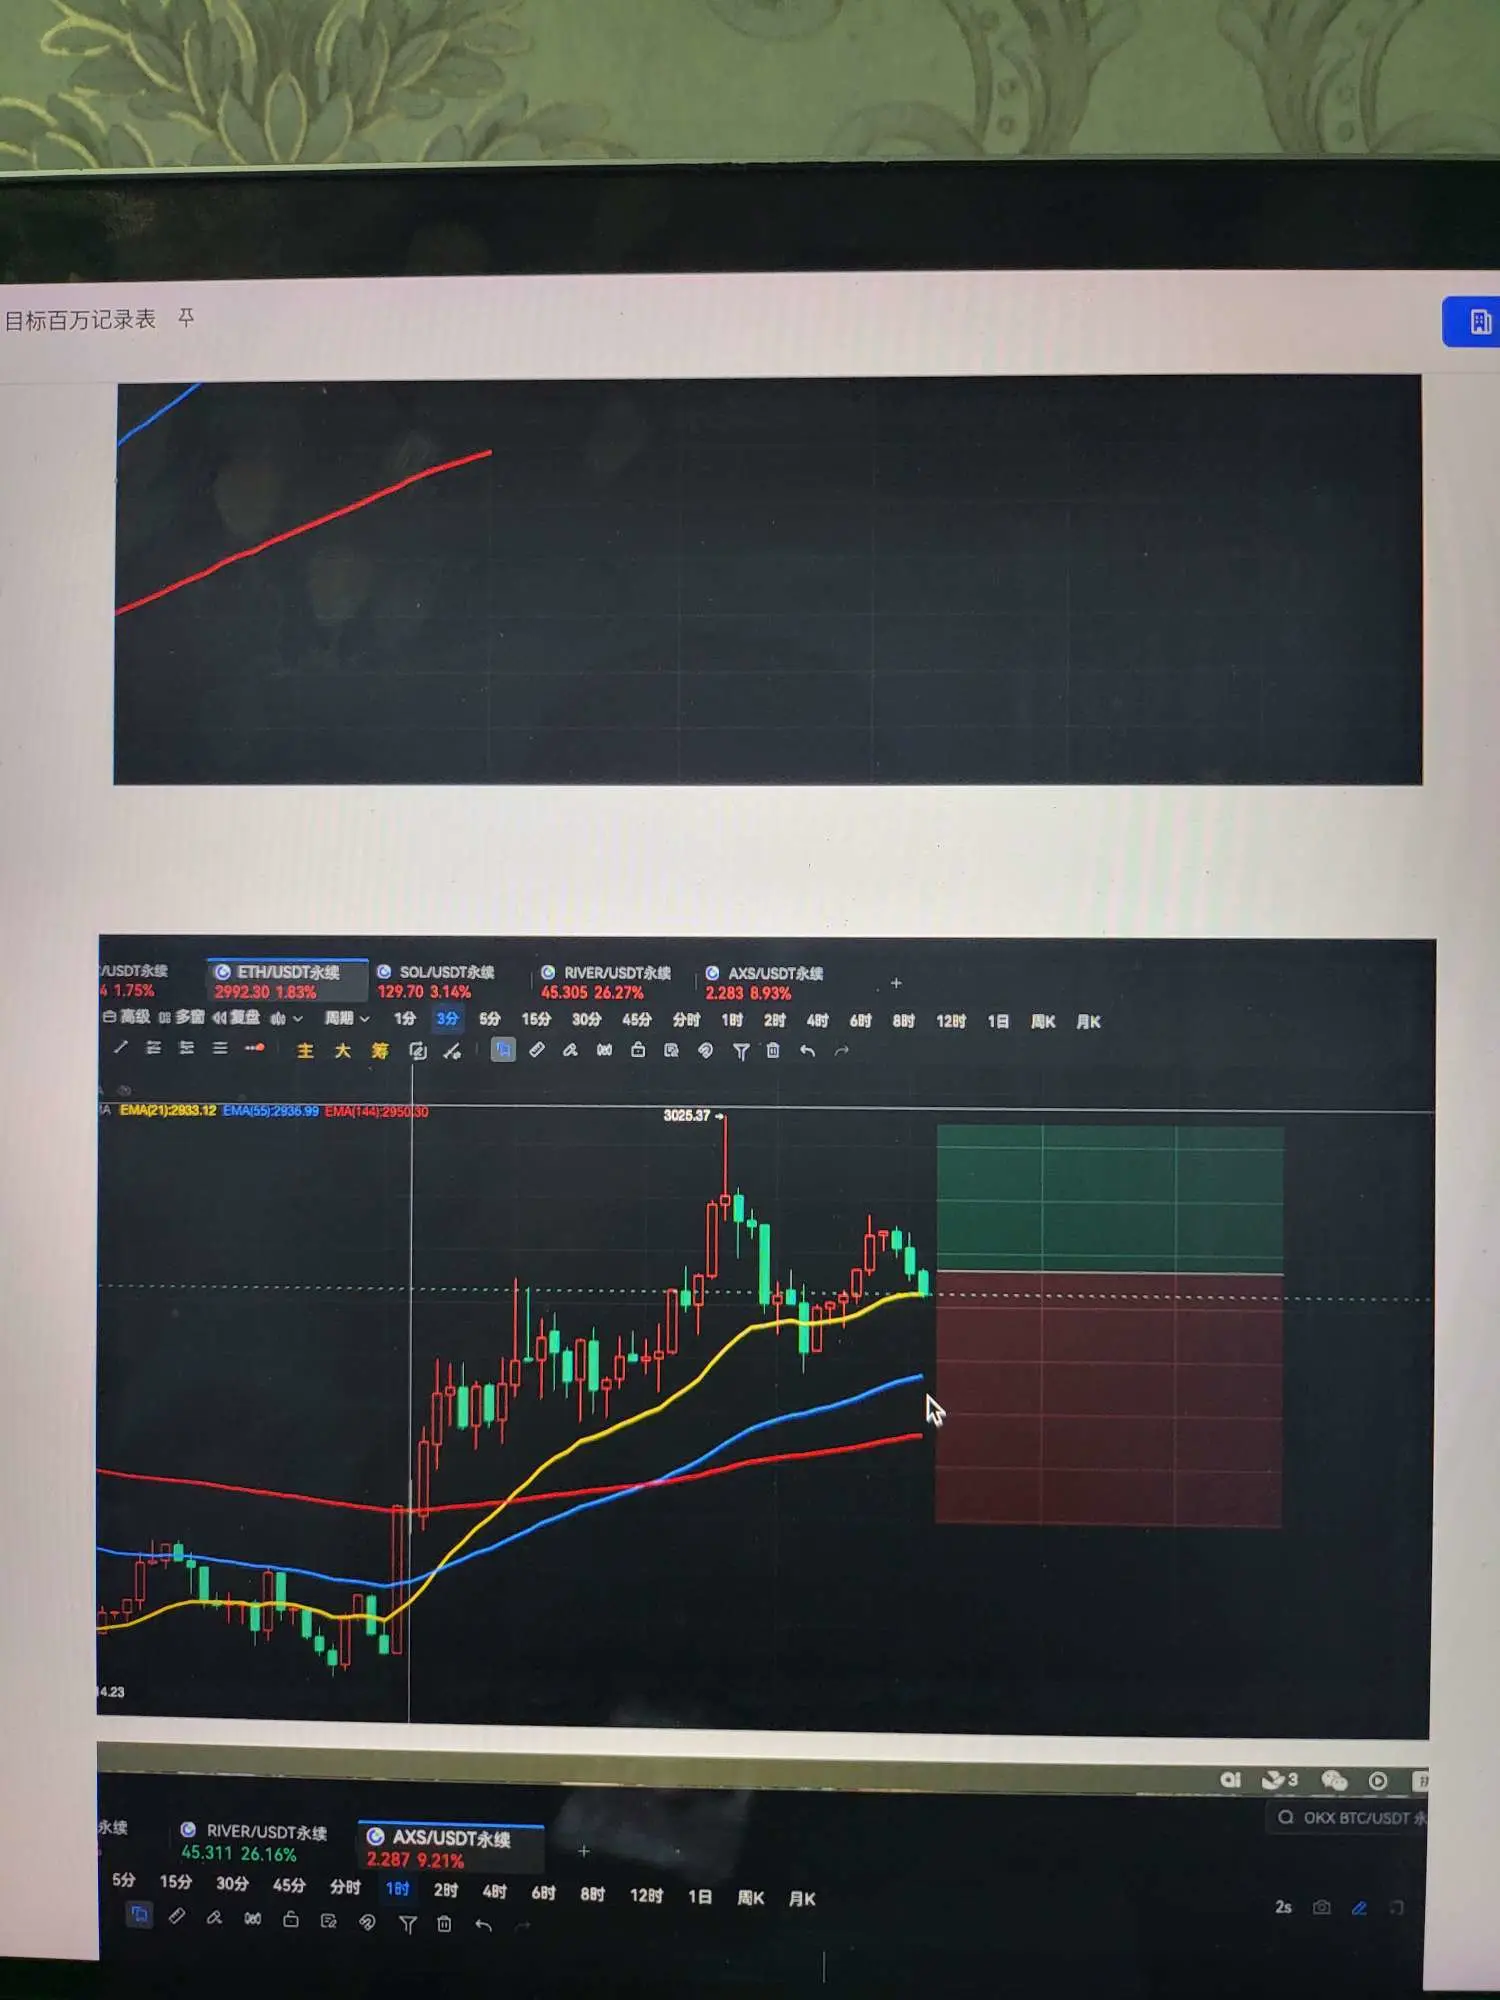
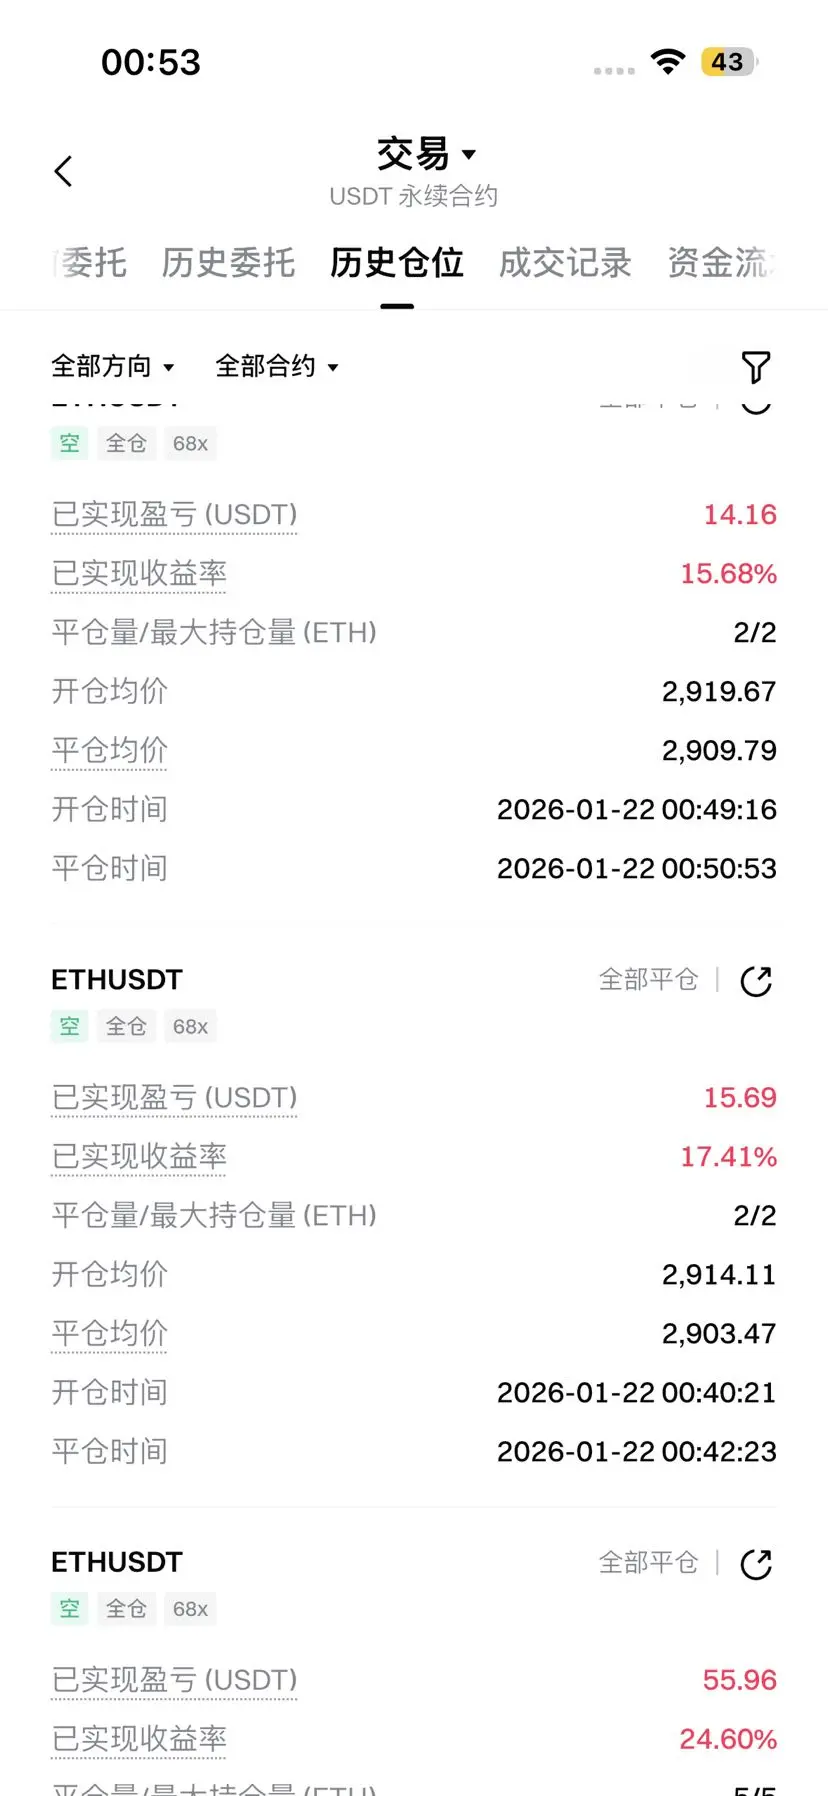
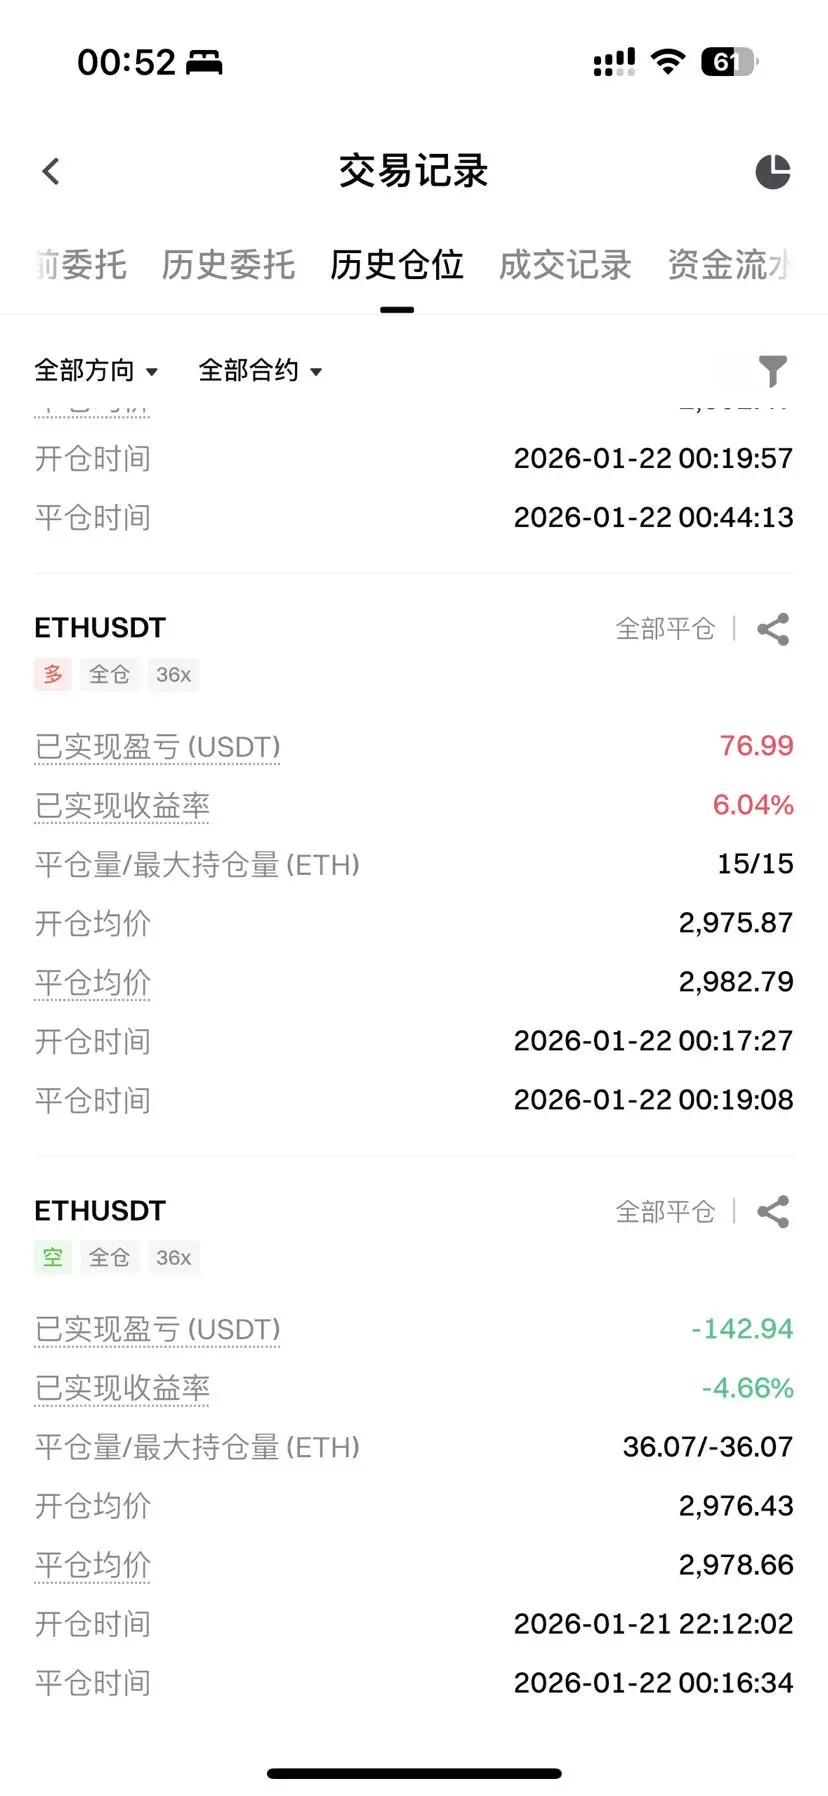
Ethereum long and short both achieve 165 points profit,
2920 long and 3020 short take profit for 100 points profit,
3025 short take profit at 2960 for 65 points,
Bitcoin 8.8 long take profit at 8.96 for 1500 points,
More new entry points will be shared live during the stream.
2920 long and 3020 short take profit for 100 points profit,
3025 short take profit at 2960 for 65 points,
Bitcoin 8.8 long take profit at 8.96 for 1500 points,
More new entry points will be shared live during the stream.
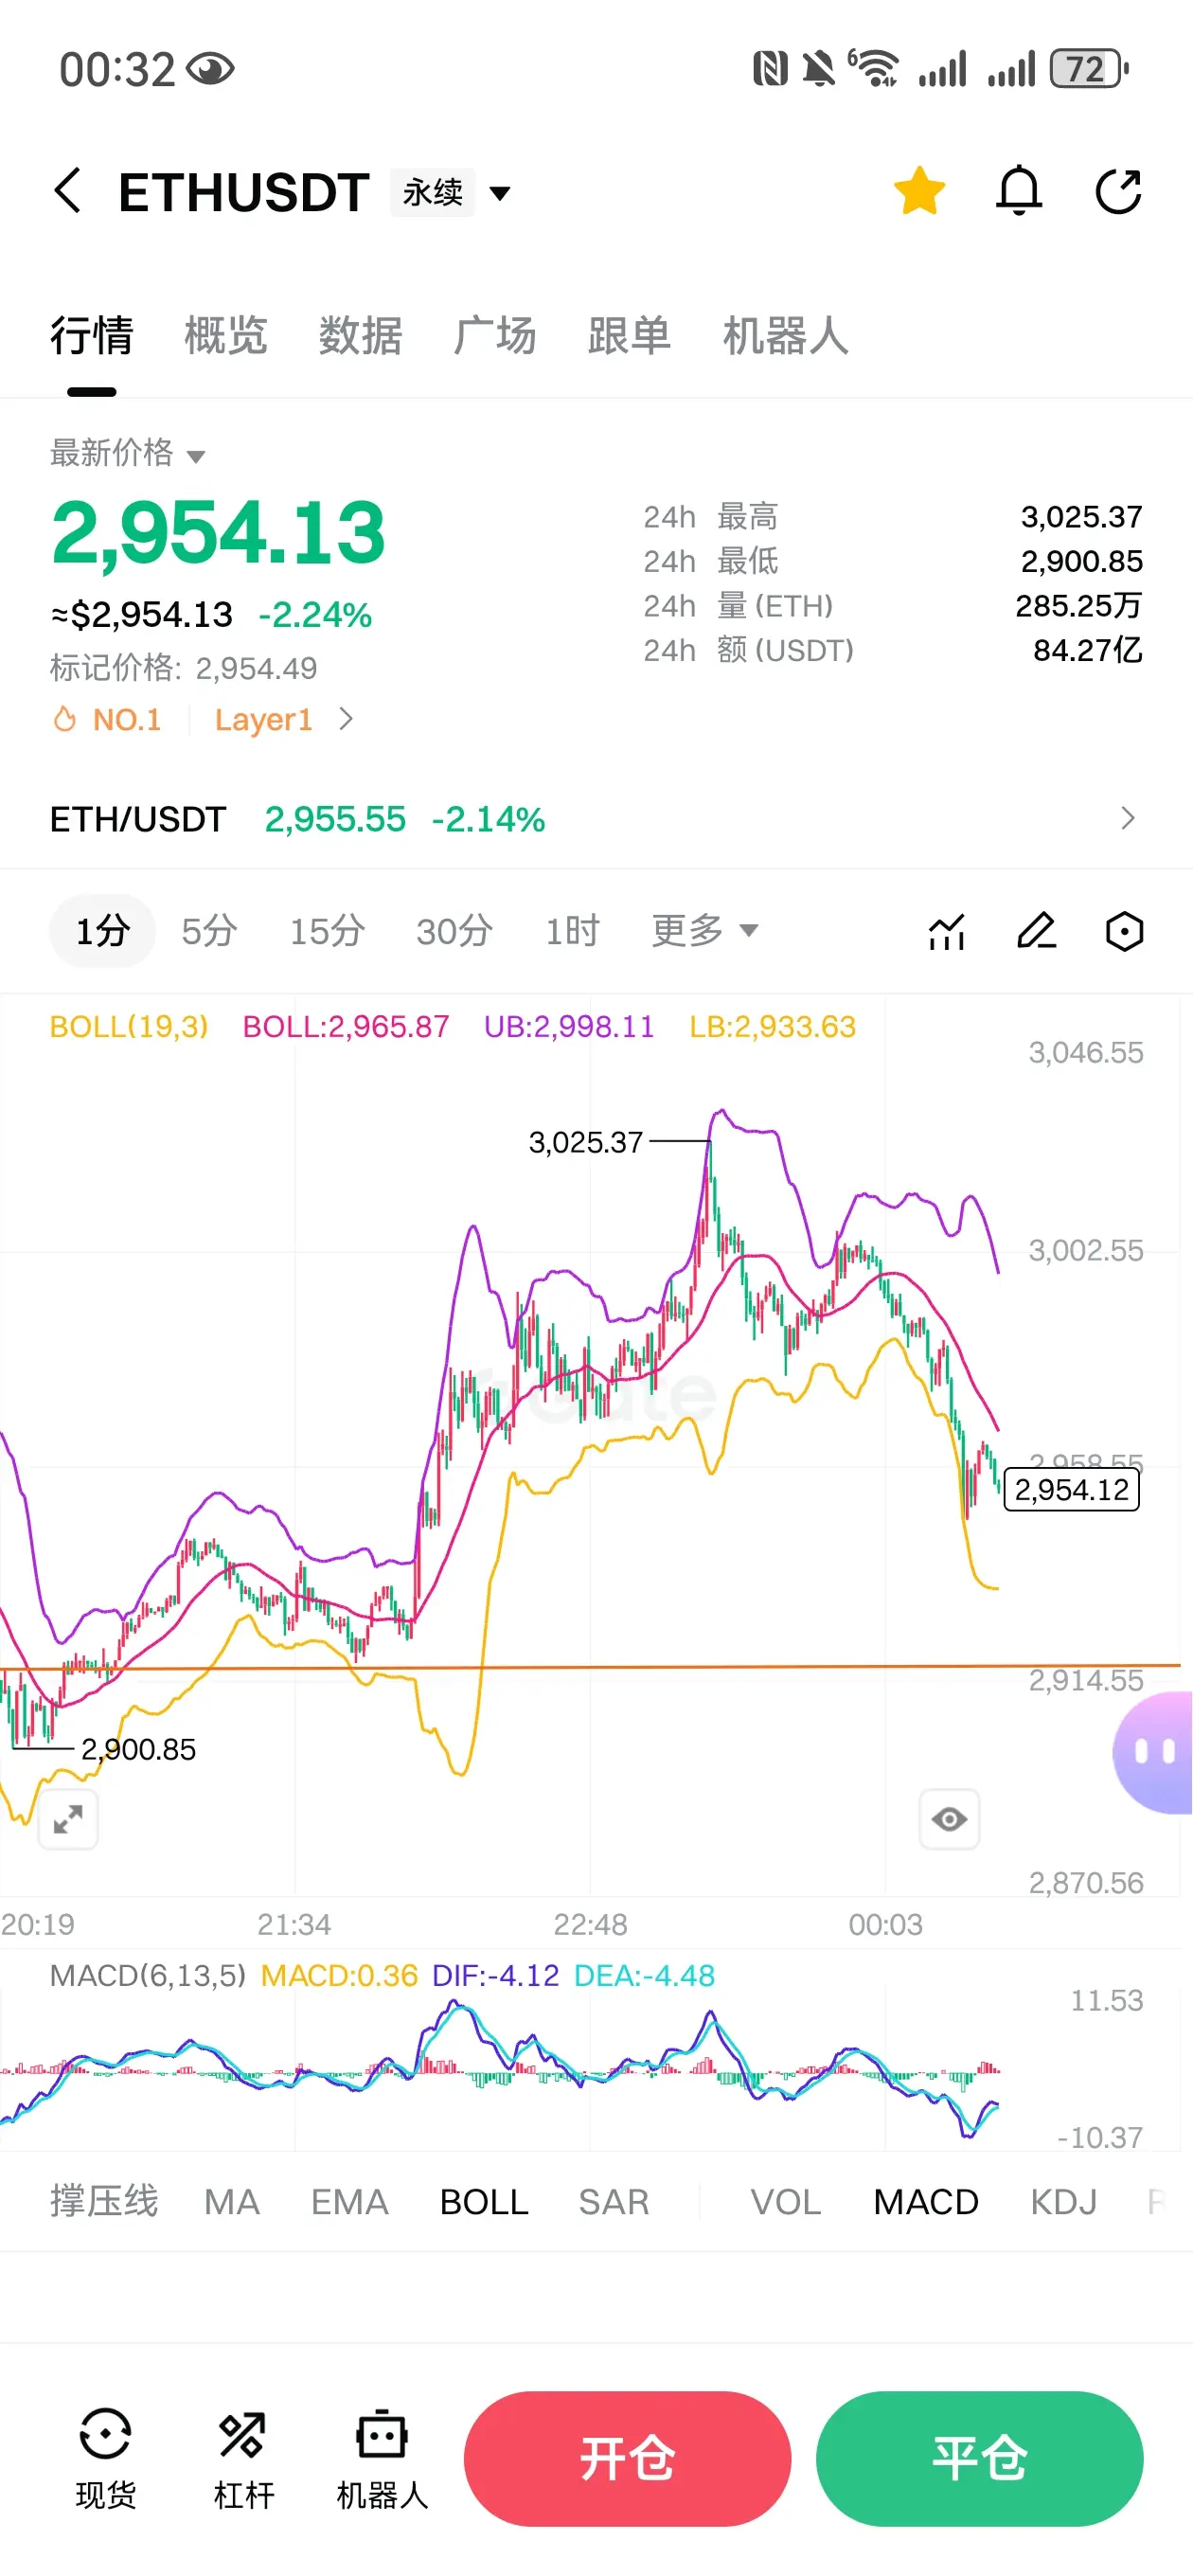
ETH-3.34%
- Reward
- like
- Comment
- Repost
- Share

- Reward
- 3
- 2
- Repost
- Share
花羊 :
:
Afraid to hold a large position?View More
Exclusive Referral Week Phase 9: Earn Up to $300 Cash per Referrer https://www.gate.com/campaigns/3892?ref=XgRFBg1c&ref_type=132&utm_cmp=vrFaFPJi
- Reward
- like
- Comment
- Repost
- Share
#WeekendMarketAnalysis #BTC
This weekend is over and we really saw some easing of pressure from sellers, but over the last two days the sellers have been pushing hard and we all saw the results. On Tuesday my short order worked successfully and I'm happy. Regarding favorite assets, my favorite coin is Dogecoin and BERA.
This weekend is over and we really saw some easing of pressure from sellers, but over the last two days the sellers have been pushing hard and we all saw the results. On Tuesday my short order worked successfully and I'm happy. Regarding favorite assets, my favorite coin is Dogecoin and BERA.
- Reward
- 4
- 2
- Repost
- Share
AnnaCryptoWriter:
Vibe at 1000x 🤑View More
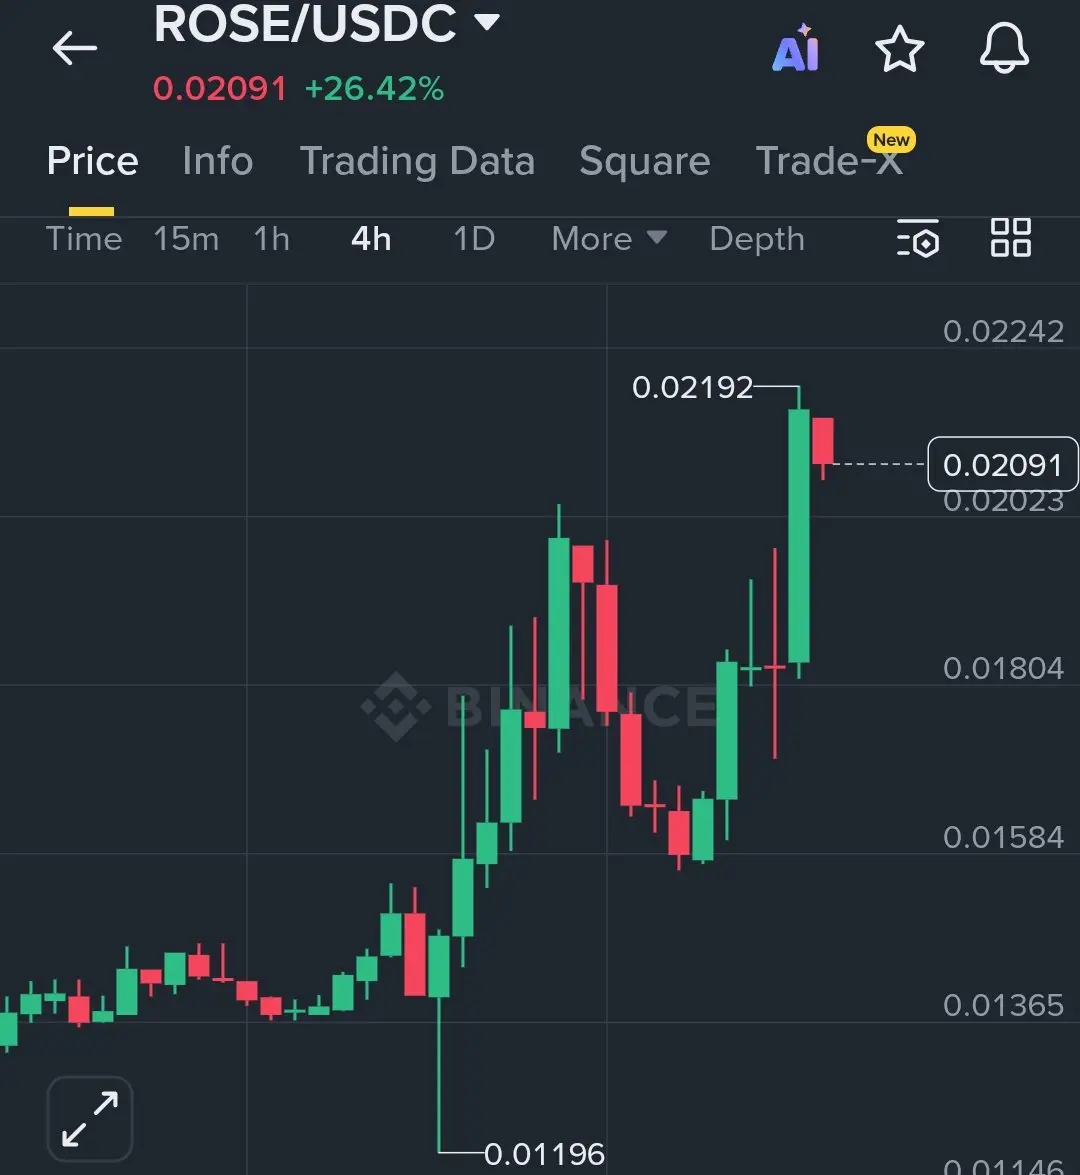
$ROSE is the only privacy coin that i am buying.
- Reward
- like
- Comment
- Repost
- Share
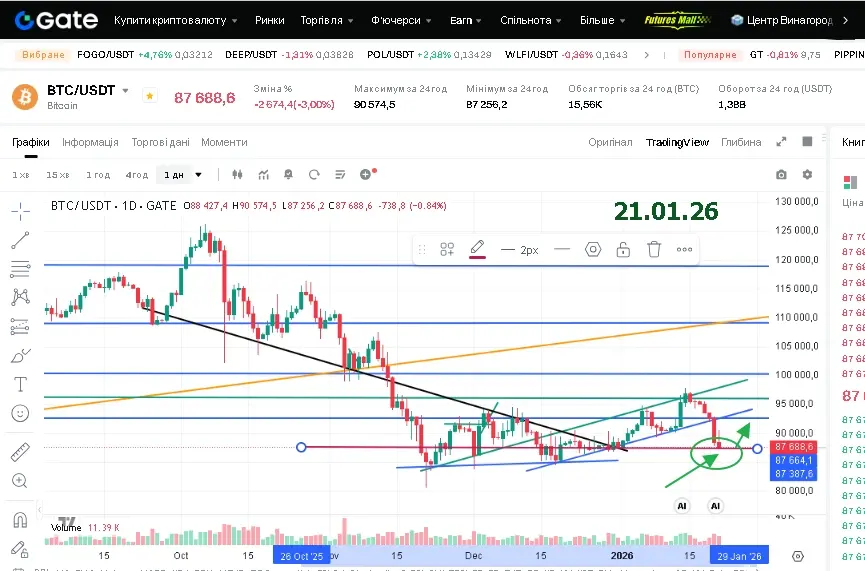
Crypto Market Insight: Strategic Volatility as Bitcoin Tests $90,000 Support (January 21, 2026)
The cryptocurrency market is experiencing one of its most volatile and strategic periods in recent years. As of January 21, 2026, a confluence of macroeconomic decisions and geopolitical tensions is directly shaping the trajectory of digital assets. Here are the verified, critical developments every investor needs to know:
Market Overview: Bitcoin Hovering at the $90,000 Threshold
The crypto market is facing significant volatility today. The total market capitalization has decreased by 2.2% over

- Reward
- 2
- 1
- Repost
- Share
楚老魔 :
:
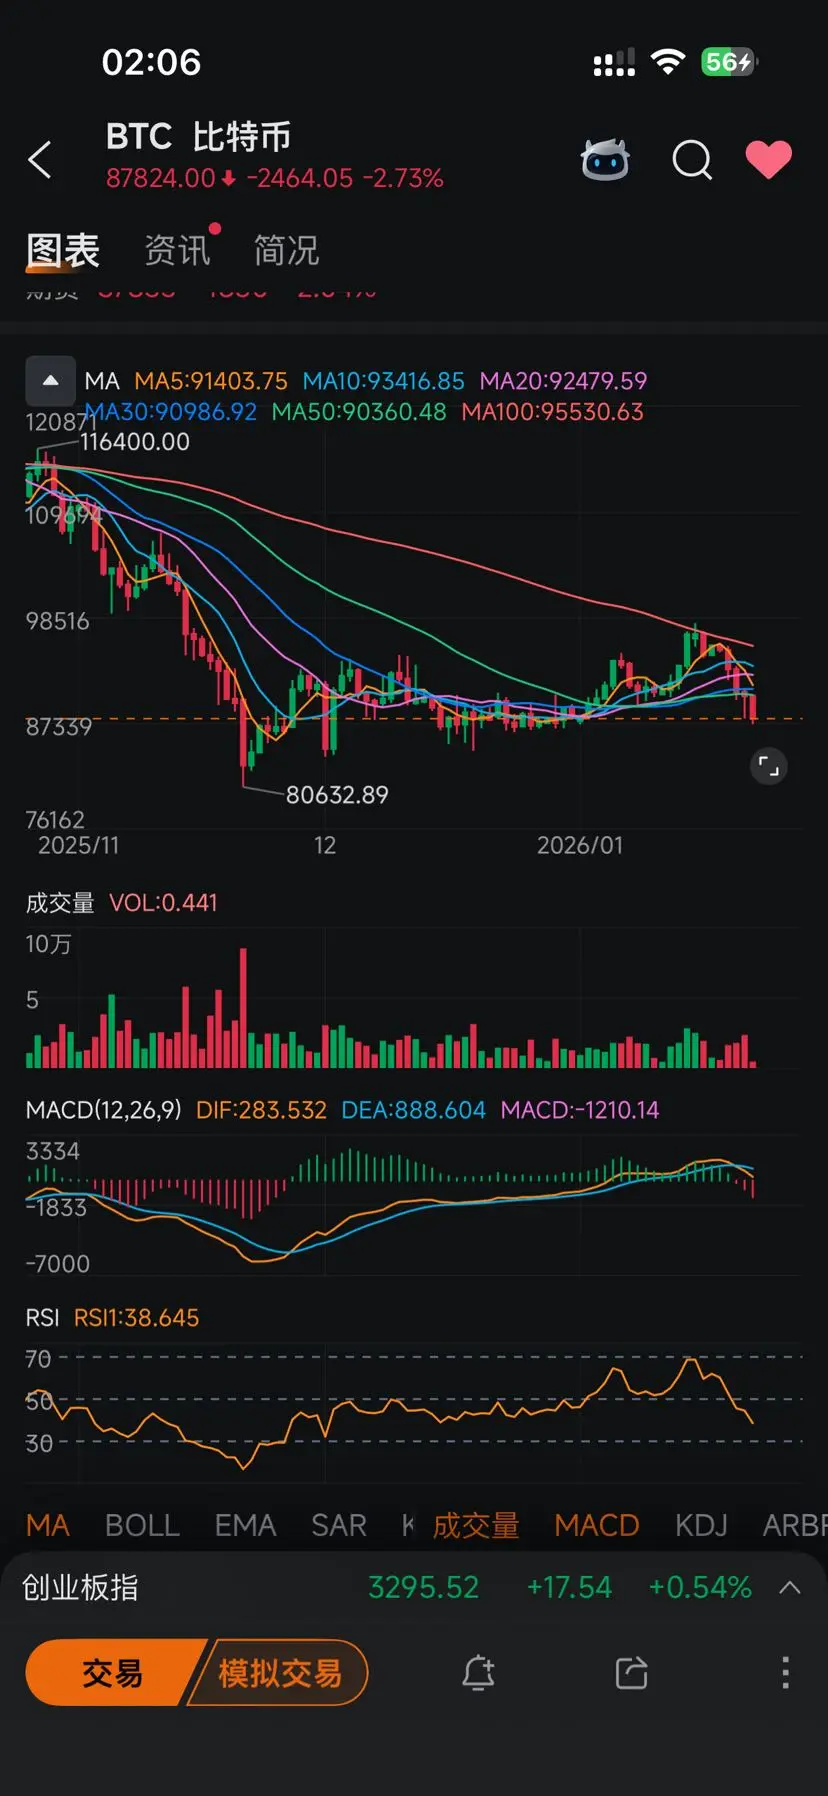
2026 Go Go Go 👊【BTC Daily Chart Structure In-Depth Analysis | Price Breaks Key Moving Averages, Facing Direction Confirmation】#Gate每10分钟送1克黄金
Core Structural Shift
BTC daily chart shows a key transition: after a deep correction, the price has returned to the critical support zone formed by the long-term moving averages MA20 (~92,480) and MA50. The current price is $87,824. Although it has broken below MA20, it is close to the long-term upward trendline support and the previous platform at $87,339. This marks a shift from the “strong operation above moving averages” phase to the “testing long-term trend and
BTC-2.19%


- Reward
- like
- Comment
- Repost
- Share
嫣然天使
嫣然天使
Created By@Goodbyeto
Listing Progress
0.26%
MC:
$3.44K
Create My Token
New Year Market.BTC and SOL LIVE Analysis Smart Trade Setup
145
- Reward
- like
- Comment
- Repost
- Share
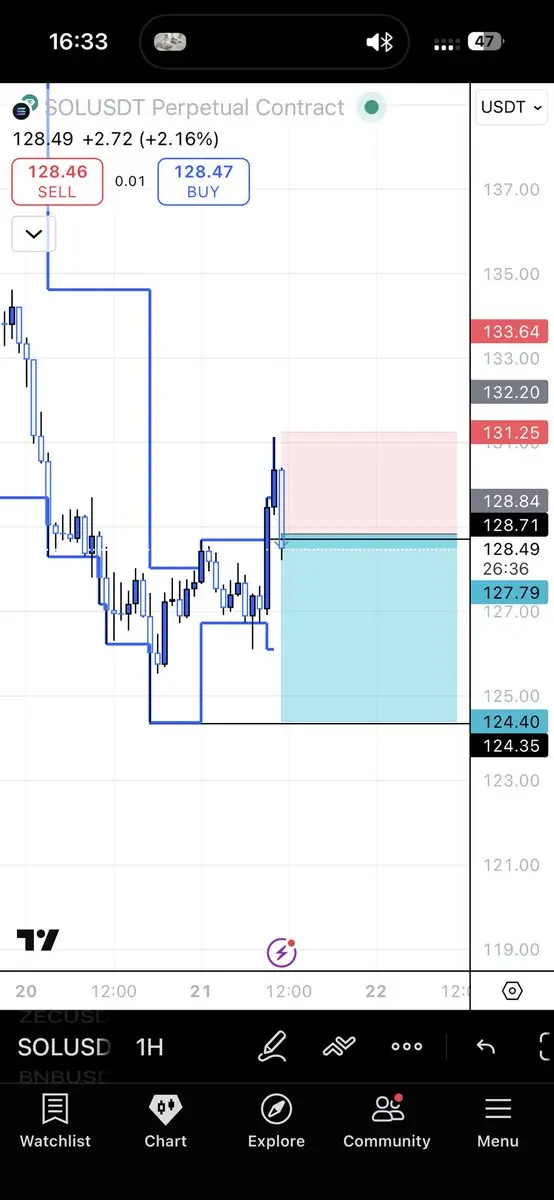
【SOL Daily Chart Structure Projection | The Directional Battle After Moving Averages Converge】
The market is experiencing a rare period of calm. On the SOL daily chart, the price is compressed within a narrow range, and all key moving averages from MA5 to MA50 are nearly intertwined, winding around the narrow zone of $132-$138. This highly converged state of moving averages is an intuitive reflection of the long-term market forces of bulls and bears reaching a delicate balance, also indicating that once this balance is broken, a significant amount of energy may be released.
Currently, the pric
SOL-0.19%


- Reward
- like
- Comment
- Repost
- Share
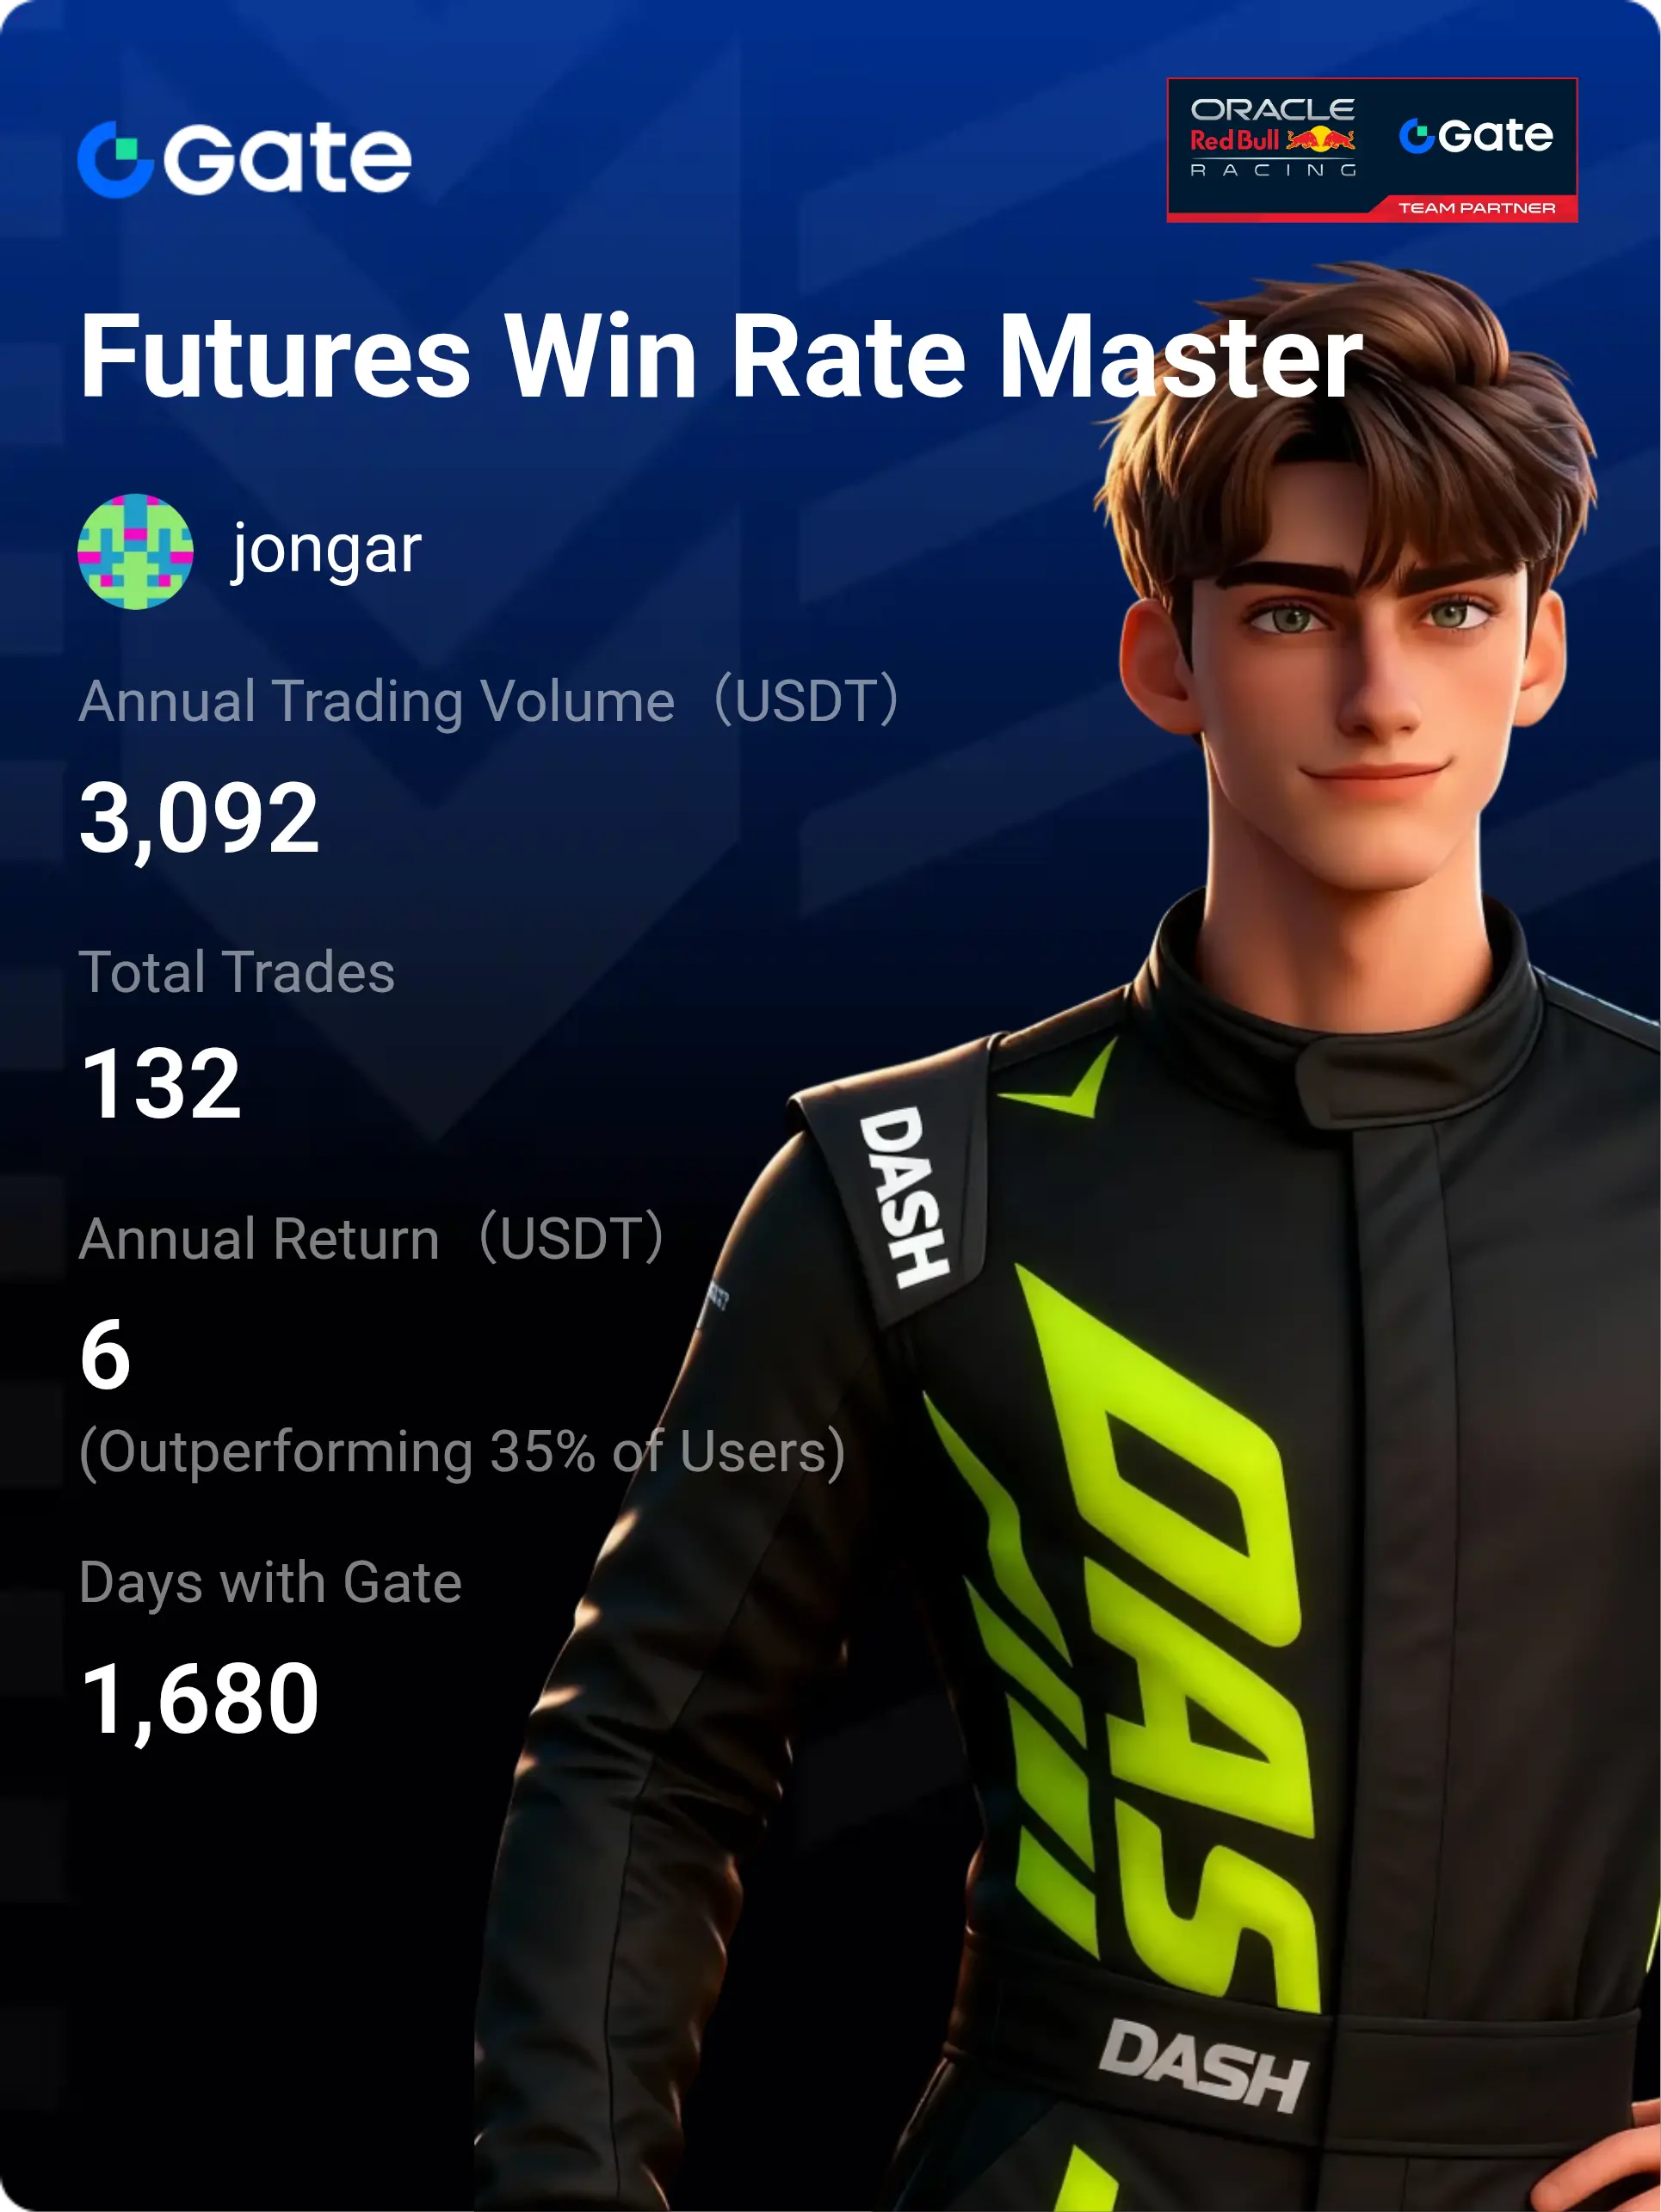
My Gate 2025 Year-End Summary is here! See how I performed this year.
Click the link to view your exclusive #2025GateYearEndSummary and claim a 20 USDT Position Voucher. https://www.gate.com/competition/your-year-in-review-2025?ref=UlhDXVtX&ref_type=126&shareUid=UllCVl1ZBAO0O0OO0O0O
Click the link to view your exclusive #2025GateYearEndSummary and claim a 20 USDT Position Voucher. https://www.gate.com/competition/your-year-in-review-2025?ref=UlhDXVtX&ref_type=126&shareUid=UllCVl1ZBAO0O0OO0O0O
- Reward
- like
- Comment
- Repost
- Share
#GrowthPointsDrawRound16
Don't forget about this event
You might get lucky.. and other things..
Maybe you'll make a profit.. hurry up and join, friends
View OriginalDon't forget about this event
You might get lucky.. and other things..
Maybe you'll make a profit.. hurry up and join, friends


- Reward
- like
- Comment
- Repost
- Share
15 minutes to heaven or hell, the contract is really a double-edged sword that kills both longs and shorts.
View Original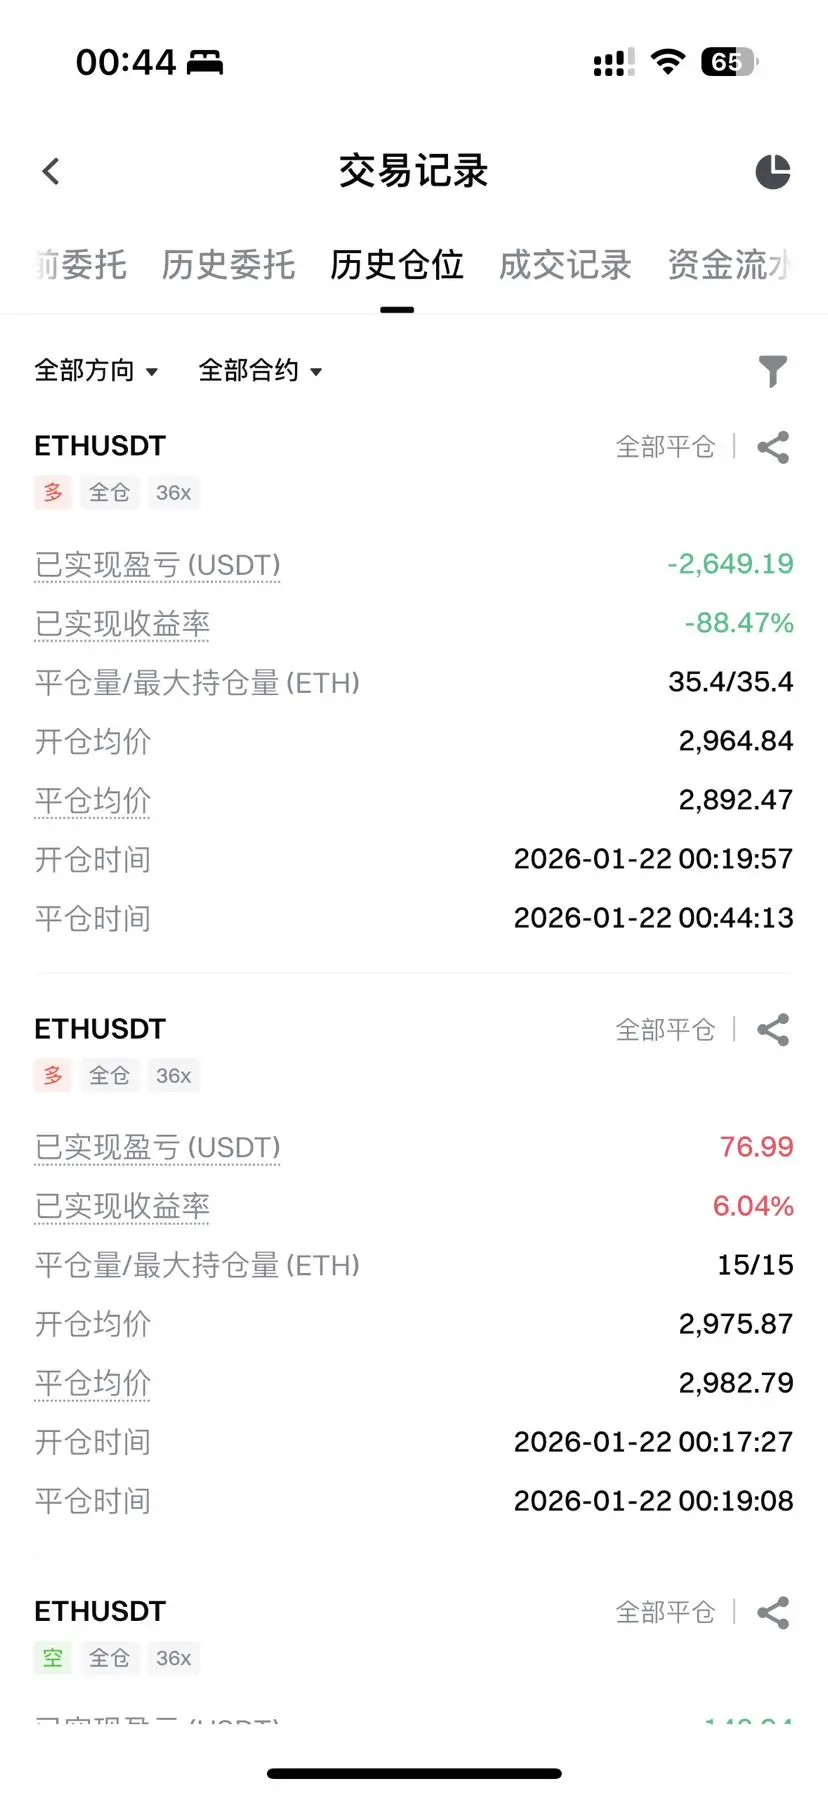
- Reward
- like
- 1
- Repost
- Share
GateUser-e6ea4899 :
:
Got stuck for a few hours before breaking free. To make that 70 bucks, I painfully lost 2700 bucks.Disappearing from the internet in the next 10 days
View Original
- Reward
- like
- Comment
- Repost
- Share
#比特币价格走势
In the daily Bitcoin chart, during a decline, the Bitcoin bullish accumulation zone is between 87,000 and 84,000. To completely wipe out the bulls, it must break below 80,000 USD, forming a perfect daily trend. Afterwards, a strong rebound could be initiated, and Ethereum is also expected to reach 2,500.
#现货黄金再创新高 #欧美关税风波冲击市场 #
View OriginalIn the daily Bitcoin chart, during a decline, the Bitcoin bullish accumulation zone is between 87,000 and 84,000. To completely wipe out the bulls, it must break below 80,000 USD, forming a perfect daily trend. Afterwards, a strong rebound could be initiated, and Ethereum is also expected to reach 2,500.
#现货黄金再创新高 #欧美关税风波冲击市场 #

- Reward
- like
- Comment
- Repost
- Share
Load More
Join 40M users in our growing community
⚡️ Join 40M users in the crypto craze discussion
💬 Engage with your favorite top creators
👍 See what interests you
Trending Topics
View More35.59K Popularity
18.81K Popularity
6.07K Popularity
52.88K Popularity
343.22K Popularity
News
View MoreData: ETH breaks through $2900
4 m
"BTC OG Insider Whale" unrealized losses expand to $65.9 million
13 m
Farcaster has been acquired by the ecosystem's core client Neynar, and the two co-founders will gradually step back to focus on new projects.
27 m
Tokenized Real-World Assets Reach $21B in TVL
35 m
Data: 107.82 BTC transferred out from Cumberland DRW, worth approximately $7.14 million
46 m
Pin
Strike Gold by Sharing Your TradFi Orders and Pictures!
Post on Gate Square and split $10,000 in rewards!
The TradFi Gold Lucky Bag is now live—1g of real gold every 10 minutes. Trade nonstop, win nonstop!
👉 https://www.gate.com/announcements/article/49357
🎁 50 lucky winners × $200 Position Vouchers ($10 × 20 leverage)
How to Join:
1️⃣ Post your order on Square with #GateTradFi1gGoldGiveaway, including:
A trade or draw screenshot
A brief experience sharing
2️⃣ Or create a related image (AI creation allowed) with a short promo line, such as:
Get gold on Gate App — 1g every 10 minutes!
⏰ Jan 2Gate Square New & Returning Creator Rewards are ongoing!
Your ideas may be more valuable than you think!
Make your first post or come back post to share a $20,000 monthly prize pool!
Post with #MyFirstPostOnSquare to receive a $50 Position Voucher each
Monthly Top Posters and Top Engagers will each earn an extra $50 reward
Your crypto insights could inspire many—start creating today!
👉 https://www.gate.com/postGate Square “Creator Certification Incentive Program” — Recruiting Outstanding Creators!
Join now, share quality content, and compete for over $10,000 in monthly rewards.
How to Apply:
1️⃣ Open the App → Tap [Square] at the bottom → Click your [avatar] in the top right.
2️⃣ Tap [Get Certified], submit your application, and wait for approval.
Apply Now: https://www.gate.com/questionnaire/7159
Token rewards, exclusive Gate merch, and traffic exposure await you!
Details: https://www.gate.com/announcements/article/47889