Share crypto content and earn up to 60% commissions through content mining.
placeholder
gatefun
That breakdown during the session already made the direction clear. $DOT had been grinding near the top repeatedly; on the surface it looks like it’s holding up, but in reality the buy-side was getting thinner and thinner. The moment the resistance level gets touched, it retreats. A lot of people are still waiting for it to continue bouncing back; I, however, think the shorting opportunity is clearer.
Earlier, I already paid attention to this level. The real key isn’t how much it drops, but that every time it rebounds, it can’t regain initiative. When DOT was around 1.223, I chose to go long—
DOT-0.12%
BTC-0.05%
ETH1.99%
View Original
post-image
  • Reward
  • Comment
  • Repost
  • Share
14:31 This $AKE over the past 24 hours surged from 0.0002 to 0.0007, and trading volume blasted up to $900 million—my phone screen basically blew up, but look at it now—half the gains have been eaten up, and the high-level turnover rate has started stacking volume.
Scenario run-through: this group is likely using the 0.0002 chips to pump up and distribute. If tonight the pullback to 0.0005 doesn’t hold, the next tier comes in and catches the knife at 0.0003. For short-term traders, don’t get greedy—the top at 0.0009 is basically this round’s ceiling. Anyone who dares to chase in will probably
AKE271.37%
View Original
post-image
post-image
post-image
  • Reward
  • Comment
  • Repost
  • Share
This move is really a bit ridiculous! 📉🔥 In the last look before bed, it was still pretending to be strong, but today it directly stopped pretending. $VET The short from 0.006192 to 0.00485—profit hit +537.4%. That “meat” you get to eat is really satisfying. 🎯💰 A few days ago, the thing I was watching before bed was the overhead resistance. It got pushed up without volume, and the follow-through was also weak. The fake long setup kept getting more intense, so back then I warned: go long, don’t rush in at a high level with your emotions—👀 some money isn’t made by impulsiveness. Good spots
VET0.70%
BTC-0.05%
ETH1.99%
View Original
post-image
  • Reward
  • Comment
  • Repost
  • Share
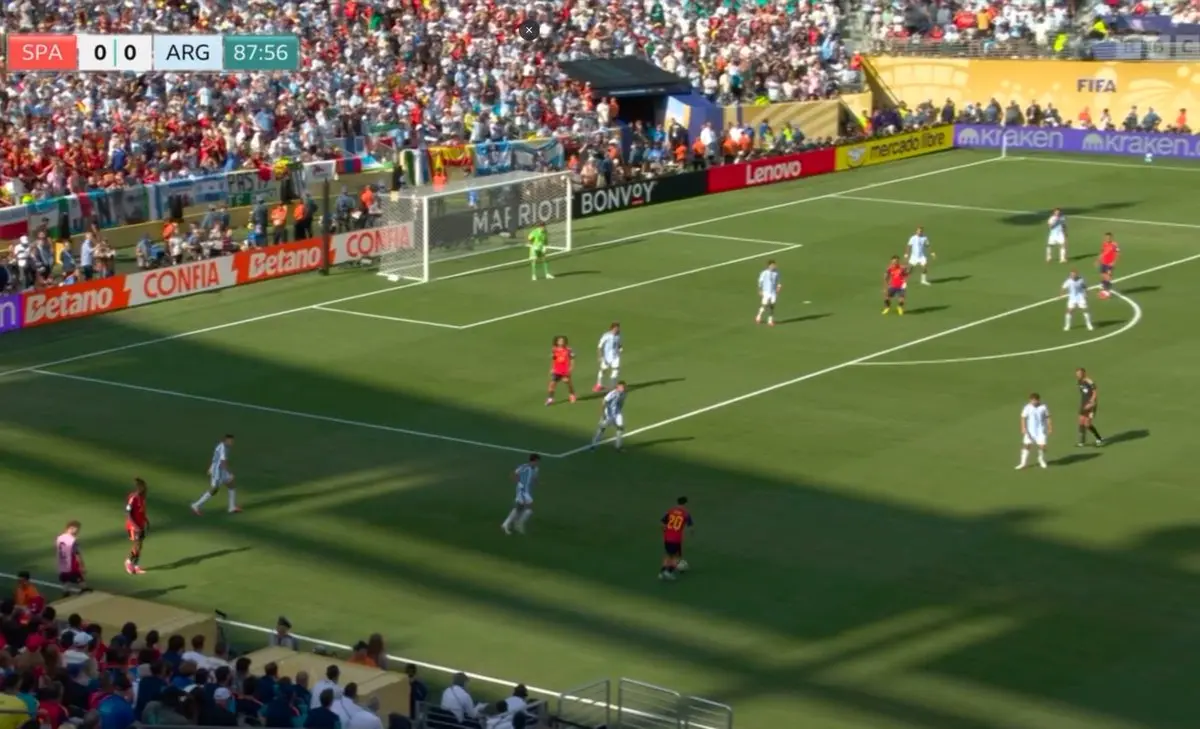
Next match you ronaldo fans should support Spain 🇪🇸 please
So Messi can win this again
post-image
  • Reward
  • Comment
  • Repost
  • Share
#ETHUSDT UPDATE 🚀
Ethereum is trading around $1,920. We called the move at $1,550, and ETH has delivered a 24% gain so far. The bullish pattern remains valid, with more upside possible if momentum continues. Stay tuned for the next update! 📈
ETH1.96%
post-image
  • Reward
  • Comment
  • Repost
  • Share
This World Cup betting record:
1. In the group stage, I bet 2000U on France, Spain, Argentina, and England to win the championship. Back then I figured the odds of these four teams not winning the title shouldn’t be that high, with odds around 1.8. By the time it reached the semifinals, it was basically locked in. I actually think this one was relatively solid. In essence, I benefited from what happens early on—weak teams can end up exceeding their real win probability, because a lot of “degenerate bettors” get delusional about playing small for big, or each team has its own fan base.
2. I tho
View Original
post-image
  • Reward
  • Comment
  • Repost
  • Share
It looks like just a normal pullback, but the intraday details are actually quite clear—each rebound has less and less strength, and every time the price pushes up, it gets pushed back down.

My judgment isn’t based on a single candle line; instead, I look to see whether $SOXL continues to hold at key levels. This time, it started recording from around 226.10. To the current price of 163.24, the feedback the chart gives is pretty straightforward, and the characteristics of continued weakness are becoming more and more obvious.

Return of +547.5%—this one is more the result of patience. In a
SOXL-8.53%
BTC-0.05%
ETH1.99%
View Original
post-image
  • Reward
  • Comment
  • Repost
  • Share
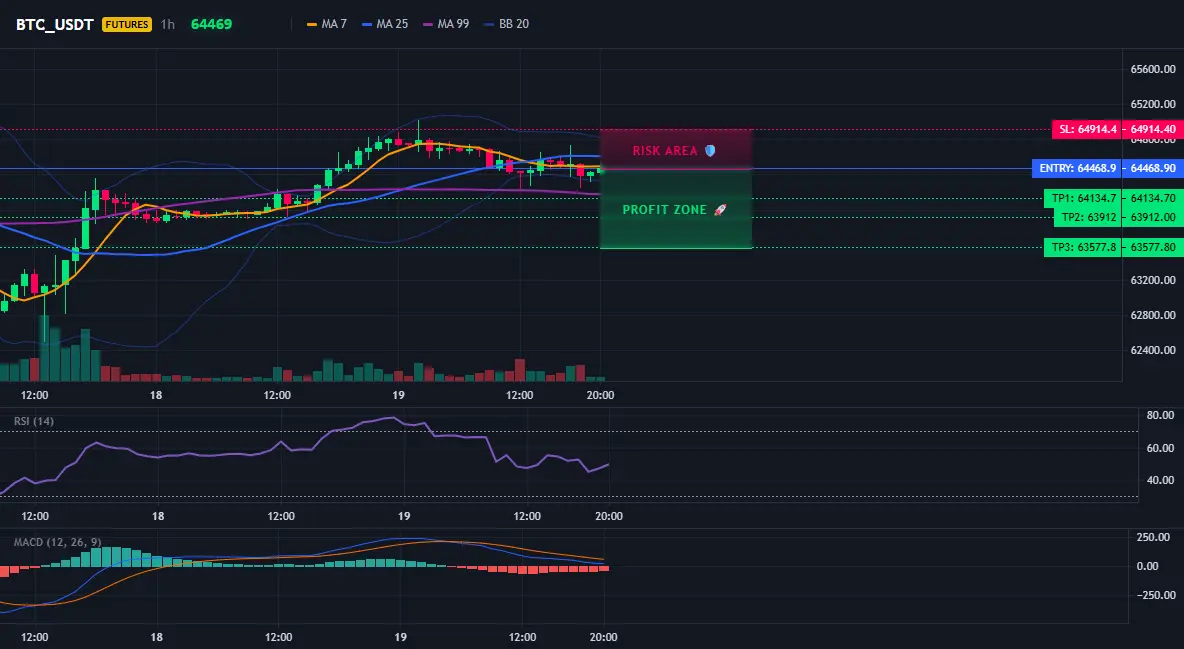
ETH 4-hour EMA has formed a bearish crossover, with the short-side signal lying in wait at 1919.

$ETH /USDT - Go SHORT

Trading plan:
Entry: 1916.11 – 1923.41
SL: 1965.35
TP1: 1885.57
TP2: 1862.77
TP3: 1828.57

Why focus on this structure?
- The current 4H direction is clearly SHORT, with confidence at 77%, and the 1H key resistance at 1919.76 has not been broken.
- RSI on the 15-minute timeframe is 48.05, neutral-to-weak, with no overbought interference; ATR is only 14.6, suitable for a tight stop-loss with big potential upside.
- Why now? Because price is testing the 4H moving-average su
ETH1.99%
View Original
post-image
post-image
  • Reward
  • Comment
  • Repost
  • Share
BTC NEWS and live trading signal
gate liveLIVE
32
  • Reward
  • Comment
  • Repost
  • Share
This short is extremely comfortable—not chasing the drop, but being able to tell something was off the moment price faced pressure at the high. The faster $PIPPIN was pumped before, the less I wanted to chase longs, because the sell pressure above was too obvious.

The key is right here: once the price neared 0.0210, the bulls tried a few times to push further but failed—this time, the critical level started getting broken through. Many people are still waiting for a second pump, but what I see is that the rhythm has shifted from probing an upside break to an active pullback.

Now the curren
PIPPIN0.61%
BTC-0.05%
ETH1.99%
View Original
post-image
  • Reward
  • Comment
  • Repost
  • Share
What the f***??? I know this script!!! 👇 A few days ago, around dawn, the market action was grinding so much it made people want to sleep, but the $LIT key level just would not break. Even the bottom was going sideways—yet it just kept grinding and getting harder. I said then: don’t be scared here. Going long is fine—just keep a close watch.
Don’t fear it grinding. Fear you panicking first. 📌
The entry is at 1.852. Now the price is 2.44, and +1524.89% has already played out. 🚀📈 This move was really grindy at the front, and when it finally ran, it was also really worth it. The brothers on t
LIT-6.96%
BTC-0.05%
ETH1.99%
View Original
post-image
  • Reward
  • Comment
  • Repost
  • Share
The $TA I was watching finally gave an answer. The long positions started from 0.06176, and the price has now been pushed to 0.07353—ROE is already showing +474.42%. This move isn’t a small fluctuation; it’s the real rhythm getting played out.

In the morning, many still thought the rebound lacked momentum, but the order-book details have already changed. The pullback isn’t deep, sell pressure is small, and at key levels the bids keep getting absorbed again and again. With these factors stacked together, I knew you can’t keep viewing this from a weak-minded perspective anymore.

Now the pos
TA-1.95%
BTC-0.05%
ETH1.99%
View Original
post-image
  • Reward
  • Comment
  • Repost
  • Share
This kind of tacit agreement doesn’t need to be said much more 😌📉

A few days ago, when the afternoon session hadn’t fully kicked off yet, the spike at $PROVE looked vicious. But the volume didn’t keep up—there was clearly sell pressure overhead. I watched it each time it pushed up; it just couldn’t quite get over the last bit, so I suggested the short idea—don’t act recklessly.

When it’s time to take profit, don’t pretend you’re calm.

Opened at 0.2644; now the price is at 0.2001. This drop alone answers everything—+1725.58% in hand. No wasted time staring at the chart 🎉🔥💰

For exe
PROVE-1.09%
BTC-0.05%
ETH1.99%
View Original
post-image
  • Reward
  • Comment
  • Repost
  • Share
LTC short positions trap successfully, a 95% win-rate signal has been triggered.
$LTC /USDT - SHORT
Trading plan:
Entry: 45.04 – 45.20
SL: 45.90
TP1: 44.54
TP2: 44.15
TP3: 43.56
Why focus on this setup?
- 4-hour level bearish trend confirmation; RSI (15m=49.7) has not been oversold, and there’s still room for downside
- Enter at 45.12, TP2=44.15 (-2.1%), SL=45.90 (+1.7%), risk-reward ratio 1.2:1
- The daily trend is clearly bearish; this is the window to add to positions in line with the trend
Discussion:
Will this wave of shorts hit TP2 first, or will it fake a breakdown to lure buyers into a
LTC-0.49%
View Original
post-image
post-image
  • Reward
  • Comment
  • Repost
  • Share
TODAY MARKET UPDATES
gate liveLIVE
26
  • Reward
  • Comment
  • Repost
  • Share
Guys, who gets it! This one dumped the moment it hit, and the chart stopped pretending📉🔥 A few days ago, I was still grinding before bed. It was still wiggling/softening on top, and the moment price touched the upper area, it immediately got weak. At the time, I was reading it as a rebound with no volume and insufficient follow-through. The $BSB spot felt way too heavy with “long-bait” — the kind of trap that lures people into going long.
Don’t fear it grinding; fear that you panic first.
From shorting at 0.61559 to now 0.13547, this round’s return is +1536.09%. The part before was tough to
BSB-10.53%
BTC-0.05%
ETH1.99%
View Original
post-image
  • Reward
  • Comment
  • Repost
  • Share
Is the LTC longs still holding up? On the 4-hour timeframe, shorts have already locked in a 95% win rate

$LTC /USDT - SHORT sell

Trading plan:
Entry: 44.95 – 45.11
SL: 45.84
TP1: 44.42
TP2: 44.01
TP3: 43.41

Why focus on this structure?
- The 1D trend is clearly bearish; 4h EMA suppression has been persistent, and the 15m RSI is only 45.08—rebounds are weak.
- Why now? Current 45.03 is close to the resistance zone; LTC has failed to hold above 45.50 for two consecutive days, and the short structure is intact.
- Based on ATR 1h = 0.338: after volatility convergence, it’s about to break
LTC-0.49%
View Original
post-image
post-image
  • Reward
  • Comment
  • Repost
  • Share
The margin loan balance is indeed at a record high of around 38 trillion won, a figure that first crossed this threshold on May 29th and reached 38.63 trillion won by the end of June. The increase from approximately 27.3 trillion won at the beginning of the year is close to 39 percent; while the claim of doubling might be an exaggeration, the growth rate is truly striking. The average daily balance for the second quarter reached 35.94 trillion won, representing a 15.9 percent increase compared to the first quarter average. KOSPI accounts for approximately 76 percent of this balance, while KOSD
post-image
post-image
User_any
The structural integration of high-leverage retail products into concentrated equity markets is undergoing a severe test in South Korea, where single-stock leveraged exchange-traded funds are beginning to dictate the movement of the entire benchmark KOSPI index. Since their highly anticipated debut in late May, when regulators cleared the path for two-times leveraged funds tracking local technology titans like Samsung Electronics and SK Hynix, these instruments have captured an outsized share of domestic trading volume. Originally designed to satisfy retail appetite and keep speculative capital from fleeing to foreign markets, these products have instead created powerful, automated feedback loops that are significantly magnifying daily price swings on the Seoul exchange.
At the core of this structural volatility is a mathematical process known as short-gamma rebalancing, which governs how leveraged ETFs maintain their target exposure. Unlike standard investment funds, a leveraged or inverse ETF must programmatically rebalance its portfolio at the close of every trading session to guarantee it delivers precisely double the daily return of its underlying asset. When a stock rises, the fund is mechanically forced to purchase more shares to maintain its target leverage, and when the stock falls, the fund must aggressively sell. This rigid structure operates entirely independent of company fundamentals, creating a self-reinforcing cycle where programmatic buying artificially extends market rallies, while forced selling deepens intraday plunges.
The systemic risks of this mechanism became painfully clear during recent mid-July trading, when a global reassessment of artificial intelligence valuations triggered a sharp decline in South Korea's premier semiconductor manufacturers. As shares of SK Hynix plummeted by fifteen percent on a single Monday, the slide triggered an automated cascade of selling across more than a dozen leveraged products tied to the stock, dumping billions of dollars back into the cash market before the closing bell. On several high-volatility days, the rebalancing volume of these single-stock leveraged and inverse funds has accounted for over one-third of the total daily trading value across the entire South Korean ETF market, and in some cases, the daily turnover of the leveraged funds has surpassed sixty percent of the underlying stock’s total volume. This extreme concentration has essentially allowed the "tail to wag the dog," transforming what should be passive tracking tools into primary drivers of asset pricing.
The sudden evaporation of retail wealth, with billions of dollars in fund value melting away over just a few trading sessions, has ignited a fierce political and regulatory debate in Seoul. Proponents of the single-stock leverage framework continue to argue that these products serve an important market function, providing sophisticated local hedging tools and giving domestic investors high-yield options that prevent them from moving capital into offshore accounts. However, skeptics and lawmakers are growing increasingly vocal, with some criticizing the regulatory rollout for effectively turning the benchmark index into an volatile casino. Opponents point to the punishing structural effect known as volatility drag, where assets decay rapidly in highly volatile, range-bound markets, leaving long-term retail holders with heavy losses even if the underlying stock eventually recovers. In response to the growing public backlash, the country's financial authorities have convened emergency meetings, actively weighing measures such as raising minimum cash deposit requirements for retail participants, enforcing stricter promotional guidelines, and dispersing the execution of rebalancing trades throughout the day to prevent market-close shocks.
For market observers and digital asset traders tracking these developments on Gate, the South Korean leverage crisis offers a highly valuable case study in structural market design and the systemic risks of concentrated liquidity. The lessons of automated rebalancing and short-gamma feedback loops are highly relevant to the crypto space, where leveraged derivatives, tokenized assets, and algorithmic trading play a dominant role in daily price discovery. Watching how South Korean financial authorities intervene in the coming weeks will be critical, as any sudden regulatory clampdown, higher margin requirements, or product delistings could prompt a significant migration of speculative retail capital out of traditional equity channels and back into alternative digital asset markets. As global capital flows remain highly sensitive to regulatory changes, monitoring these structural shifts
#SummerCreationCamp
repost-content-media
  • Reward
  • 4
  • Repost
  • Share
cryptoLog:
2026 GOGOGO 👊
View More
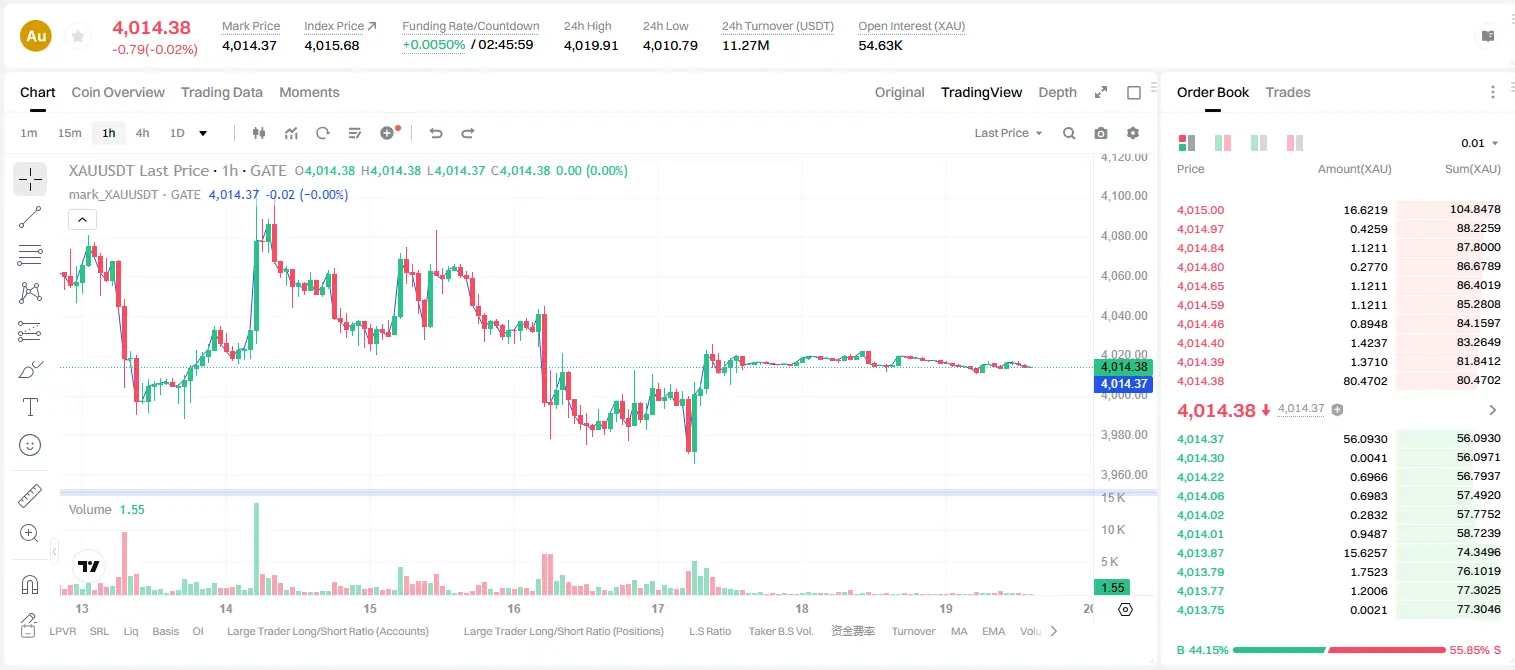
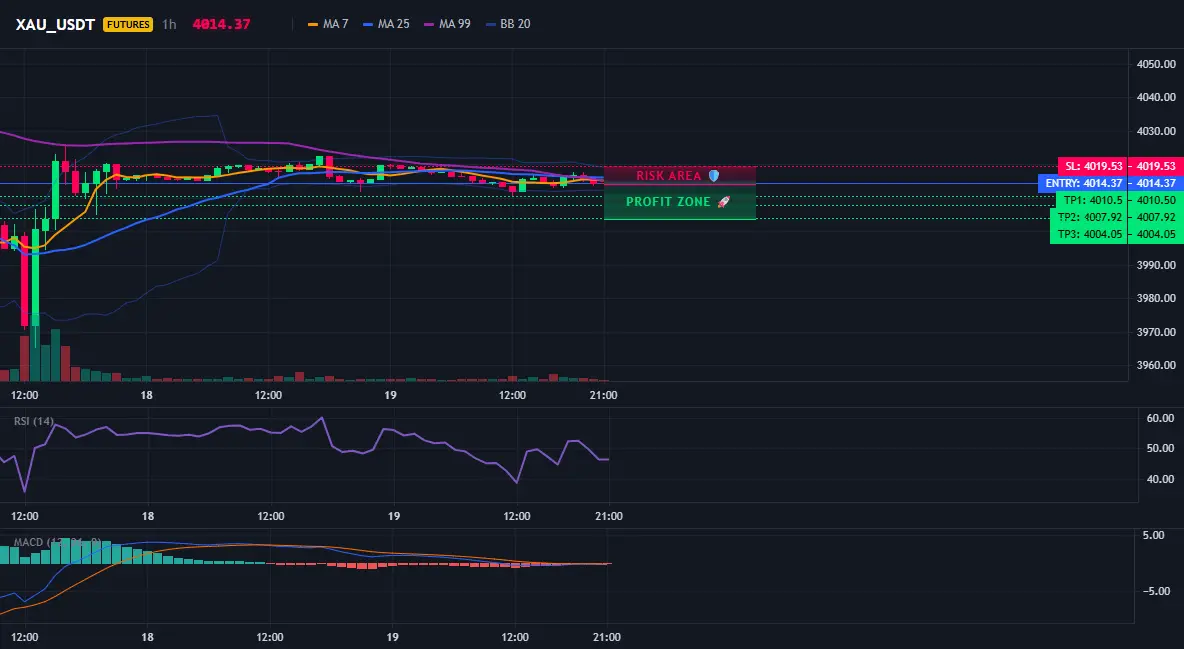
Golden 4060 is set up to trap short-sellers—would you dare to follow this signal?

$XAU /USDT - Short SHORT

Trading plan:
Entry: 4057 – 4063
SL: 4093
TP1: 4035
TP2: 4019
TP3: 3994

Why pay attention to this setup?
• The 4H trend is clearly bearish; RSI on 15M is neutral but slightly weak; 1D is ranging
• Enter around 4060, with TP1 at 4035, TP2 at 4019, and stop-loss at 4093
• Why now? The upper end of the range is being rejected; bearish momentum is building

Discussion:
Will this wave hit TP2 first, or is it a bull-trap?
XAU0.15%
View Original
post-image
post-image
  • Reward
  • Comment
  • Repost
  • Share
Load More

Join 40 M users in our growing community

⚡️ Join 40 M users in the crypto craze discussion
💬 Engage with your favorite top creators
👍 See what interests you
  • Pinned