Trade
Trading Type
Spot
Trade crypto freely
Alpha
Points
Get promising tokens in streamlined on-chain trading
Pre-Market
Trade new tokens before they are officially listed
Margin
Magnify your profit with leverage
Convert & Block Trading
0 Fees
Trade any size with no fees and no slippage
Leveraged Tokens
Get exposure to leveraged positions simply
Futures
Futures
Points
Hundreds of contracts settled in USDT or BTC
Options
HOT
Trade European-style vanilla options
Unified Account
Maximize your capital efficiency
Demo Trading
Futures Kickoff
Get prepared for your futures trading
Futures Events
Participate in events to win generous rewards
Demo Trading
Use virtual funds to experience risk-free trading
Earn
Launch
CandyDrop
Collect candies to earn airdrops
Launchpool
Quick staking, earn potential new tokens
HODLer Airdrop
Hold GT and get massive airdrops for free
Launchpad
Be early to the next big token project
Alpha Points
New
Trade on-chain assets and enjoy airdrop rewards!
Futures Points
New
Earn futures points and claim airdrop rewards
Investment
Simple Earn
Earn interests with idle tokens
Auto-Invest
Auto-invest on a regular basis
Dual Investment
Buy low and sell high to take profits from price fluctuations
Soft Staking
Earn rewards with flexible staking
Crypto Loan
0 Fees
Pledge one crypto to borrow another
Lending Center
One-Stop Lending Hub
VIP Wealth Hub
New
Customized wealth management empowers your assets growth
Private Wealth Management
Customized asset management to grow your digital assets
Quant Fund
Top asset management team helps you profit without hassle
Staking
Stake cryptos to earn in PoS products
BTC Staking
HOT
Stake BTC and earn 10% APR
GUSD Minting
New
Use USDT/USDC to mint GUSD for treasury-level yields
More


Power777
No content yet
Power777
The whole day was just slight fluctuations, and not exceeding expectations is the best result. Now we mainly wait for the U.S. stock market to open on Monday to see if investors' confidence has already emerged from the shadow of Powell's statement about not lowering interest rates in December. But in any case, I firmly believe that it is only a matter of time before the U.S. enters comprehensive monetary easing.
This time may not come quickly, but it is an inevitable trend. Therefore, my current approach is not to care too much about whether the next phase is a "bear market" or a "bull
View OriginalThis time may not come quickly, but it is an inevitable trend. Therefore, my current approach is not to care too much about whether the next phase is a "bear market" or a "bull
- Reward
- like
- Comment
- Repost
- Share
Trump has not yet commented on Powell's remarks, but the market has gradually emerged from pessimistic expectations. By viewing $BTC as a precursor to the US stock market, it is evident that investors' sentiment is still quite good, and there are no notable events in the short term. The lack of macro data due to the shutdown may not be resolved in the last week or two, and most of the major companies have already released their earnings reports.
The market's significant speculation will likely occur after the end of the shutdown. Although the market anticipates that a prolonged sh
The market's significant speculation will likely occur after the end of the shutdown. Although the market anticipates that a prolonged sh
BTC-2.56%
- Reward
- 1
- Comment
- Repost
- Share
Although the data for Bitcoin and Ether was poor yesterday, both saw net outflows, the amount of funds flowing out of Ether was only one-third of that of Bitcoin. When sentiment is bad, investors tend to sell more Bitcoin. I wonder if it's because more Ether is trapped, and investors don't want to sell.
BlackRock's investors remain the largest sellers, and their reductions still exceed the total reductions of all other institutions combined. Traditional investors' attitudes towards cryptocurrencies are gradually waning, and there has already been a shift of funds to US stocks.
View OriginalBlackRock's investors remain the largest sellers, and their reductions still exceed the total reductions of all other institutions combined. Traditional investors' attitudes towards cryptocurrencies are gradually waning, and there has already been a shift of funds to US stocks.
- Reward
- like
- Comment
- Repost
- Share
Powell's expectation of no interest rate cuts in December has affected the response to the earnings reports of U.S. stocks, and in the short term, market sentiment is indeed quite poor. However, after today's U.S. stock market closes, the new round of earnings reports looks promising, even though there was a significant fall yesterday, and the pre-market is already starting to rise today. Currently, BTC and tech stocks are still maintaining a strong consistency; at least for now, I haven't seen the risk of BTC and tech stocks decoupling. In fact, the biggest problem right now is th
BTC-2.56%
- Reward
- like
- Comment
- Repost
- Share
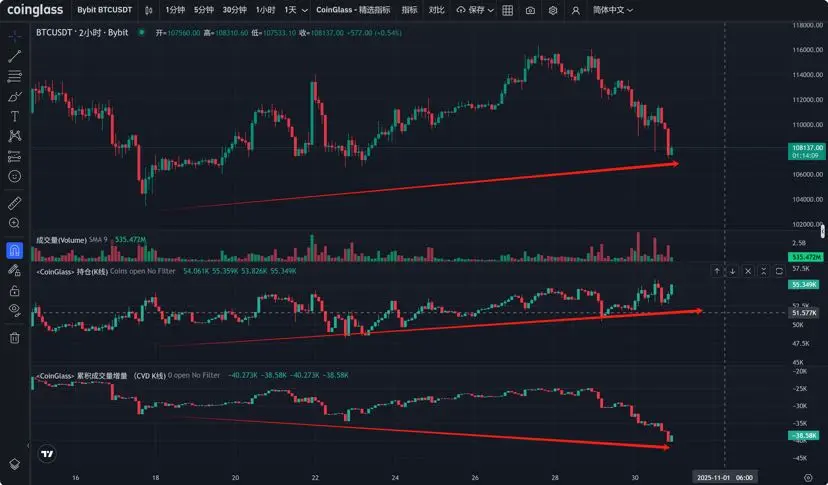
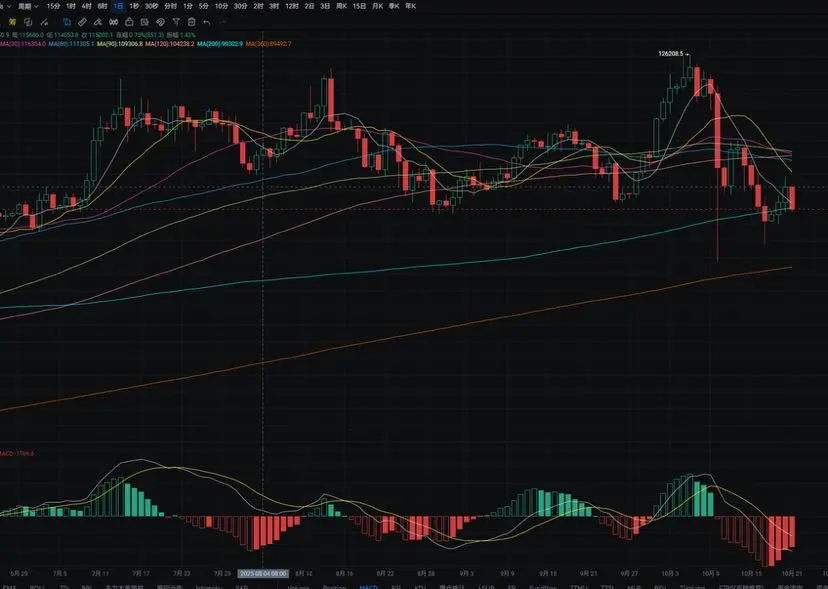
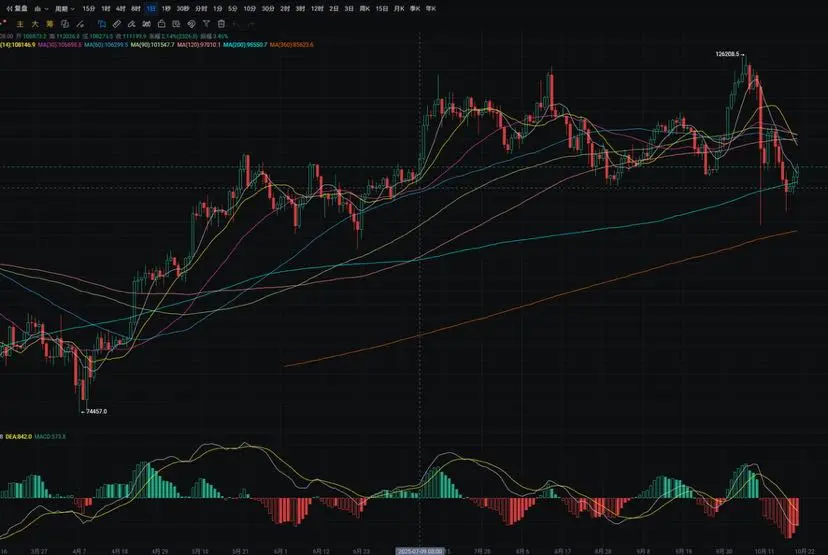
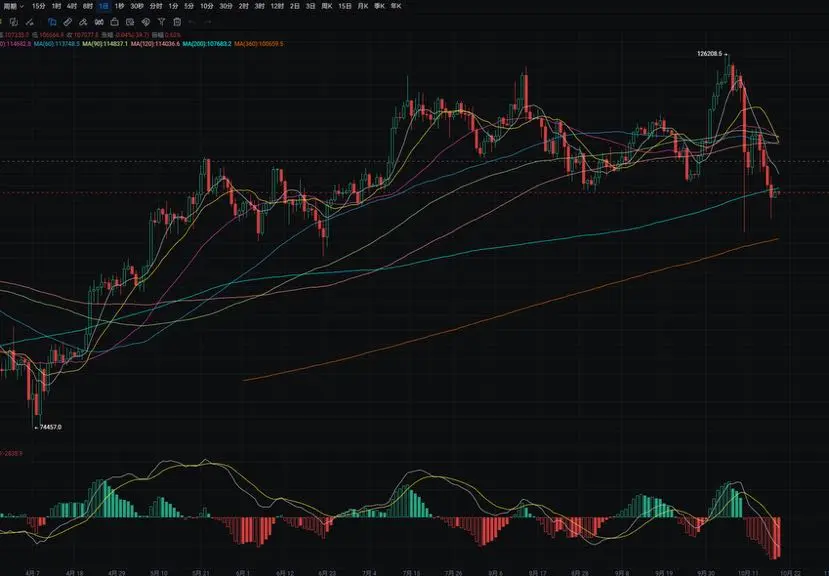
After the opening of the US stock market, the price of BTC has been on a downward trend, while the performance of the US stock market itself is quite good. Even with the Fed announcing a rate cut of 25 basis points and preparing to halt balance sheet reduction in December, it has not stopped Bitcoin's decline. I checked some data and information and did not find any unfavorable information. The first thought is that US stocks, especially technology stocks, are absorbing more Liquidity. The weekly chart shows a "two bearish lines sandwiching one bullish line" pattern (the weekly chart has n
BTC-2.56%
- Reward
- like
- Comment
- Repost
- Share
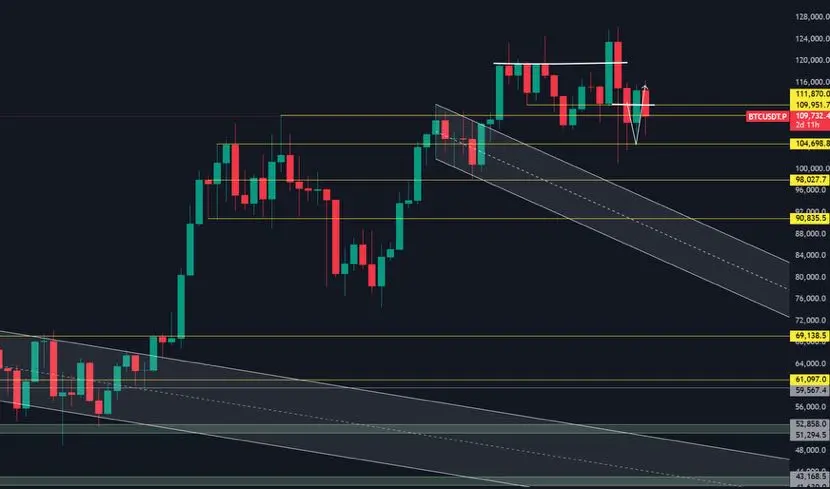
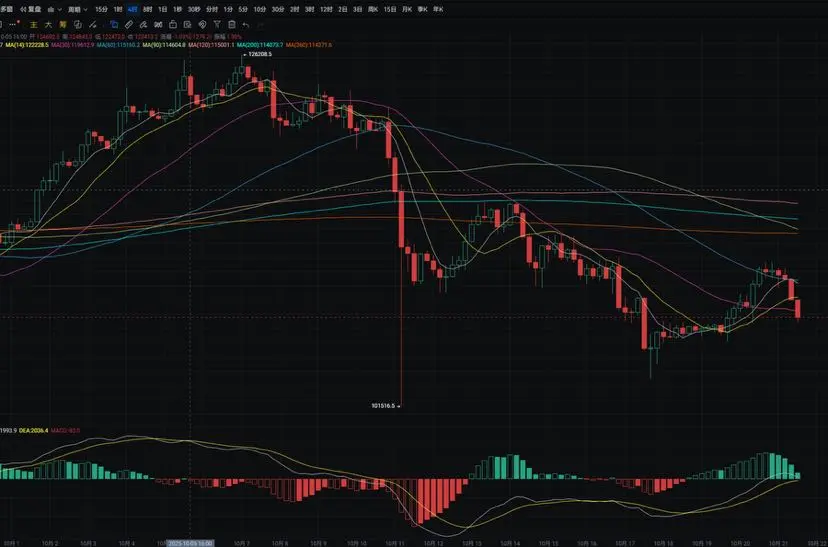
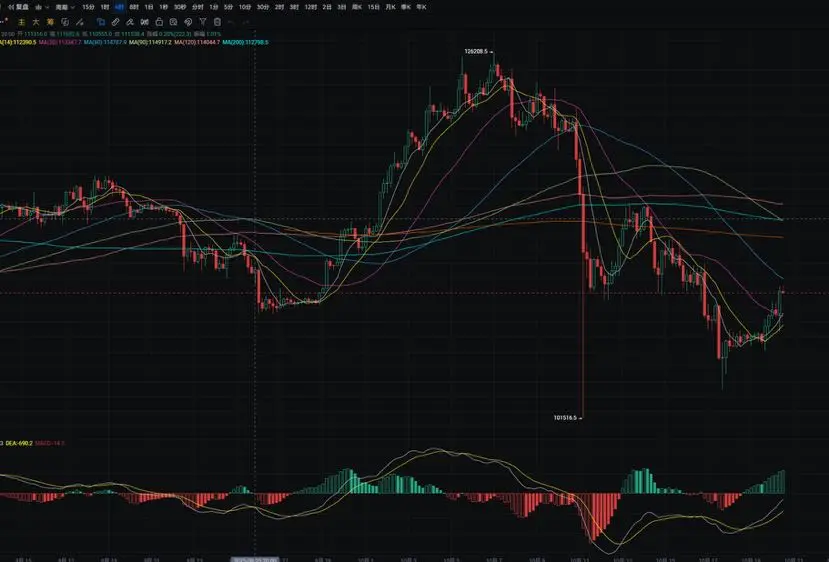
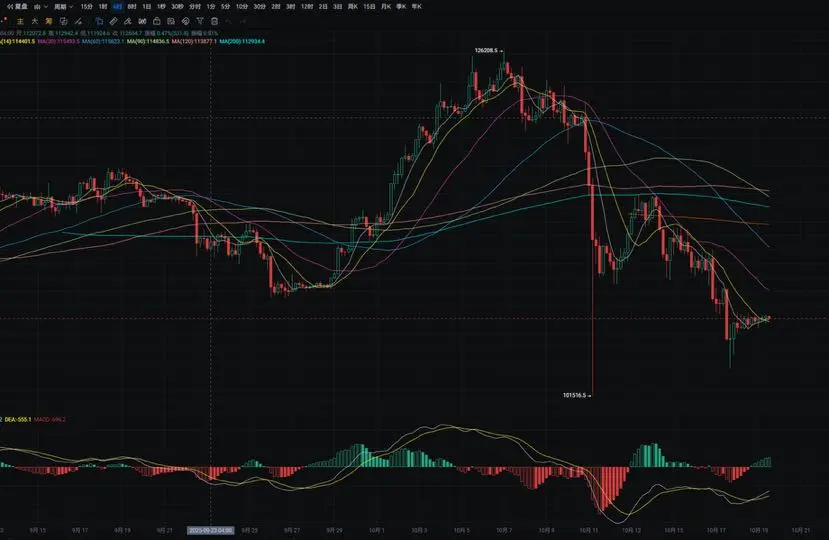
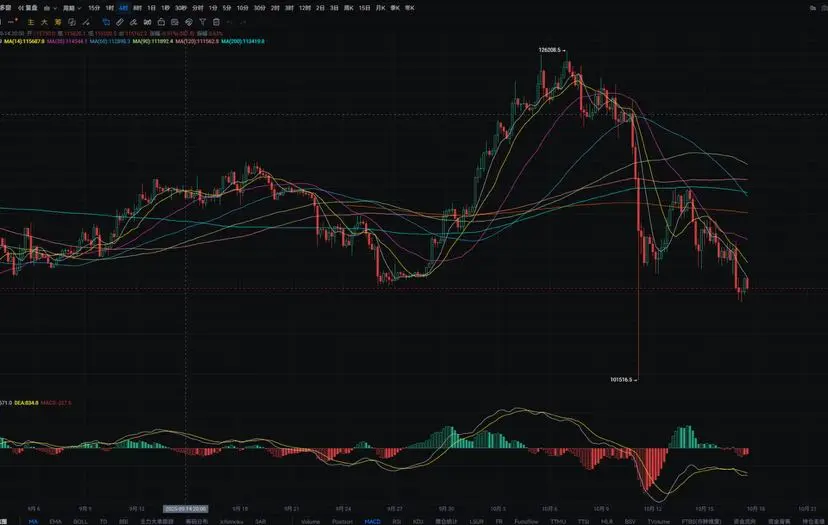
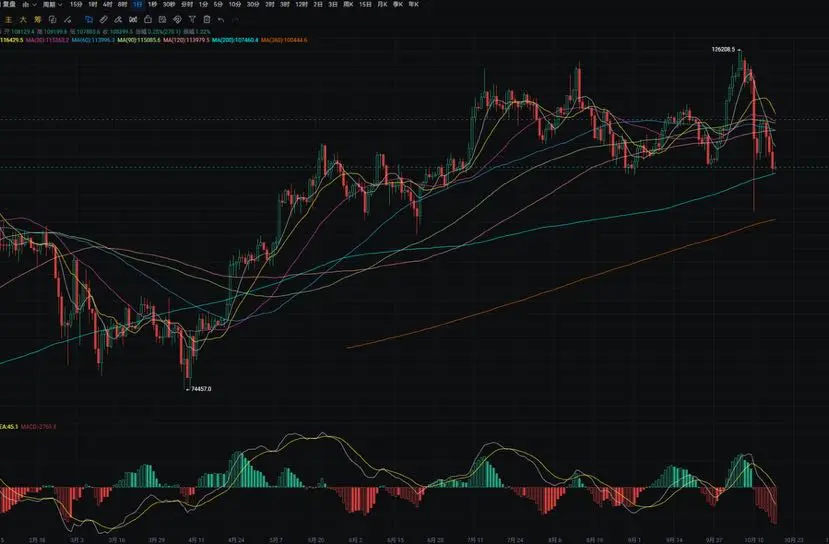
BTC closed bearish this week, with the upper shadow touching the upward trend line at 116,000 before retreating; if it cannot recover 113,800, the weekly chart may retest the lower band (the bottom of the funnel); on the daily chart, a "hammer line" appeared yesterday but with increased volume, forming a "bearish three crows" pattern with three consecutive bearish lines (unless it recovers today); the key support level on the daily chart is 110,500 (lower band of the rising channel), and a break below may look towards the possibility of 104,000; for the short-term, focus on the 4-hour chart, a
BTC-2.56%
- Reward
- like
- Comment
- Repost
- Share
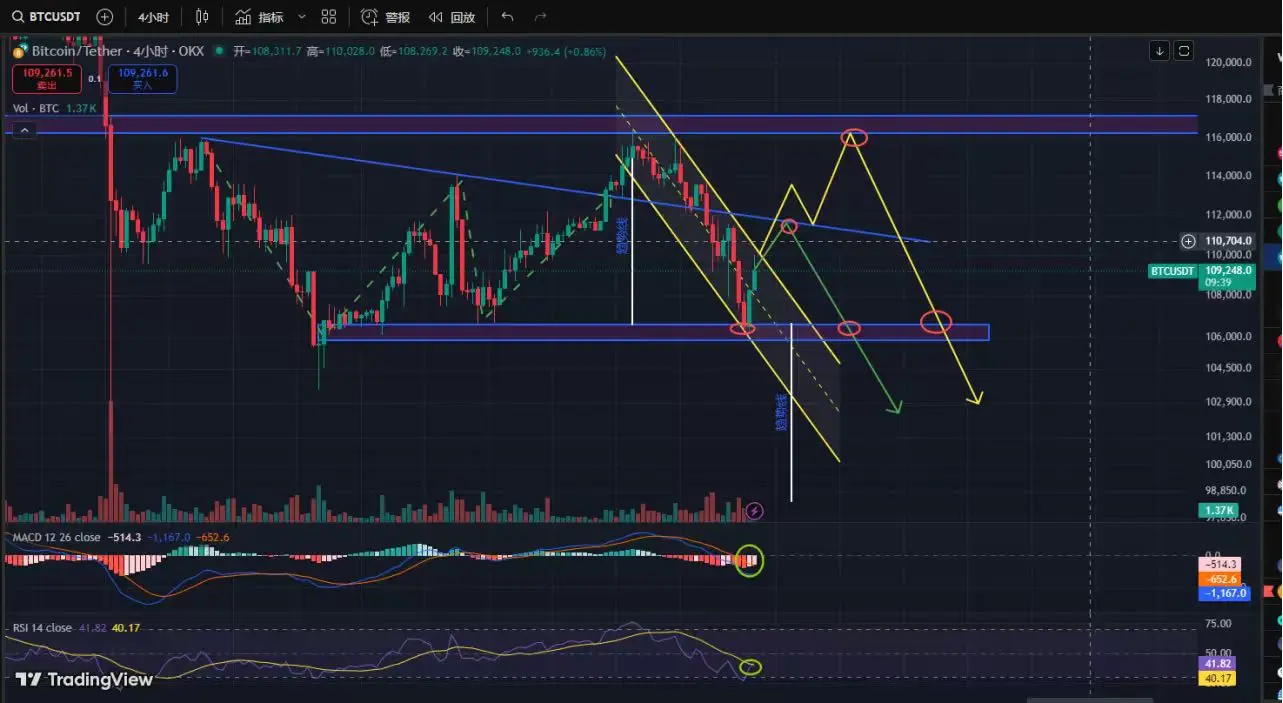
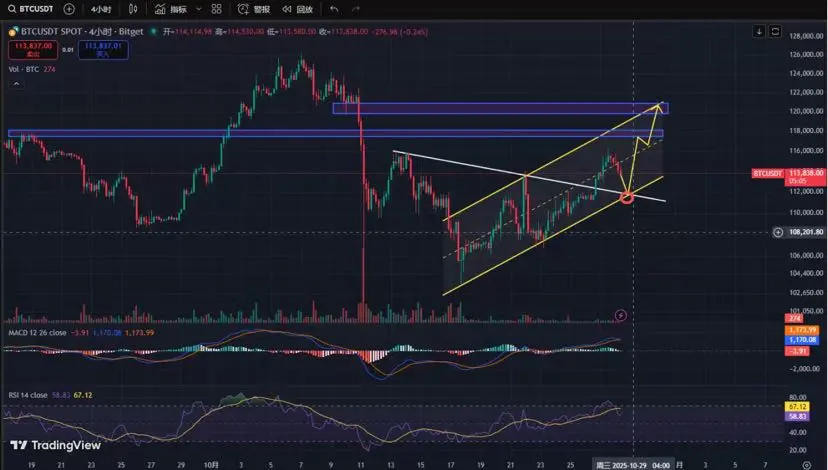
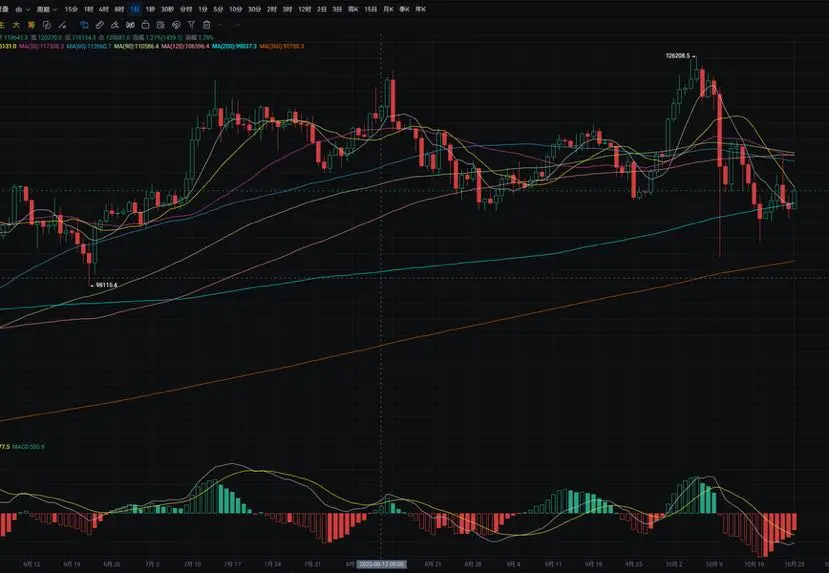
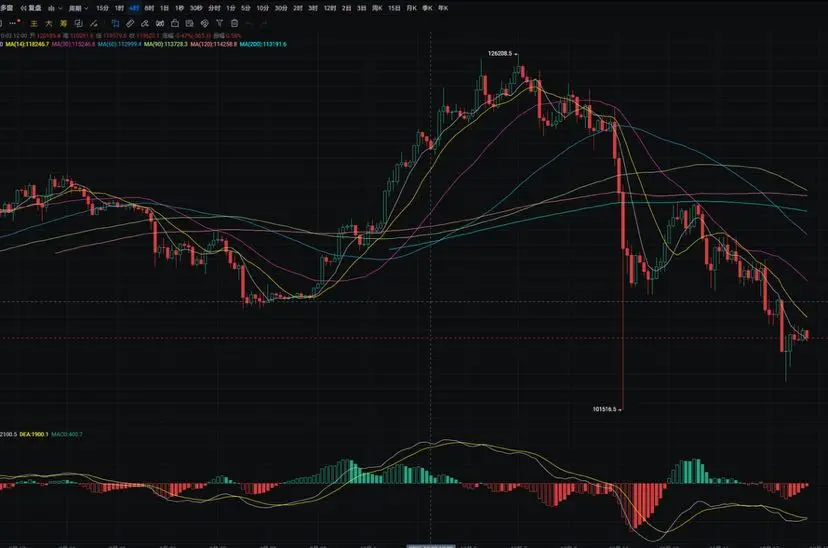
The BTC weekly chart shows a bullish engulfing pattern, indicating a rebound signal, but it does not constitute a reversal; key resistance above: 117500-122000 area; the daily chart structure breaks the descending trend line, but yesterday's hammer line, with increased volume, suggests that if the daily chart holds above around 111800, there is a chance to continue the rebound trend; both MACD and RSI have golden crosses upwards, indicating the possibility of a continuation of the long positions structure; for short-term levels, pay attention to the 4-hour chart, where short-term opportuni
BTC-2.56%
- Reward
- 1
- Comment
- Repost
- Share
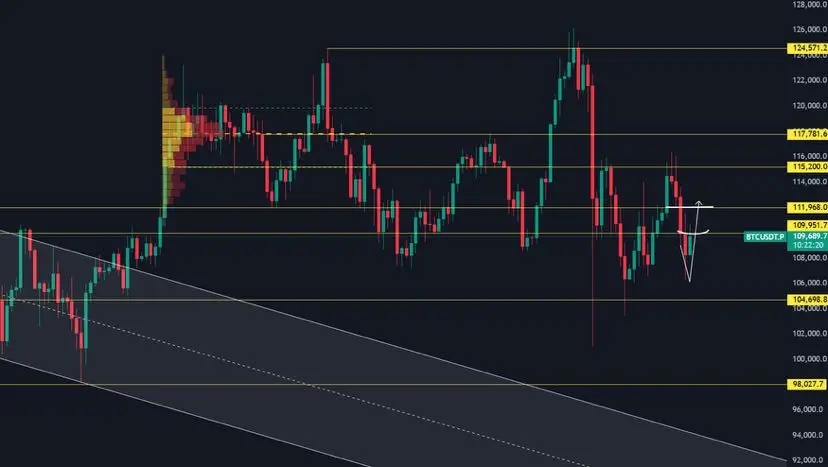
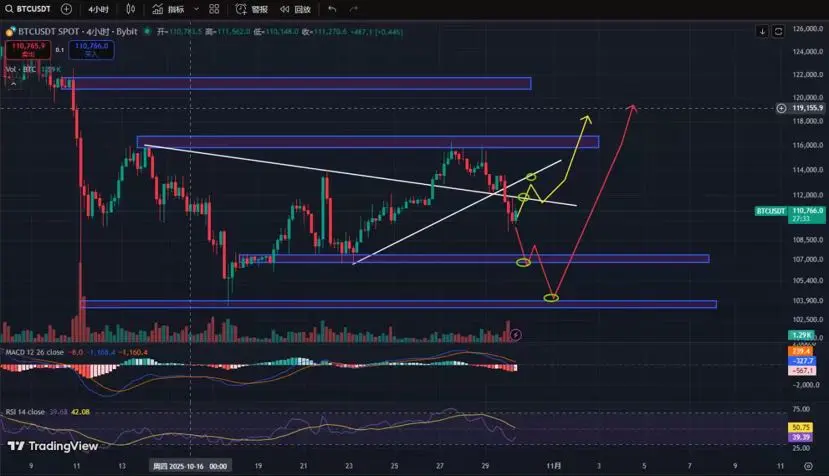
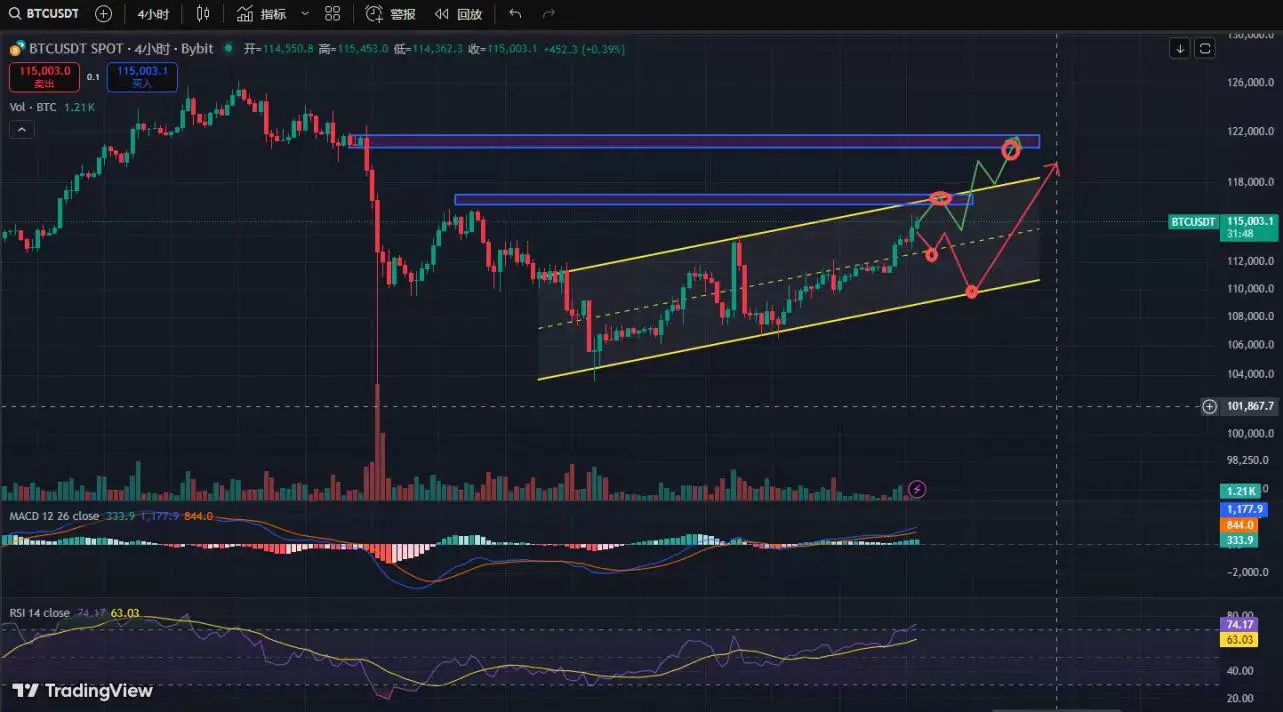
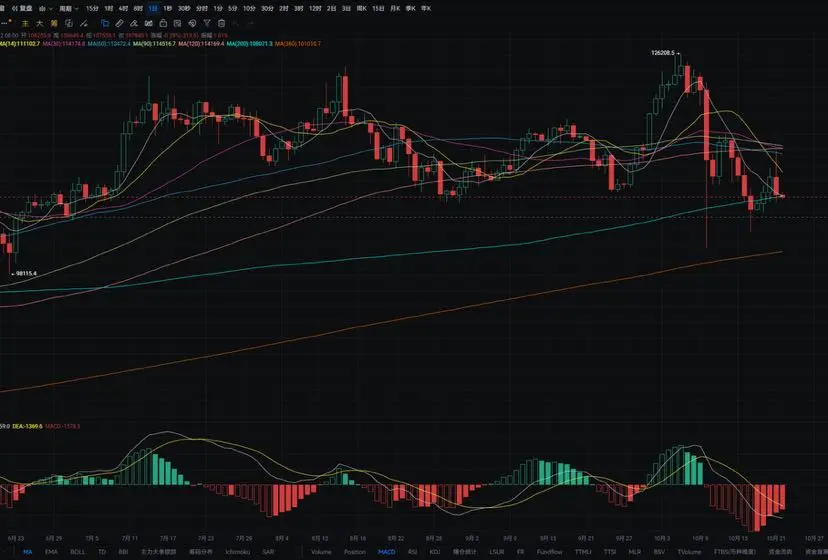
The weekly chart of BTC shows a bullish line engulfing pattern, indicating a potential reversal signal. Key resistance above: around $120,000 (weekly FVG gap), which is also the area of previous highs and loss-making positions. The daily chart breaks through the descending trend line, closing with a higher trade volume large bullish line, forming a W bottom neckline breakout pattern. First resistance: 115,800, second resistance: 117,800, third resistance: 120,000–124,000. Both MACD and RSI show a golden cross pattern upwards, indicating the continuation of long positions structure. For short-t
BTC-2.56%
- Reward
- like
- Comment
- Repost
- Share
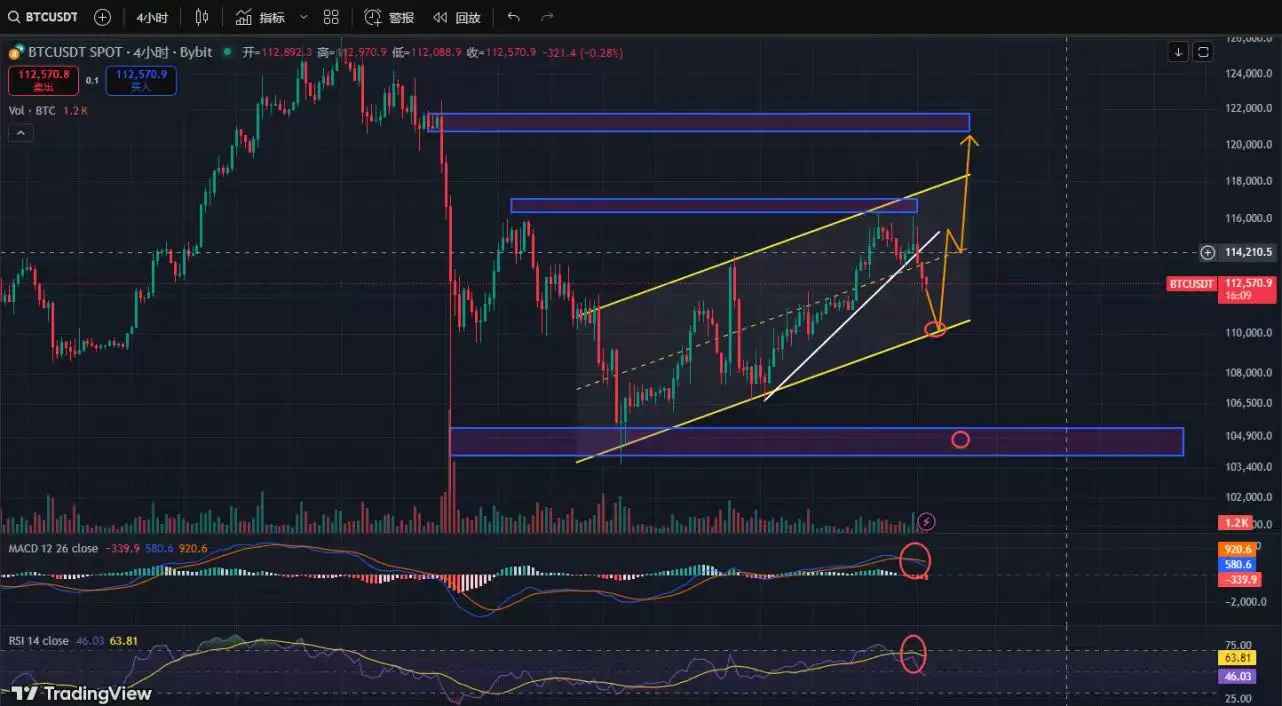
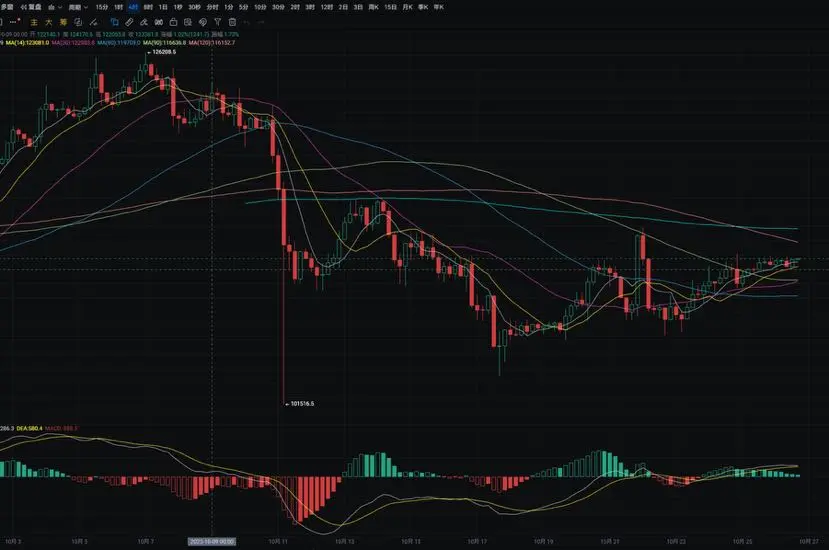
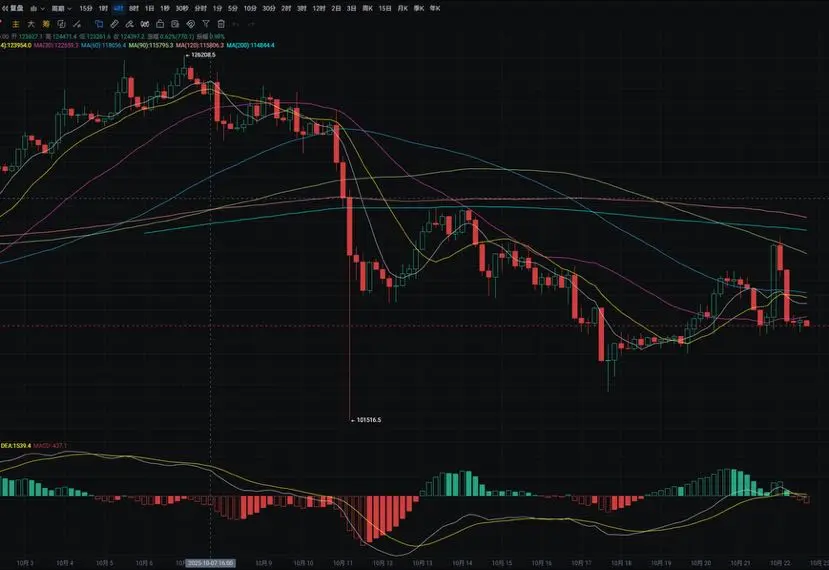
BTC daily chart yesterday rose from a low of around 110600 to a high of around 111900, closing near 111600. The support level is near MA14; if it breaks, we can look down to around MA200. A pullback can be used to enter long positions nearby. The resistance level is near 112750; if it breaks, we can look up to around MA120. A rebound to nearby can be used to enter short positions. MACD shows an increase in long positions, forming a golden cross pattern. In the four-hour chart, the support level is near MA90; if it breaks, we can look down to around MA60. A pullback can be used to enter long po
BTC-2.56%
- Reward
- like
- Comment
- Repost
- Share
BTC daily chart yesterday rose from a low of around 109650 to a high of around 112100, closing around 110950. The support level is near the MA7 moving average; if it breaks down, it can look to the MA200 nearby. A pullback can be taken nearby for long positions. The resistance level is around 112100; if it breaks through, it can look to the MA60 nearby. A rebound to nearby can be taken for short positions. MACD short positions are decreasing, showing signs of a golden cross pattern. The four-hour support level is near the MA14; if it breaks down, it can look to the MA60 nearby. A pullback can
BTC-2.56%
- Reward
- like
- Comment
- Repost
- Share
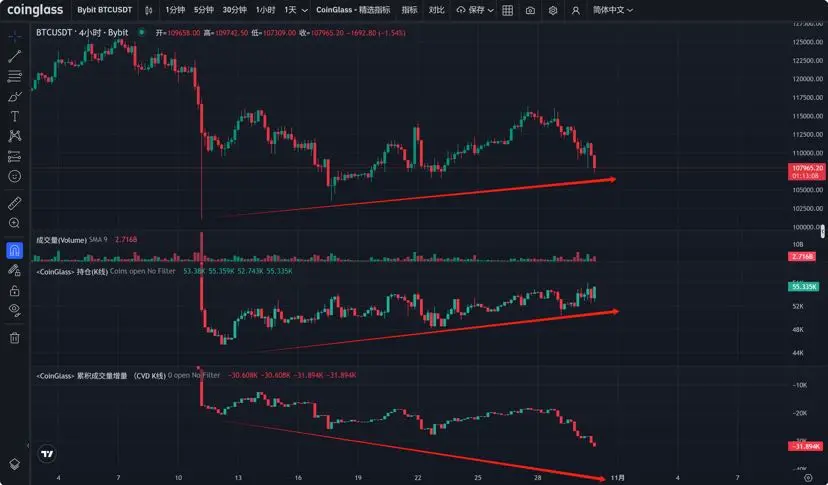
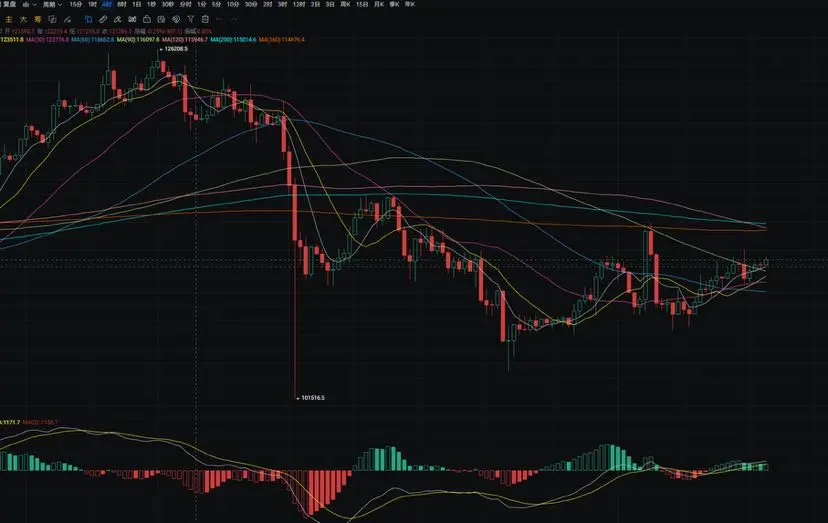
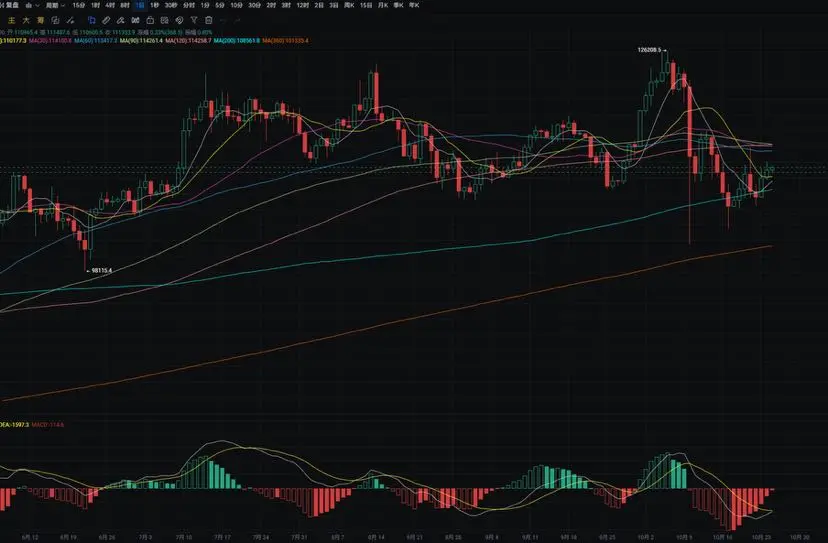
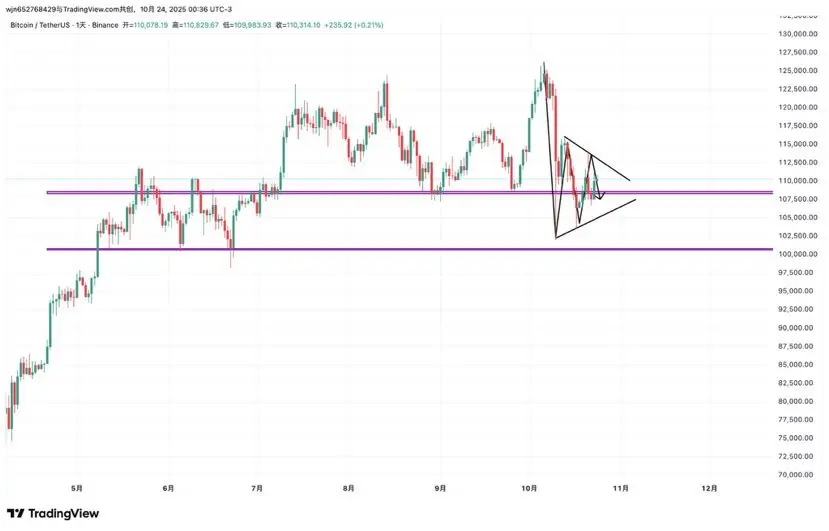
BTC Weekly Level: This week's Candlestick still primarily shows consolidation, with small Fluctuation, and has not yet broken below the double top neckline. Only if it breaks below can we look at the key support below.
Daily level: The continuation pattern of the structure's upward and downward trend has not changed, and the triangular pattern's fluctuations are gradually converging.
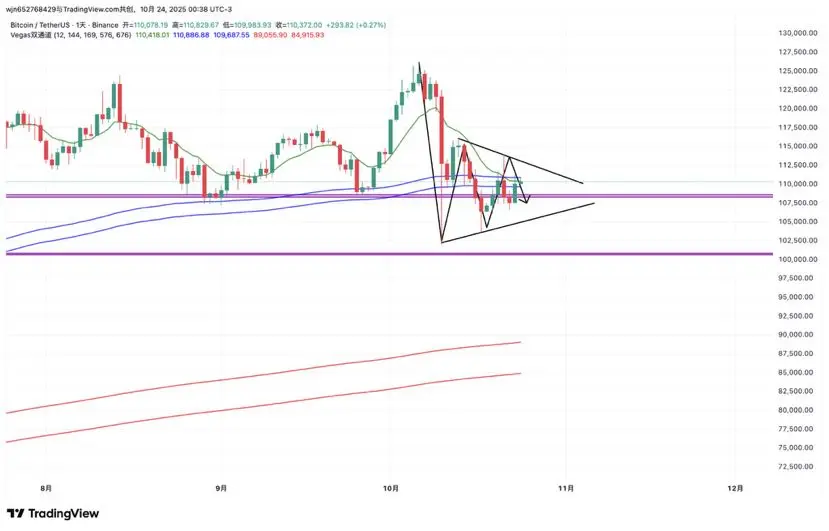
Technically, the price has still not effectively broken through the Vegas resistance, with the middle band of the Bollinger providing resistance.
4-hour level: Vegas has already crossed bearish, and it
Daily level: The continuation pattern of the structure's upward and downward trend has not changed, and the triangular pattern's fluctuations are gradually converging.
Technically, the price has still not effectively broken through the Vegas resistance, with the middle band of the Bollinger providing resistance.
4-hour level: Vegas has already crossed bearish, and it
BTC-2.56%
- Reward
- like
- Comment
- Repost
- Share
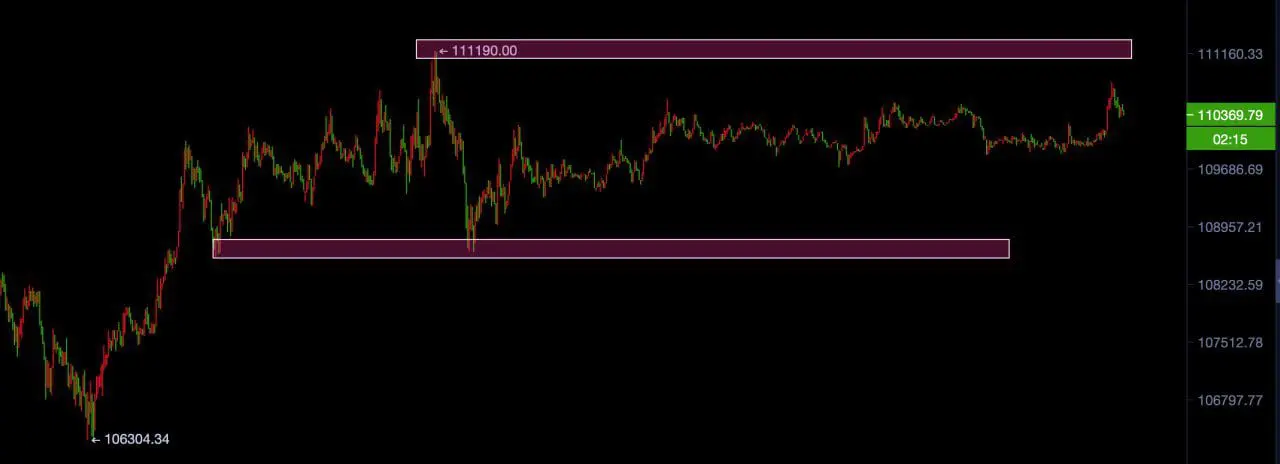
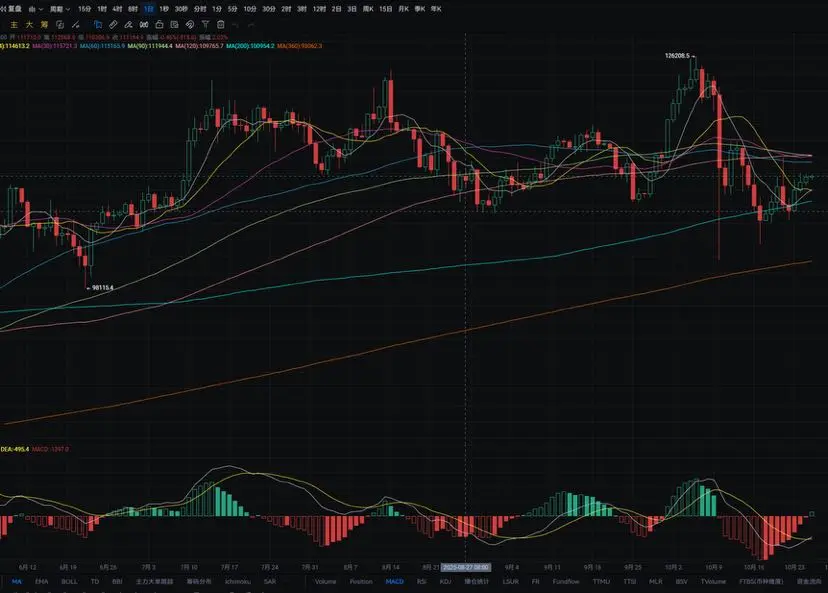
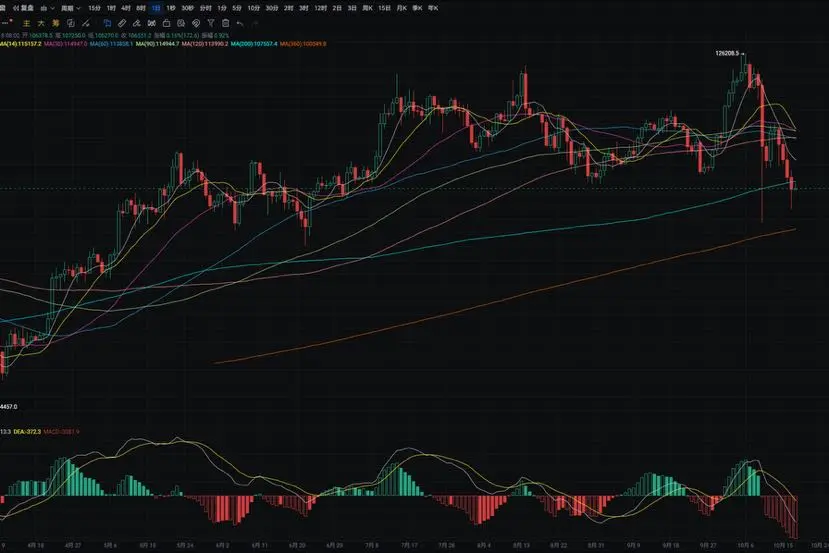
The price of BTC is still operating above the strongest daily candle closing support level of 107500 in the past two months. In the short-term, it has rapidly pumped back after two false breaks below 107500. The upward momentum is not very strong, characterized by a slow rise. Accelerated increases often fall back to the original position after waking up. The support level for BTC in the short-term has tested 107500 N times, each time bouncing back quickly after a false break. This is also a very important support level. This month, the lowest long wick candle point for BTC was 101500, and las
View Original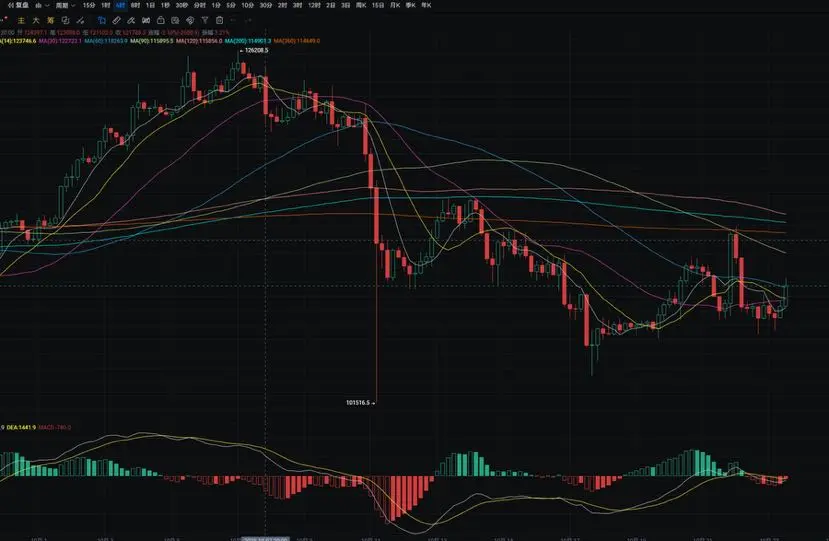
- Reward
- like
- Comment
- Repost
- Share
The BTC daily chart yesterday fell from a high of around 113950 to a low of around 107400, closing around 108250. The support level is around 107050; if it breaks, we could see a drop to around 105250. A pullback can be used to enter long positions nearby. The resistance level is around 109550; if it breaks, we could see a rise towards MA14. A rebound to nearby levels can be used to enter short positions. MACD shows a decrease in short positions. On the four-hour chart, the support level is around 107150; if it breaks, we could see a drop to around 106350. A pullback can be used to enter long
BTC-2.56%
- Reward
- like
- Comment
- Repost
- Share
The BTC daily chart rose from around 107350 yesterday to around 111650, closing at around 110450. The support level is around 106300; if it breaks, it could fall to around 104650. A pullback could allow for long positions nearby. The resistance level is around 109500; if it breaks, it could reach around 111050. A rebound nearby could allow for short positions. The MACD shows shrinking short positions. On the four-hour chart, around 107250, if it breaks, it could fall to around 105600. A pullback could allow for long positions nearby. The resistance level is around MA14; if it breaks, it could
BTC-2.56%
- Reward
- like
- Comment
- Repost
- Share
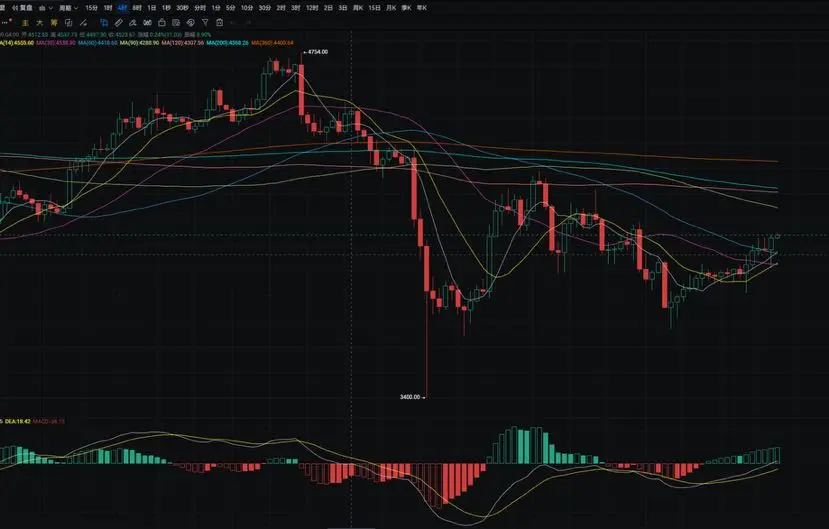
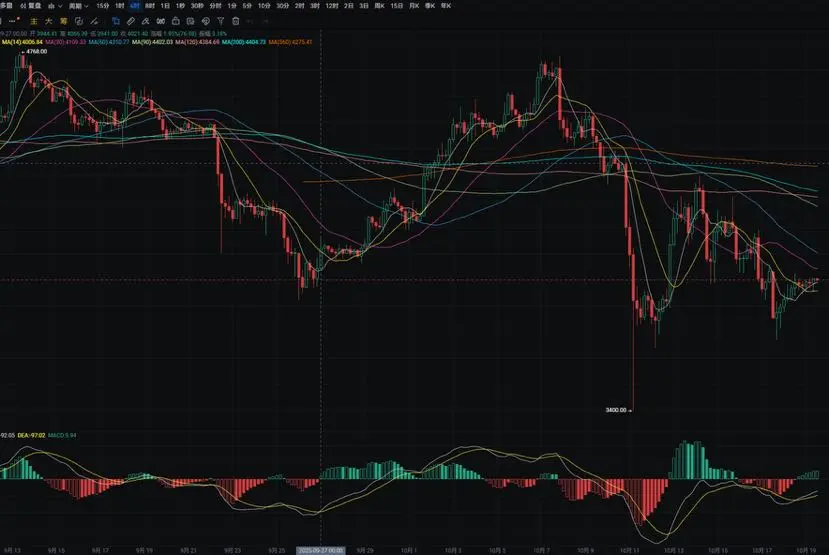
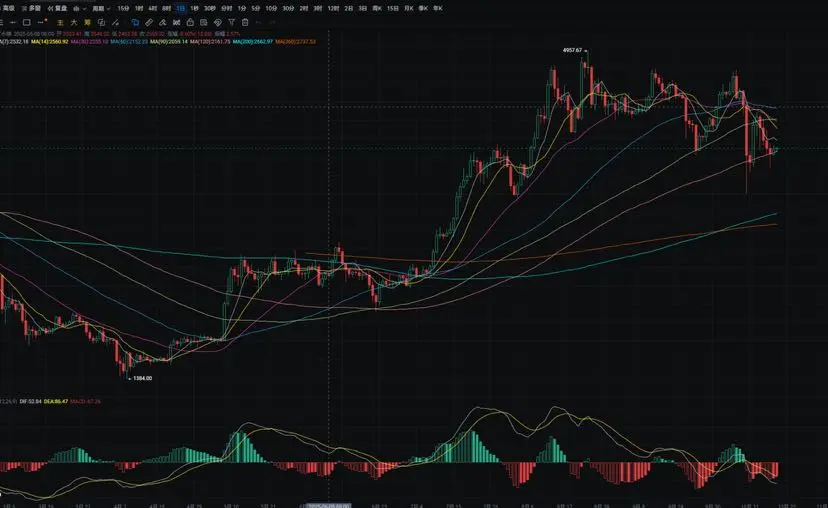
The Ether daily chart rose yesterday from a low of around 3810 to a high of around 4030, closing at around 3980. The support level is around MA120; if it breaks down, it can be seen at around 3750. A pullback can be an opportunity to go long nearby. The resistance level is at around 4095; if it breaks through, it can be seen at around 4150. A rebound to the nearby area can be an opportunity to go short. The MACD shows a decrease in short positions. On the four-hour chart, the support level is at around MA60; if it breaks down, it can be seen at around MA30. A pullback can be an opportunity to
ETH-4.01%
- Reward
- 1
- Comment
- Repost
- Share
The daily chart for BTC rose from a low of around 106050 yesterday to a high of around 109400, closing at around 108600. The support level is around 108550; if it breaks, it could drop to around 107200. A pullback may allow for long positions in the vicinity. The resistance level is around 111100; if it breaks, it could reach around MA14. A rebound to the vicinity may allow for short positions. MACD shows a decrease in short positions. On the four-hour chart, the support level is near MA30; if it breaks, it could drop to around 107100. A pullback may allow for long positions in the vicinity. M
BTC-2.56%
- Reward
- 1
- Comment
- Repost
- Share
The Ether daily chart rose from the lowest around 3815 to the highest around 3925 yesterday, closing near 3885. The support level below is around 3790; if it breaks, we can look to around 3675. A rebound can be taken near this level for long positions. The resistance level above is near the MA7 moving average; if it breaks, we can look to around 4075. A rebound to near this level can be taken for short positions. The MACD shows a decrease in short positions. The four-hour chart has a support level below at around 3795; if it breaks, we can look to around 3725. A rebound can be taken near this
ETH-4.01%
- Reward
- like
- Comment
- Repost
- Share
BTC daily chart yesterday rose from the lowest around 106250 to the highest around 107450, closing near 107100. The support level is near 106050; if it breaks, it can look down to around 104700. A pullback can be taken to go long nearby. The resistance level is near 108300; if it breaks, it can look towards the MA7 moving average. A rebound nearby can be taken to go short. MACD shows a decrease in short positions. In the four-hour chart, the support level is near 106350; if it breaks, it can look down to around 105550. A pullback can be taken to go long nearby. The resistance level is near 108
BTC-2.56%
- Reward
- like
- Comment
- Repost
- Share
On the daily chart, BTC fell from a high of around 109200 yesterday to a low of around 103470, closing near 106400. The support level is near 104700; if it breaks, it could drop to around 102750. A pullback could allow for short positions nearby. The resistance level is near 108250; if it breaks, it could rise to around 110000. A rebound to nearby could allow for short positions. MACD shows an increase in short positions. On the four-hour chart, the support level is near 105600; if it breaks, it could drop to around 104500. A pullback could allow for long positions nearby. The resistance level
BTC-2.56%
- Reward
- like
- Comment
- Repost
- Share
The daily chart of BTC yesterday fell from a high of around 111950 to a low of around 107350, closing at around 108150. The support level is near 107300, and if it breaks, it can be seen at around 105550. A pullback can be used to go long nearby. The resistance level is around 109650, and if it breaks, it can be seen near the MA7 moving average. A rebound to the vicinity can be used to go short. The MACD shows an increase in short positions. On the four-hour chart, the resistance level is near the MA7 moving average; if it breaks, it can be seen near the MA14. A rebound to the vicinity can be
BTC-2.56%
- Reward
- like
- Comment
- Repost
- Share