JintuFulu
vip
Age 7.6 Year
Peak Tier 2
Jin Zhi soars proudly in the crypto world, With dolphins driving through waves, overcoming thousands of difficulties. Wealth is planned and strategies unfold, paving the golden road, As the rhythm of the universe turns, fortunes are transformed.
#成长值抽奖赢iPhone17和周边 The rise of the ladder volume does not necessarily equal risk; it just indicates the possibility of risk under certain circumstances. The specific reasons are as follows:

- Selling pressure gradually increases: After a period of price rise, if there is an increasing selling volume, it may indicate that investors are starting to take profits, or there are disagreements in the market regarding the stock's value, leading to a gradual increase in selling pressure. Although trading volume is continually expanding, the price rise lacks strength, indicating that the selling
BTC-3.58%
View Original
post-image
  • Reward
  • Comment
  • Repost
  • Share
#成长值抽奖赢iPhone17和周边 The risk of a spinning top in a Candlestick is very high, mainly for the following reasons:

- Difficult to discern the intentions of the main force: The consolidation line is a candlestick pattern composed of a long upper shadow candlestick and a long lower shadow candlestick. It may signal either the main force's washout or selling. If it is a washout, the stock price may continue to rise; however, if it is selling, the stock price may drop significantly. For example, if a consolidation line appears during the initial phase of a price increase, it may indicate that t
BTC-3.58%
View Original
post-image
  • Reward
  • Comment
  • Repost
  • Share
#美联储降息25个基点 After a major Get Liquidated, the market trends are usually quite complex, and the following situations may occur:

- Short-term volatility: Get Liquidated can trigger a large number of contracts to be concentrated in selling or buying, breaking the original supply-demand balance in the market, leading to significant price fluctuations in the short term. For example, if a large holder of long contracts gets liquidated and their contracts are forcibly sold, it will suddenly increase market supply, thereby lowering prices; conversely, if a short position gets liquidated, it may caus
BTC-3.58%
XRP-5.9%
View Original
post-image
  • Reward
  • Comment
  • Repost
  • Share
The weekly level repair pattern is an important basis for judging the medium-term trend changes in stock prices, and the common ones include the following types:

- Arc bottom: This is a relatively complex bottom pattern that usually appears during the transition from bear to bull markets on a weekly chart. Its shape resembles a dish or a bowl, and the bottoming process takes a longer time. During the formation, trading volume often changes in an arc shape, first gradually shrinking, and then gradually expanding as the stock price rises.

- Triple Bottom: Also known as "π bottom," it consist
BTC-3.58%
XRP-5.9%
View Original
post-image
  • Reward
  • Comment
  • Repost
  • Share
In the K线, there are various forms of long positions trend, below are some common forms.

1. After the moving averages congeal, they diverge upwards: During a sideways adjustment, the short, medium, and long moving averages intertwine and congeal together. Then, they suddenly break out of the congealed state, diverging upwards and gradually forming a long positions arrangement. The longer the congeal time, the greater the strength of the upward divergence.

2. Silver Valley: Formed by the intersection of three moving averages, the short-term moving average crosses above the medium- and long-
BTC-3.58%
XRP-5.9%
View Original
post-image
  • Reward
  • Comment
  • Repost
  • Share
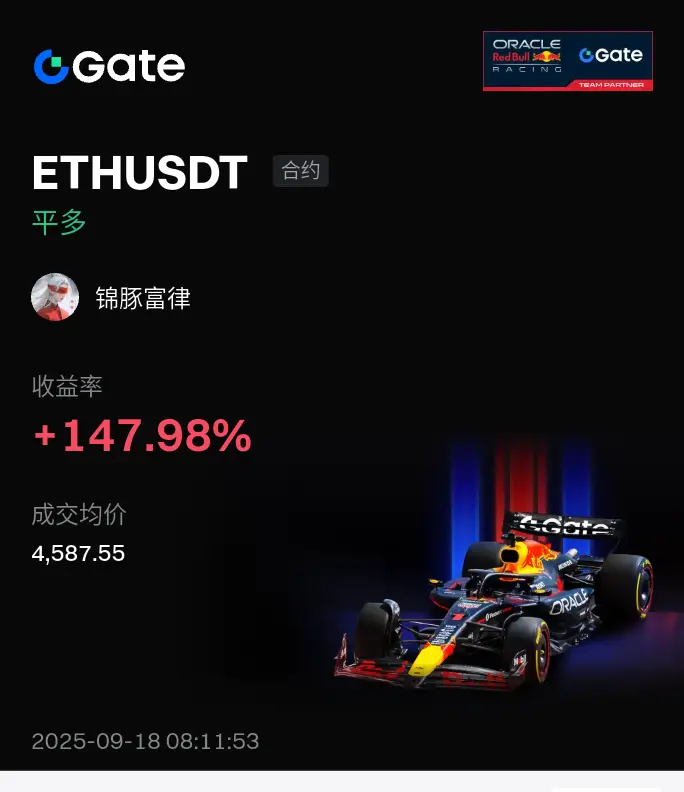
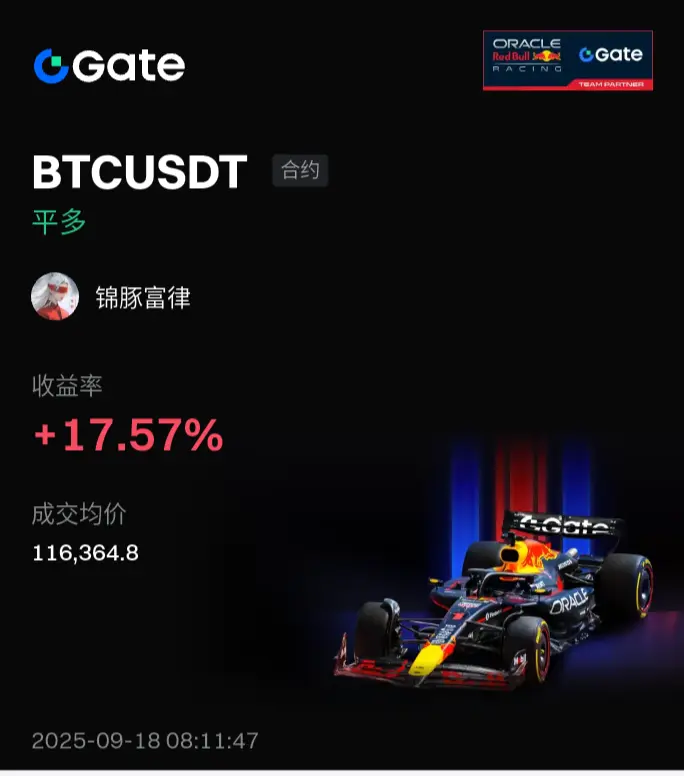
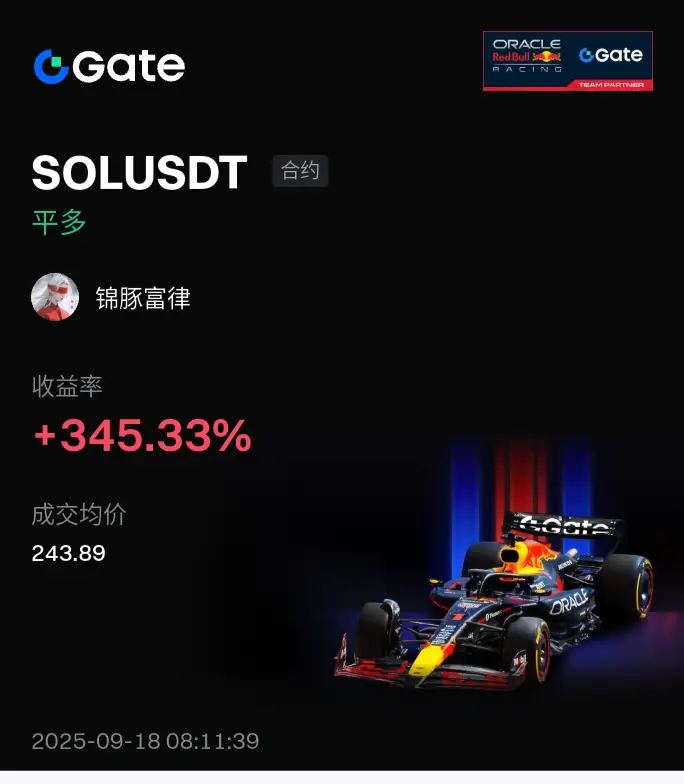
#BTC战略储备市场影响 I used to feel lost before, and my account was quiet, which made me anxious. Later, I gradually adjusted, and when I opened it this morning, I was surprised to see I made a profit! Instantly, I stood up straight, and I even dared to add extra pearls to my bubble tea. This feeling is amazing!
BTC-3.58%
XRP-5.9%
View Original
post-image
post-image
post-image
  • Reward
  • Comment
  • Repost
  • Share
#XRP ETF上线 In candlesticks, the pregnant line is a pattern formed by two candlesticks, with the following characteristic states:

- Formation: The first Candlestick is long, the second Candlestick is short, and the highest and lowest prices of the second Candlestick must not exceed the highest and lowest prices of the previous Candlestick, resembling a pregnant woman, hence it is called the Pregnant Line.

- Specific pattern classification: First, the Bullish Engulfing Line, where the previous candlestick is a long bullish candle, and the second candlestick is a small bearish candle; second
XRP-5.9%
View Original
post-image
  • Reward
  • Comment
  • Repost
  • Share
The core response to the long wick candles (with long upper wicks, long lower wicks, or double wicks) is not to focus on the wicks themselves, but to observe the position where the wicks appear + subsequent volume and price verification, to avoid being misled by "false breakouts/false support."

1. First, clarify the essence of "Long Wick Candle": a temporary imbalance in the long and short game.

A Long Wick Candle occurs when the price quickly spikes high (or dips low) within a certain period and then retreats (or rebounds), leaving a long shadow. It essentially means "one side temporarily
XRP-5.9%
View Original
post-image
  • Reward
  • Comment
  • Repost
  • Share
After a drop in the market and the appearance of a W bottom, it does not necessarily mean that it will rise.

The W bottom is a common reversal pattern, but it is merely a technical analysis signal and not an absolute guarantee of an upward trend. Its effectiveness needs to be assessed in conjunction with factors such as trading volume, neck line breakout conditions, and time cycles. If the trading volume does not significantly increase upon breaking the neck line, or if it fails to hold above the neck line after the breakout, it may be a false breakout, and the market may not necessarily ris
GUSD0.03%
View Original
post-image
  • Reward
  • Comment
  • Repost
  • Share
#RWA赛道,你押谁 The rise three-step strategy, also known as the rise three methods, is a bullish Candlestick pattern that requires attention to the following key morphological characteristics.

- The first Candlestick: It must be a large bullish or medium bullish candle, which reflects the current rise trend and indicates strong bullish strength, laying the foundation for subsequent price movements.

- The small Candlestick in the middle: After the first bullish candlestick, there will be a group of short real body candlesticks, ideally three, but it can also be two or slightly more. These small
GUSD0.03%
View Original
post-image
  • Reward
  • Comment
  • Repost
  • Share
#加密市场反弹 #SOL价格预测 #GUSD双重收益 Currently, there is the following favourable information regarding Bitcoin:

- Institutional investment plan promotion: Institutions such as SoftBank and Tether have announced plans to create a $3.6 billion investment vehicle, emulating Microstrategy's Bitcoin investment strategy, which will bring substantial incremental funds to Bitcoin.

- Futures basis and capital inflow favourable information: The recovery of US stocks has driven the Bitcoin futures basis to rise to around 10%, and the annualized level of futures premium has also risen to 9%-10%. At the sa
SOL-7.92%
GUSD0.03%
BTC-3.58%
View Original
  • Reward
  • Comment
  • Repost
  • Share
#加密市场反弹 During a pump in the market, the common bear trap patterns are as follows:

- Long upper shadow bear trap: During a pump, if a long upper shadow appears, and the closing price of the second candlestick is higher than the closing price of the long upper shadow, it may indicate a bear trap. In this pattern, the main force uses the long upper shadow to create the illusion that the stock price is facing resistance in its rise, attracting investors to sell their stocks, and then subsequently pulling the stock price up.

- Inverted T-Line Bear Trap: The characteristic of the inverted T-lin
SOL-7.92%
GUSD0.03%
View Original
  • Reward
  • Comment
  • Repost
  • Share
The trend pattern of the "guiding hand" in Candlestick consists of single Candlestick patterns and two Candlestick combination patterns, as follows:

- Single Candlestick Pattern: The body of the candlestick is relatively short, usually a small bullish or small bearish candle, the length of the upper shadow is generally more than twice that of the body, and the lower shadow may or may not exist; if there is a lower shadow, its length is also far shorter than that of the upper shadow.

- Two Candlestick combination patterns: The first Candlestick must meet the characteristics of the aforement
SOL-7.92%
GUSD0.03%
DOGE-6.11%
View Original
post-image
  • Reward
  • Comment
  • Repost
  • Share
#Gate Alpha晒单挑战 #山寨币市场回暖 #RWA 总规模持续增长
When large, medium, and small triangle patterns appear consecutively in the K-line, the subsequent market trend becomes relatively complex. It is necessary to comprehensively judge based on the specific type of triangle, the direction of the breakout, and factors such as trading volume. Below are several common triangle patterns and their possible trend analyses:

- Symmetrical Triangle: Typically a consolidation pattern that indicates the existing trend is temporarily in a rest phase, after which it will likely continue in the direction of the original
RWA-2%
View Original
post-image
  • Reward
  • Comment
  • Repost
  • Share
#Gate Alpha晒单挑战 There are many common reversal signals in Candlestick, here are some typical ones:

- Hammer and Hanging Man: Both have similar shapes, with small bodies and long lower shadows. The Hammer appears during a downtrend and is a bottom reversal signal, indicating strong support below; the Hanging Man appears during an uptrend and may be a top signal, suggesting significant selling pressure above.

- Engulfing Pattern: Consists of two candlestick bodies with opposite colors, where the body of the latter candlestick completely engulfs the body of the former. When it appears in a do
ONDO-6.62%
View Original
post-image
  • Reward
  • Comment
  • Repost
  • Share
As of September 7, 2025, the weekly trends of BTC and Ether both show a certain weakness. The following is a specific analysis:

- Bitcoin (BTC) [__LINK_ICON]: The Bitcoin price is $110,400. From a weekly perspective, it has fallen from a high of $124,545 over the past few weeks and has formed another bearish candle this week. The bearish candle closed with a lower shadow, indicating some support at 107,000, but the momentum is insufficient to reverse the situation. On the technical level, the MACD indicator has formed a death cross at a high position, and the histogram has turned green, whic
ONDO-6.62%
BTC-3.58%
ETH-5.48%
View Original
post-image
  • Reward
  • Comment
  • Repost
  • Share
#Gate Alpha晒单挑战 #Gate上线Ondo专区现货交易 #非农就业数据来袭 In addition to the previously mentioned Morning Star, Evening Star, and other combination patterns, common Candlestick combination patterns also include the following.

- Three Black Crows: Composed of three consecutive bearish candlesticks, each closing lower than the previous day's close. Typically appears at the beginning of a downtrend, indicating strong bearish momentum and a bearish outlook for the market.

- Bullish Engulfing: Composed of two bullish candlesticks surrounding one bearish candlestick. The closing prices of the two bullish
ONDO-6.62%
View Original
post-image
  • Reward
  • Comment
  • Repost
  • Share
To determine whether a unilateral downward trend is reversing, a comprehensive assessment must be made from four core dimensions: price patterns, Trading Volume, key positions, and indicator signals. A single signal is insufficient to confirm a reversal; multiple signals must resonate.

1. Price pattern: A clear reversal structure has appeared.

Reversal patterns are intuitive signals of market direction changes, commonly seen at the end of a downtrend:

- Bottom reversal patterns: such as "Hammer candlestick" "Morning Star" (small bearish/bullish candle + gap down + large bullish candle co
ONDO-6.62%
View Original
post-image
  • Reward
  • Comment
  • Repost
  • Share
In the Candlestick chart, when a fall engulfs the previous three candles, it is usually seen as a potential bearish signal, indicating that the market may experience a decline or adjustment.

This pattern is also known as "One Black Engulfs Three Whites," which refers to a candlestick with a body that completely covers the bodies of the previous three bullish candlesticks. It indicates that the upward momentum in the market may be weakening, and sellers are beginning to dominate the market.

However, "one bearish candle engulfs three bullish candles" is not an absolute reversal signal and ne
ONDO-6.62%
View Original
post-image
  • Reward
  • 1
  • Repost
  • Share
RecoupingLossesFromFoodAndvip:
To summarize, is it a rise or a fall?
  • Trending TopicsView More
  • Pin
Trade Crypto Anywhere Anytime
qrCode
Scan to download Gate App
Community
English
  • 简体中文
  • English
  • Tiếng Việt
  • 繁體中文
  • Español
  • Русский
  • Français (Afrique)
  • Português (Portugal)
  • Bahasa Indonesia
  • 日本語
  • بالعربية
  • Українська
  • Português (Brasil)