Trade
Trading Type
Spot
Trade crypto freely
Alpha
Points
Get promising tokens in streamlined on-chain trading
Pre-Market
Trade new tokens before they are officially listed
Margin
Magnify your profit with leverage
Convert & Block Trading
0 Fees
Trade any size with no fees and no slippage
Leveraged Tokens
Get exposure to leveraged positions simply
Futures
Futures
Hundreds of contracts settled in USDT or BTC
Options
HOT
Trade European-style vanilla options
Unified Account
Maximize your capital efficiency
Demo Trading
Futures Kickoff
Get prepared for your futures trading
Futures Events
Participate in events to win generous rewards
Demo Trading
Use virtual funds to experience risk-free trading
Earn
Launch
Investment
Simple Earn
VIP
Earn interests with idle tokens
Auto-Invest
Auto-invest on a regular basis
Dual Investment
Buy low and sell high to take profits from price fluctuations
Quant Fund
VIP
Top asset management team helps you profit without hassle
Crypto Loan
0 Fees
Pledge one crypto to borrow another
Lending Center
One-Stop Lending Hub
VIP Wealth Hub
New
Customized wealth management empowers your assets growth
Staking
Stake cryptos to earn in PoS products
BTC Staking
HOT
Stake BTC and earn 10% APR
ETH Staking
HOT
Stake ETH and earn 10% APR
GUSD Minting
New
Use USDT/USDC to mint GUSD for treasury-level yields
Soft Staking
Earn rewards with flexible staking
More


ALPHABrotherHai
Ride with the trend, accompany with profit.
ALPHABrotherHai
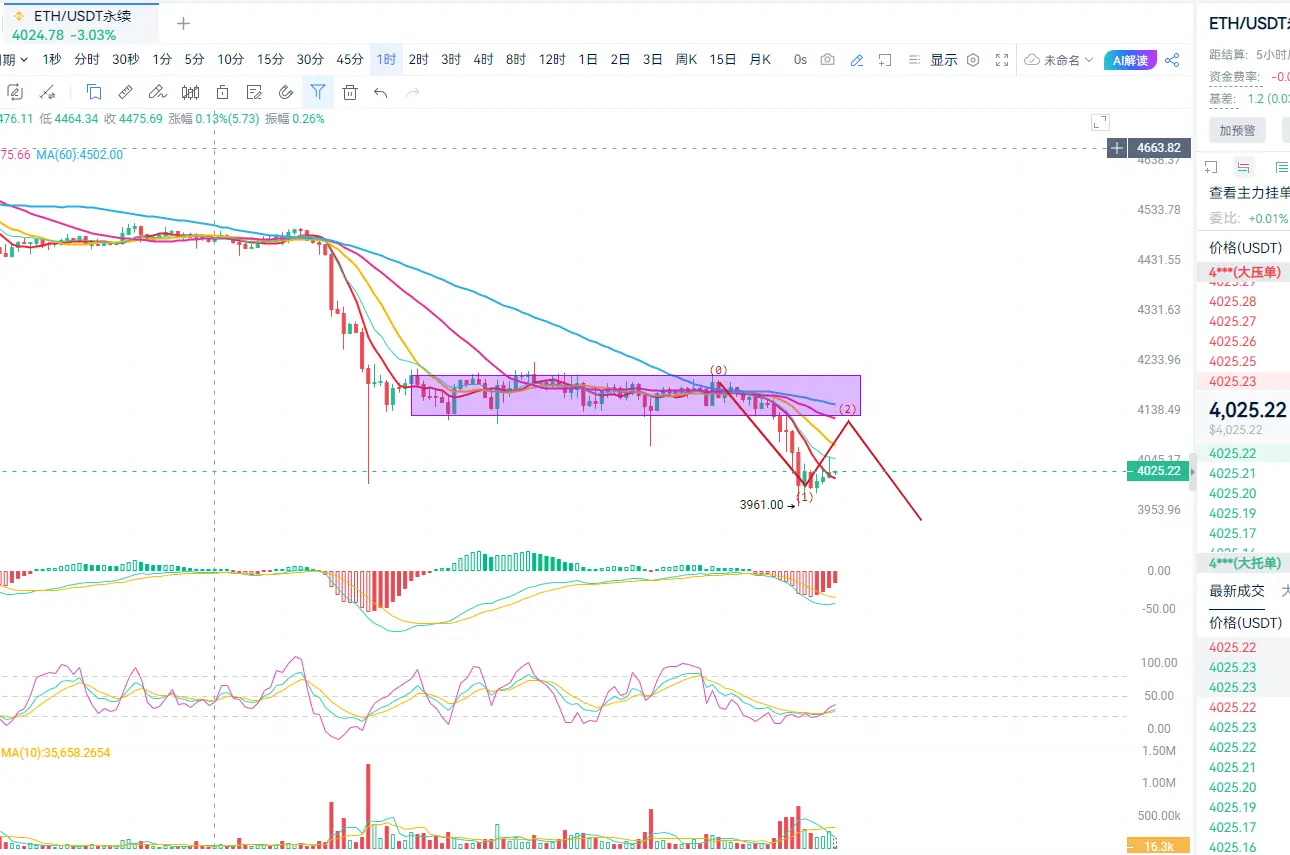
ETH Trend Analysis
Summary: After ETH broke the range during the day, it accelerated its decline, dropping to around 3960 at the lowest. On the 15M, 30M, and 1-hour levels, a bullish divergence has formed. After a stop in the small cycle, there is a demand for a rebound. For those wanting to play short-term long positions, this is an opportunity to enter. From the 4-hour level perspective, ETH still has one wave of downward movement that is not completed. After a rebound in the evening, it will follow through with an unfinished wave of decline.
Evening Strategy: Short near ETH 4130, target 400
ETH-1.82%
- Reward
- 2
- 1
- Repost
- Share
REDOY :
:
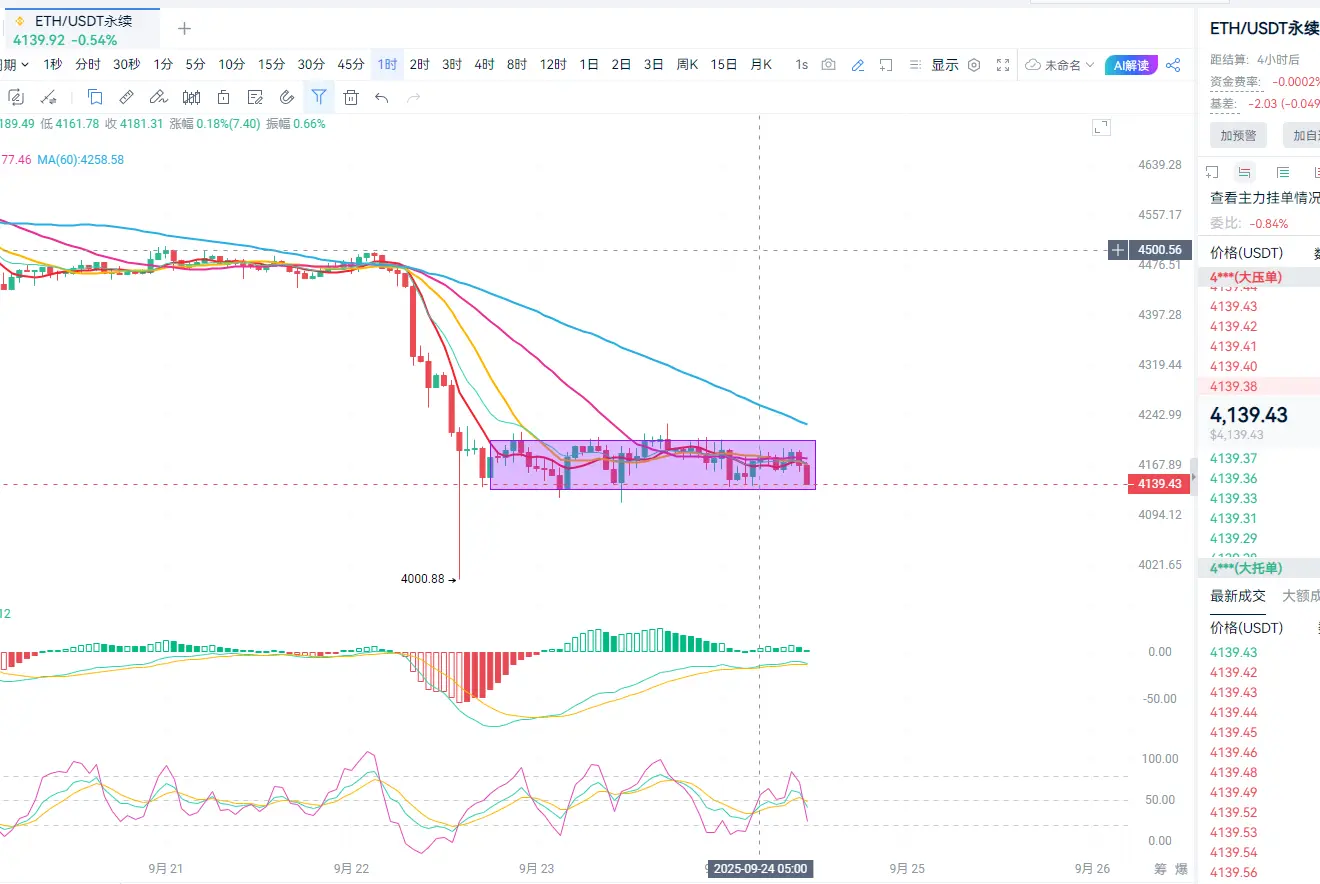
DYOR 🤓ETH continues the trend from yesterday, continuing to build a falling center, with a fluctuating range of 4130-4200. Buy low, sell high within the range, and follow the trend if the range is broken. # #ETH# ETH trend analysis Morning strategy Short near 4200, target 4130. If it breaks below 4130, short with a target of 4000 and 3800.
ETH-1.82%
- Reward
- like
- 2
- Repost
- Share
WhenWillTheSpringBreezeCome :
:
fall belowView More
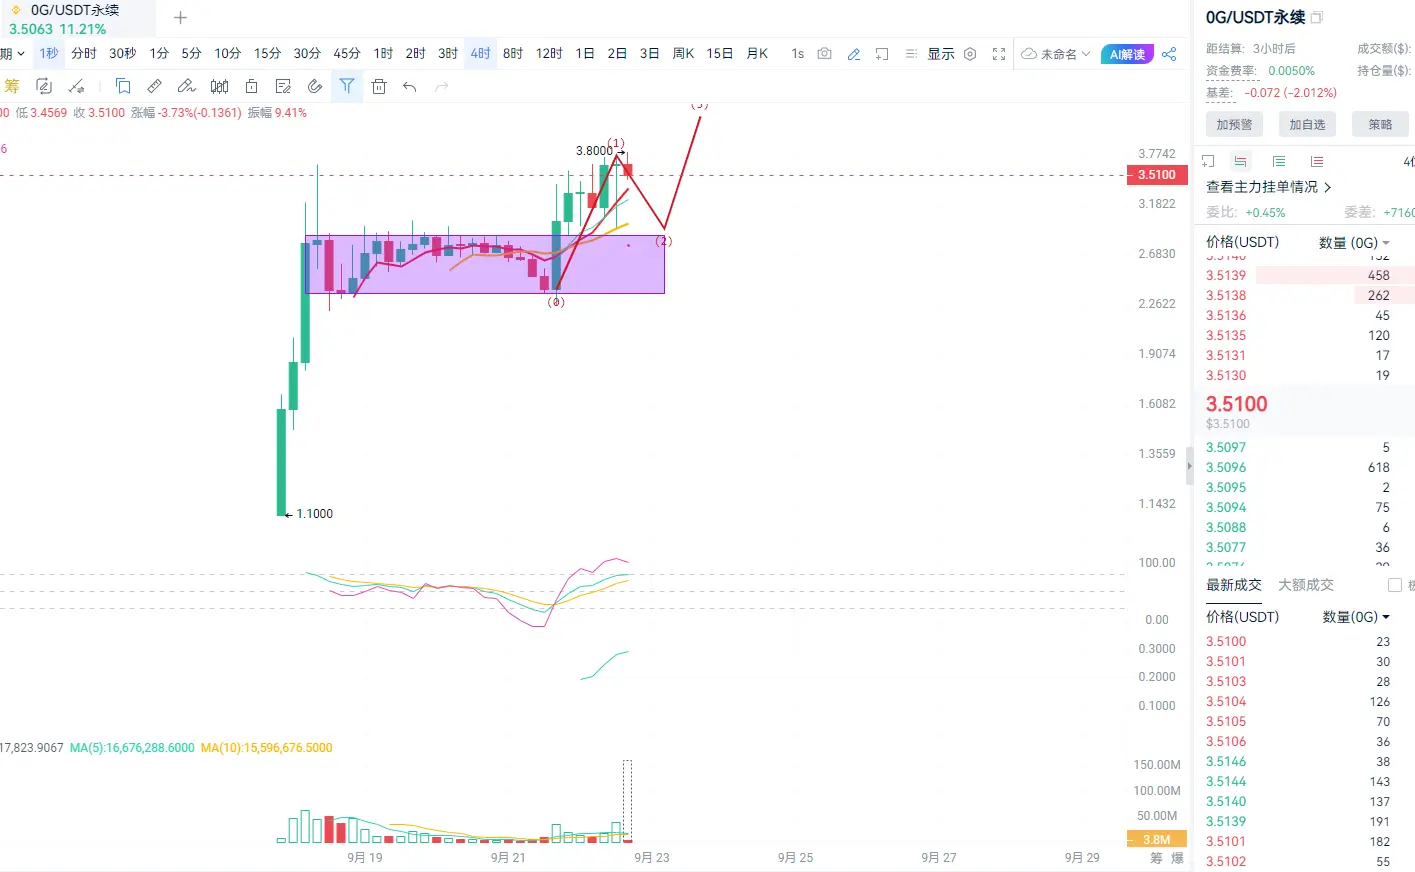
0G is the largest first-layer blockchain network designed specifically for artificial intelligence. Its decentralized AI operating system offers unparalleled performance, achieving completely transparent, privacy-protected, verifiable, and community-governed secure AI, with operational costs reduced by 90% compared to centralized black box systems. The ALPHA Airdrop is ongoing, and those who meet the points criteria can receive 20, with expectations for the market to reach around 6 in the future.
Spot Strategy
0G 3 (Conditional Order) Ambush Entry
Expected Target 6 #0g#
Spot Strategy
0G 3 (Conditional Order) Ambush Entry
Expected Target 6 #0g#
0G-6.2%
- Reward
- 2
- 2
- Repost
- Share
Erca12:
Bull Run 🐂View More
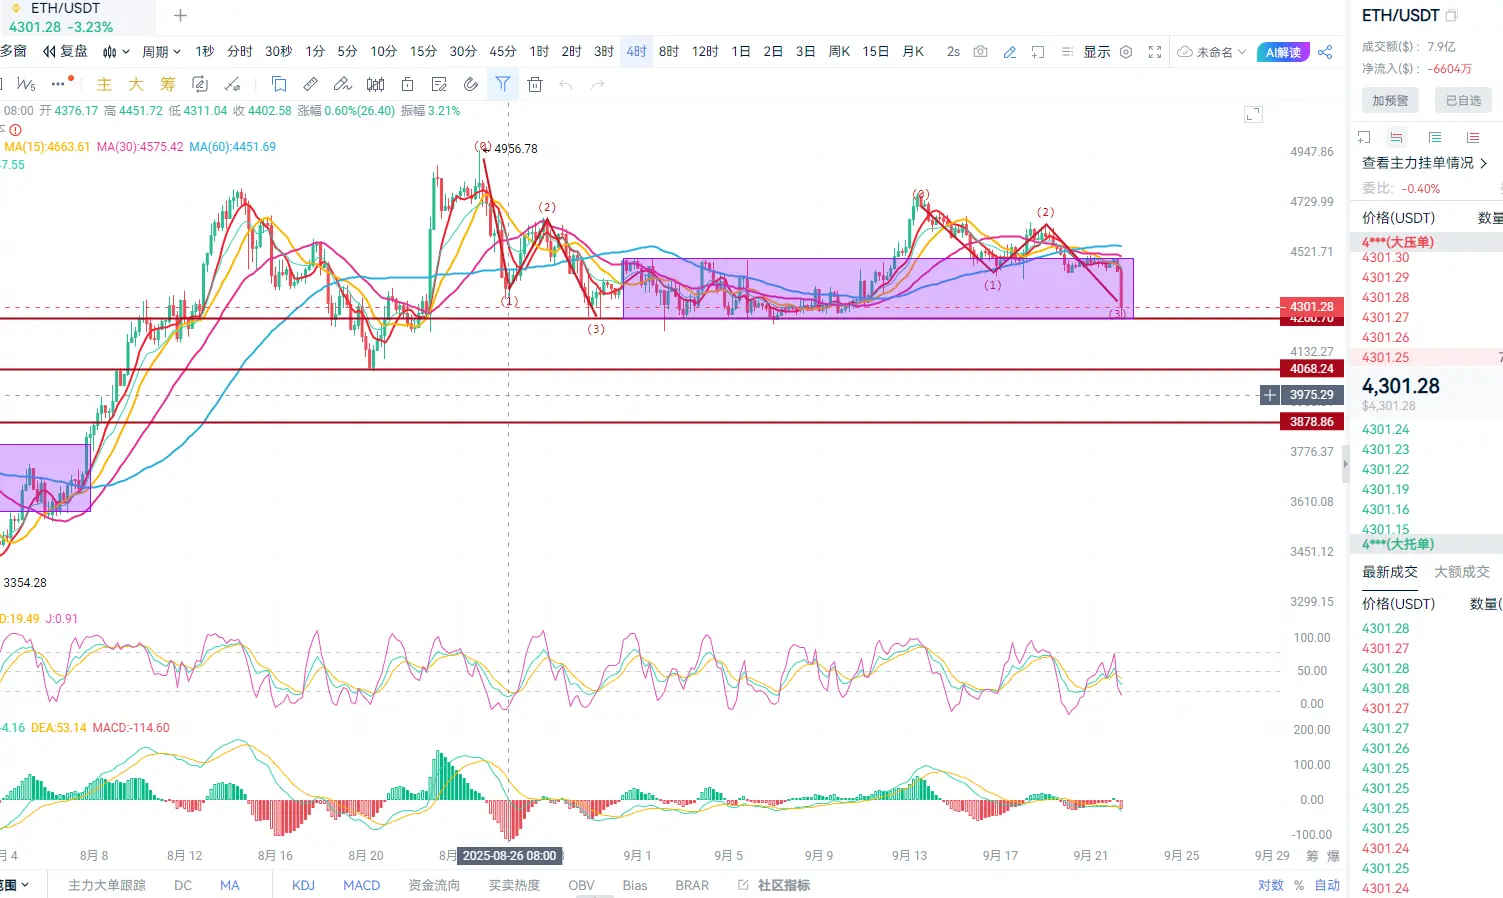
The direction of ETH on the 4-hour cycle has come out, with a bearish belt hold fall, dropping from 4450 to 4260. The rapid fall has opened up space below, following the support point of 4260. If it breaks below, the target will be 4060. If 4260 holds, the market will continue to oscillate in the range of 4260-4480. Strategy 1:
Short position near 4450, target 4260
Long positions near 4260, target 4450
Strategy 2: Follow the trend to short below 4260, target 4060 3800
#ETH#
Short position near 4450, target 4260
Long positions near 4260, target 4450
Strategy 2: Follow the trend to short below 4260, target 4060 3800
#ETH#
ETH-1.82%
- Reward
- like
- Comment
- Repost
- Share
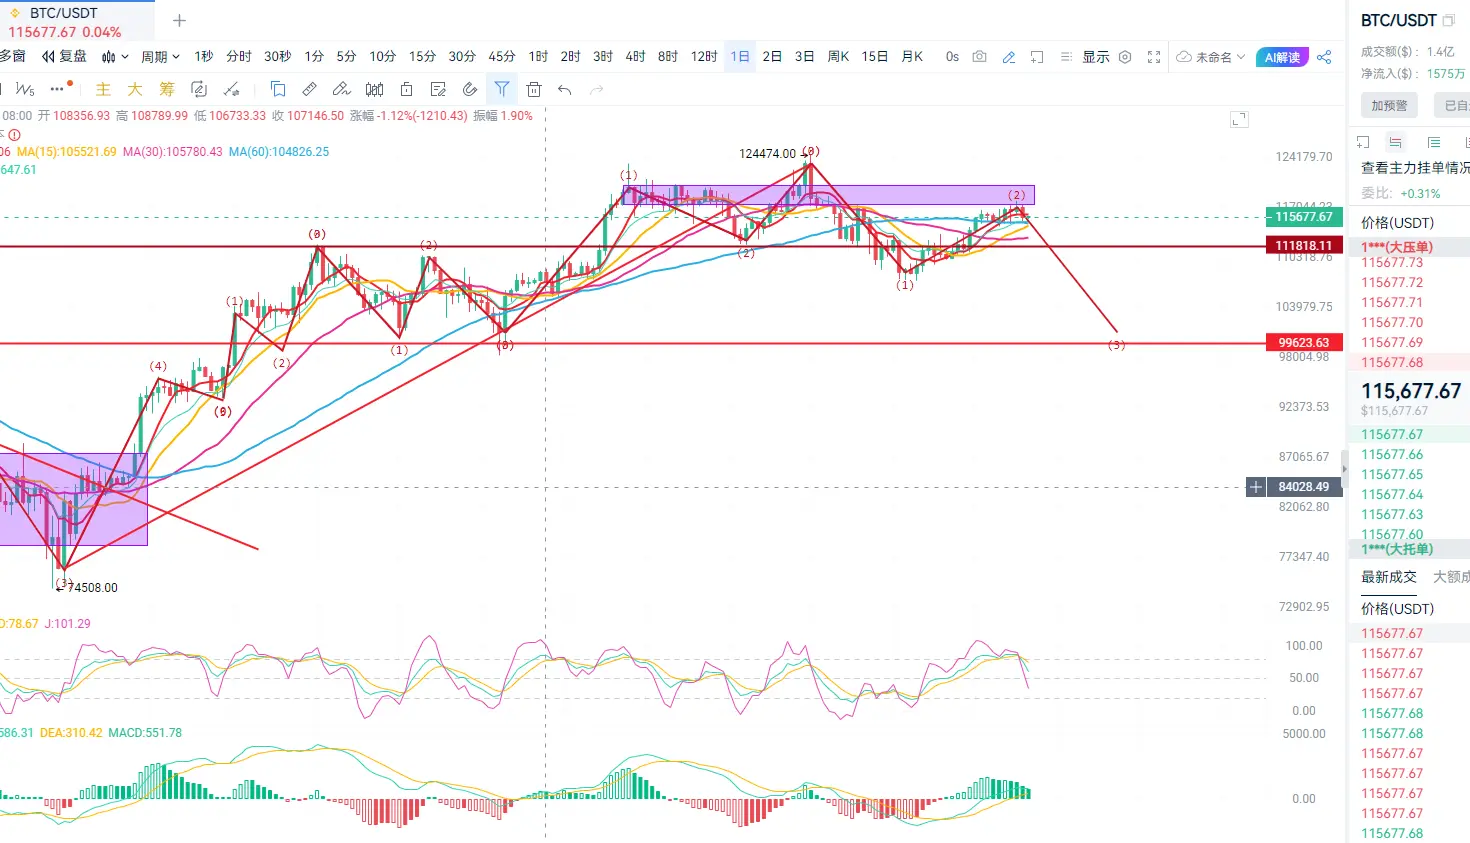
The total net inflow of Bitcoin Spot ETFs is 223 million USD. The Bitcoin Spot ETF with the highest net inflow yesterday was Blackrock ( ETF IBIT, with a single-day net inflow of 246 million USD, and the historical total net inflow for IBIT has reached 60.645 billion USD. The Bitcoin Spot ETF with the highest net outflow yesterday was Grayscale ) ETF GBTC, with a single-day net outflow of 23.4955 million USD, and the historical total net outflow for GBTC has reached 24.079 billion USD.
As of the time of writing, the total net asset value of the Bitcoin Spot ETF is $152.306 billion, with an ETF
As of the time of writing, the total net asset value of the Bitcoin Spot ETF is $152.306 billion, with an ETF
BTC-2.08%
- Reward
- 1
- 1
- Repost
- Share
REDOY:
Bull Run 🐂W has just broken through the previous pressure point, opening up space above, with opportunities around 0.17 and 0.2 in the future. Currently at 0.126, it is worth following as a Spot allocation. #w#
View Original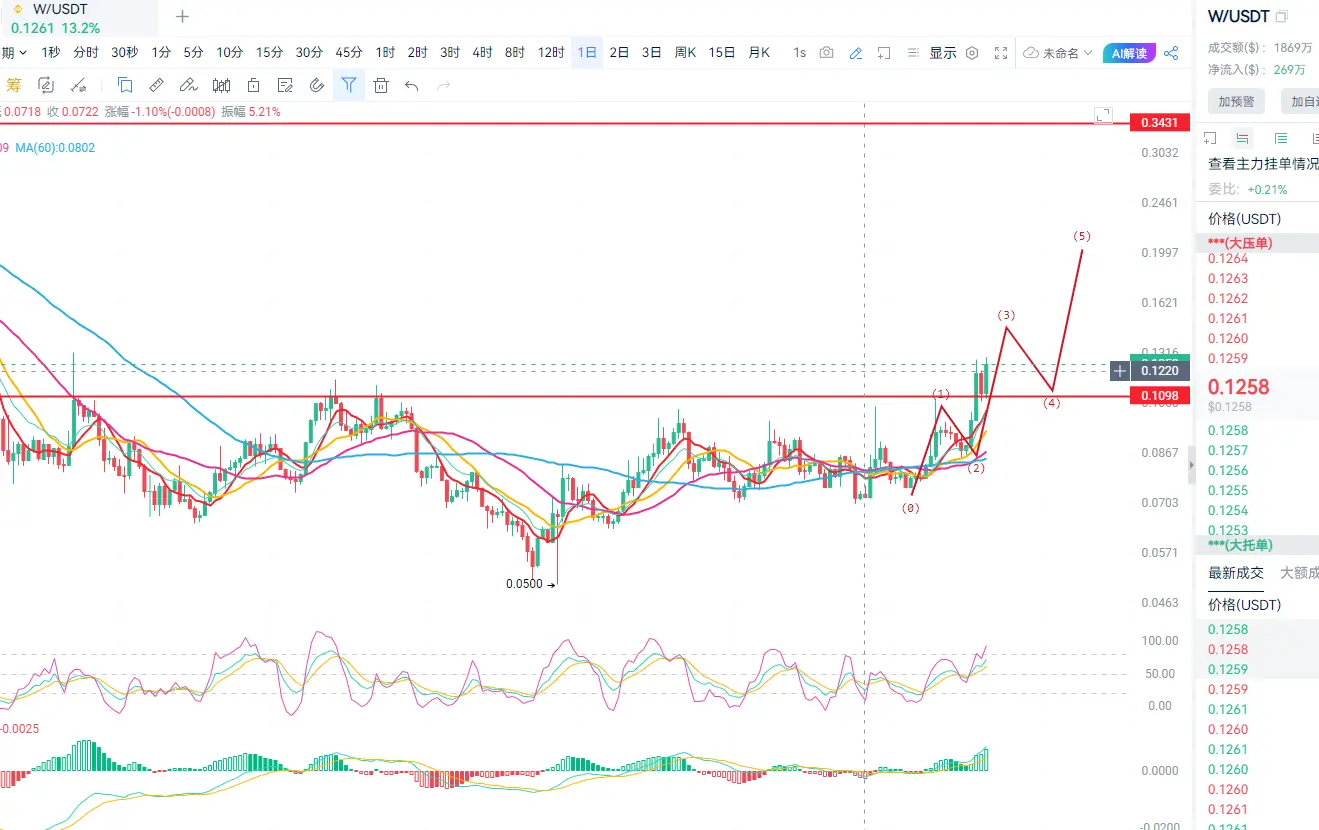
- Reward
- like
- 1
- Repost
- Share
Muhamadmuhidin :
:
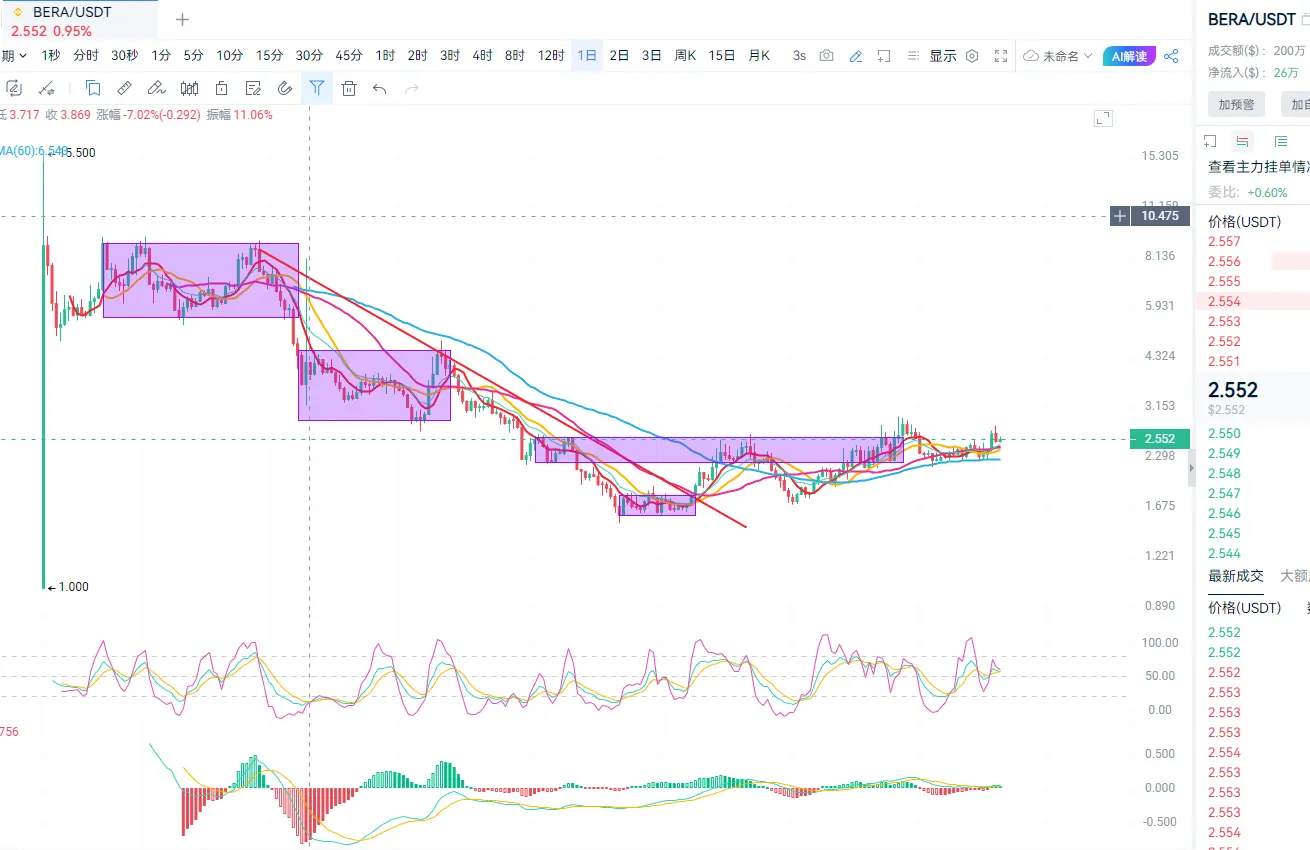
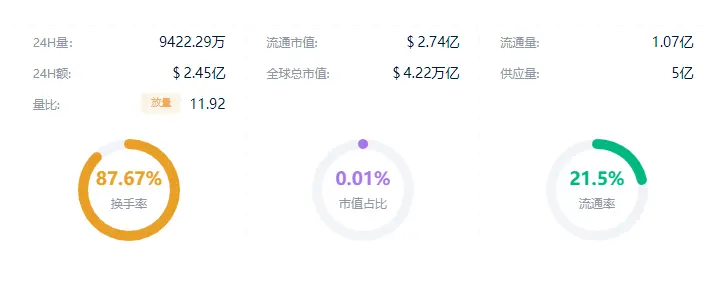
I want to ask if this coin is different from w coin?I recommend the Spot BERA. As a public chain that just launched this year, it has significant potential. The daily chart shows a low-level sideways fluctuation and consolidation, with obvious accumulation by the market maker. The current price is around 2.5, and it could start moving at any time, with expectations to reach around 5 in the future. It's worth following. #bera#
BERA-4.86%
- Reward
- like
- 1
- Repost
- Share
HelloKunBrother:
What is the contract 地址?Price Trend Analysis
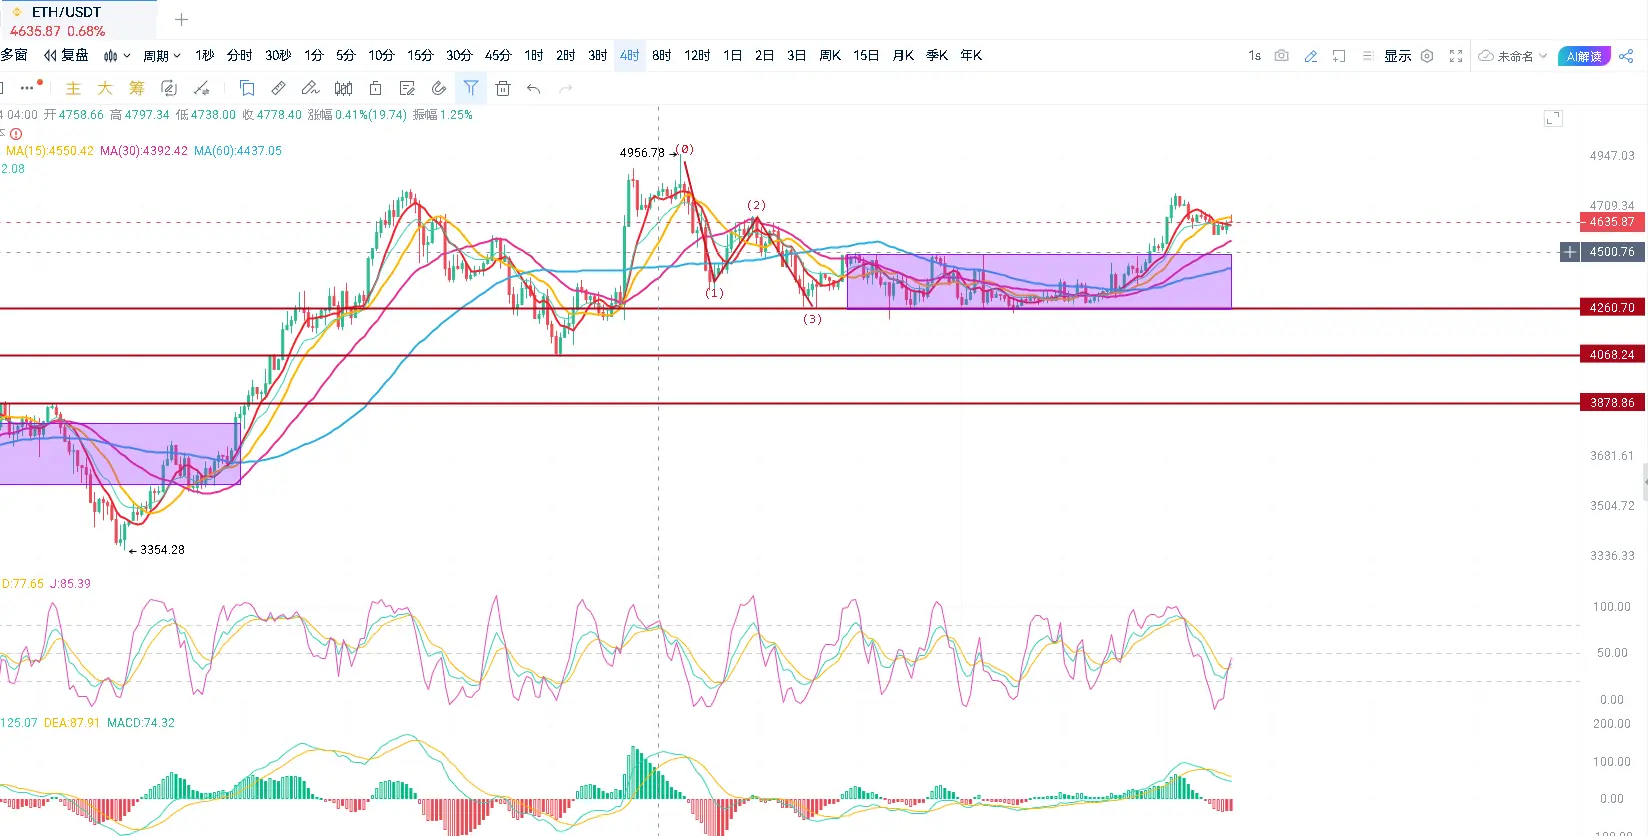
Conclusion: ETH is forming a central consolidation in the 4-hour cycle, waiting for the direction selection in the future market, with a fluctuation range of 4450-4650.
K-line patterns:
1-hour level: Recently oscillating in the 4500-4550 range, with 4557.67 forming a short-term resistance level and 4464 constituting key support. After a long lower shadow (4430.59) appeared at 9 PM on the 16th, a rebound occurred, indicating buyer intervention.
Daily level: After the significant breakout on September 12, there has been a continuous 3-day pullback testing the 4500 integer le
ETH-1.82%
- Reward
- 1
- 1
- Repost
- Share
GateUser-fd8e740f:
Quick, enter a position! 🚗Price Trend Analysis
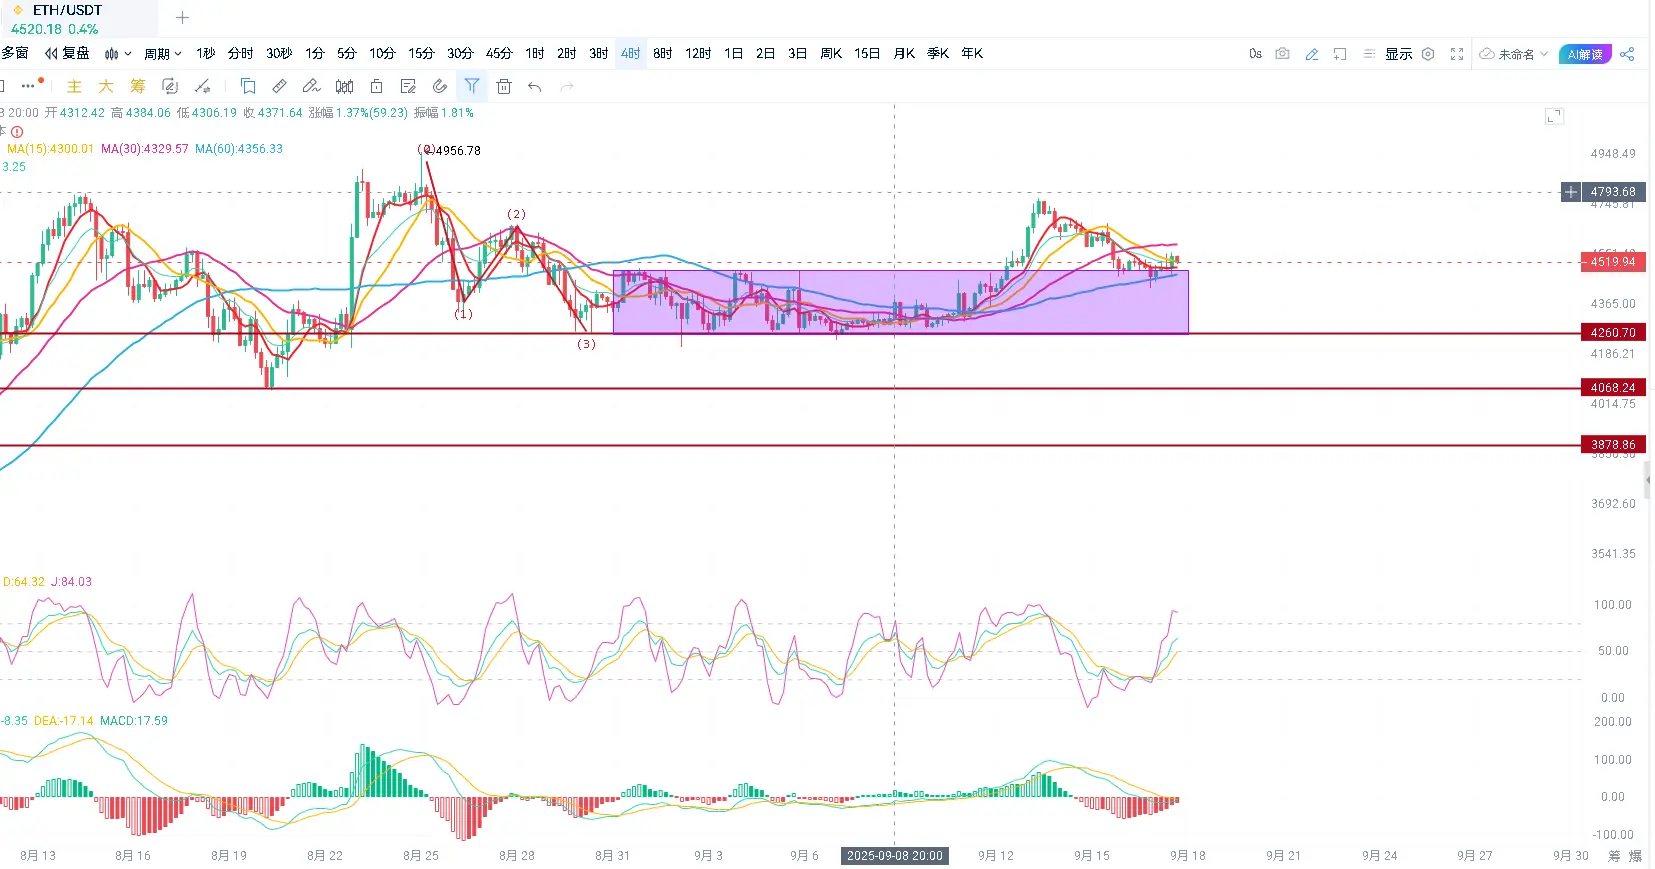
Conclusion: ETH is consolidating in a sideways adjustment on the 4-hour timeframe, with a fluctuation range of 4550-4750.
K-line pattern:
A double top pattern has appeared on the 1-hour level (around 4670). The recent high of 4670.28 failed to break the previous high of 4692.36, forming short-term resistance. On the daily level, there have been three consecutive days of long lower shadows (4576-4637), indicating strong buying below 4600, but there is significant selling pressure at the round number of 4700 above.
Technical Indicators:
MACD: The 1-hour level DIF crosses abo
ETH-1.82%
- Reward
- 1
- Comment
- Repost
- Share
Price Trend Analysis
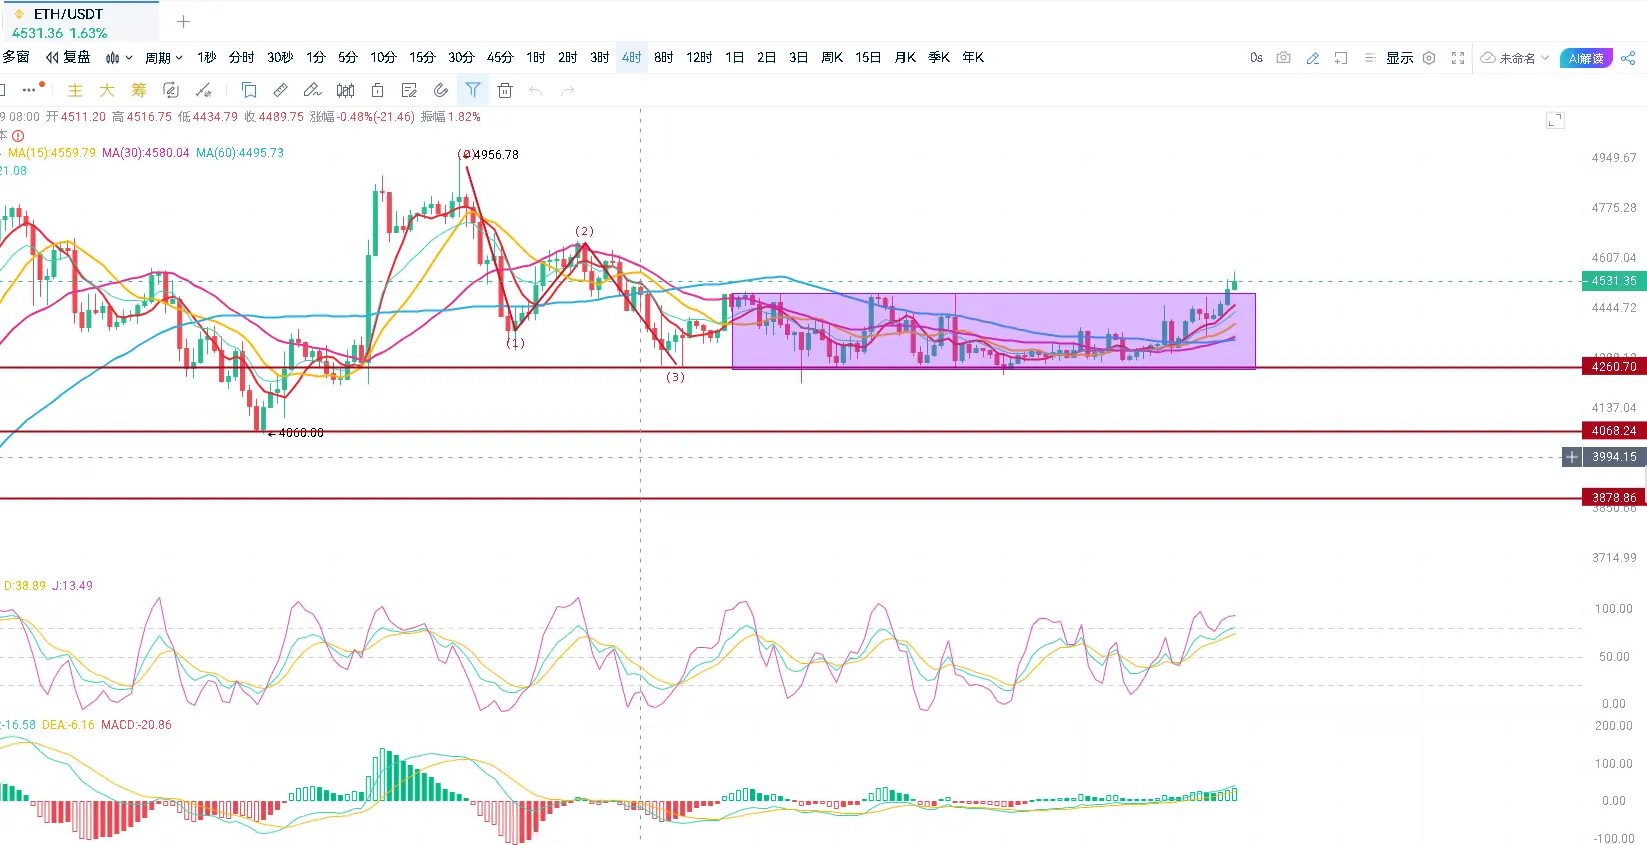
Conclusion: ETH 4-hour cycle trend is upward, focusing on 4650, 4750, 4850 above.
K-line patterns:
Recently, a double top structure has formed at the 1-hour level (4563 and 4551.97), and the current price has fallen below the 4535 support level.
The daily chart shows an upward channel, but the long upper shadow on September 12 indicates strong selling pressure in the 4600 area.
Technical Indicators:
MACD: 1-hour DIF ( 37.52) and DEA ( 30.66) show signs of a death cross, indicating a weakening bullish momentum; the daily MACD ( -17.83) histogram is contracting but remains b
ETH-1.82%
- Reward
- 1
- 3
- Repost
- Share
REDOY:
HODL Tight 💪View More
Price Trend Analysis
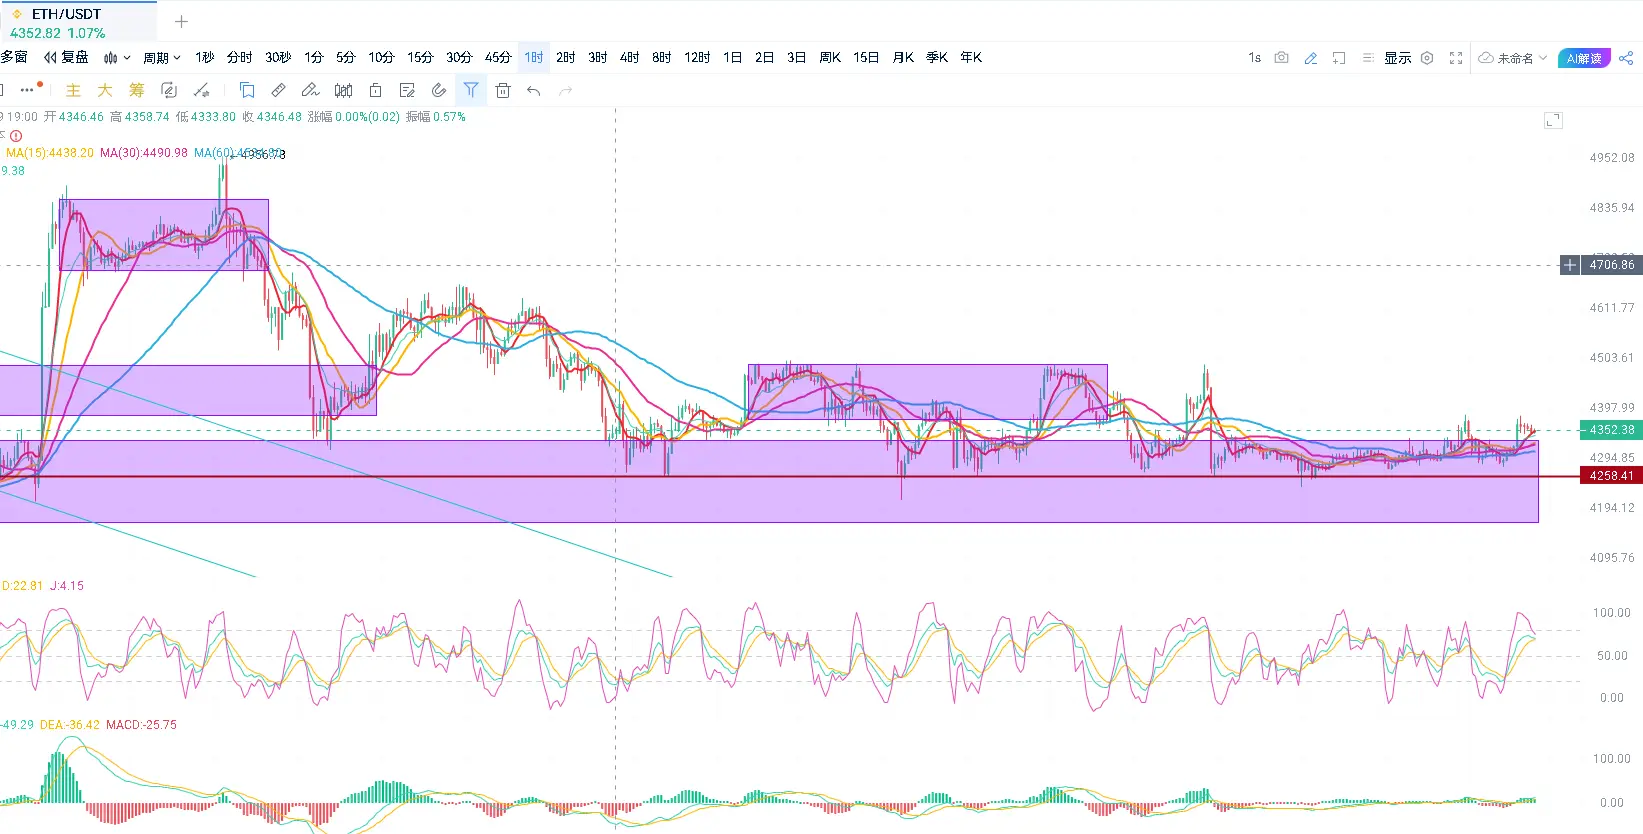
Conclusion: ETH is experiencing an upward oscillation in the hourly cycle, with a fluctuation range of 4300-4500. Within this range, one should sell high and buy low, and follow the trend if the range is broken.
K-line pattern:
Recently, a "double top" pattern has appeared on the 1-hour chart, forming a clear resistance zone in the 4365-4380 area.
The daily chart shows high-level volatility, with strong resistance at the 4500 psychological level.
Technical Indicators:
MACD: The 1-hour level DIF (11.50) has crossed below DEA (7.50), and the red momentum bars are expanding,
ETH-1.82%
- Reward
- 8
- 2
- Repost
- Share
BuyAnythingAndGetRich.:
Just go for it💪View More
- Reward
- like
- Comment
- Repost
- Share
Price Trend Analysis
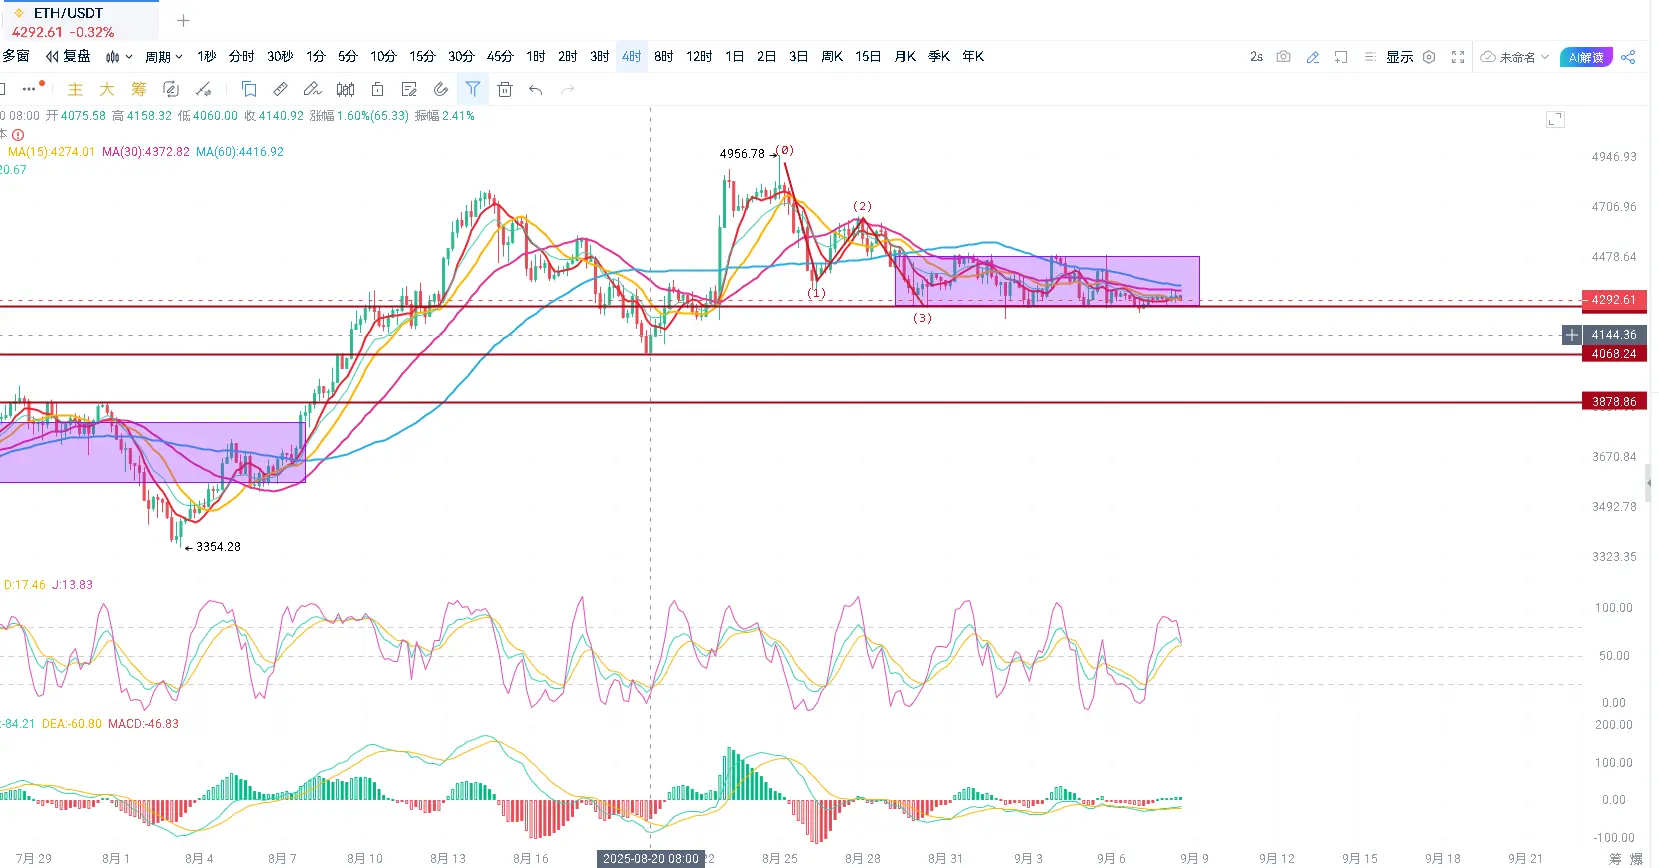
Conclusion: ETH continues to build a downward center on the 4-hour chart, with a fluctuation range of 4200-4360.
K-line pattern:
1-hour level: Recently formed a double top structure, with highs at 4336.02 and 4330.97. The current price is oscillating in the 4290-4300 range and has not been able to break through the previous highs.
Daily level: After peaking at 4336 on September 7, it fell back, forming a long upper shadow, indicating strong selling pressure above 4300. The low point of 4256 on September 5 and the low point of 4270 on September 7 constitute short-term suppo
ETH-1.82%
Price Trend Analysis
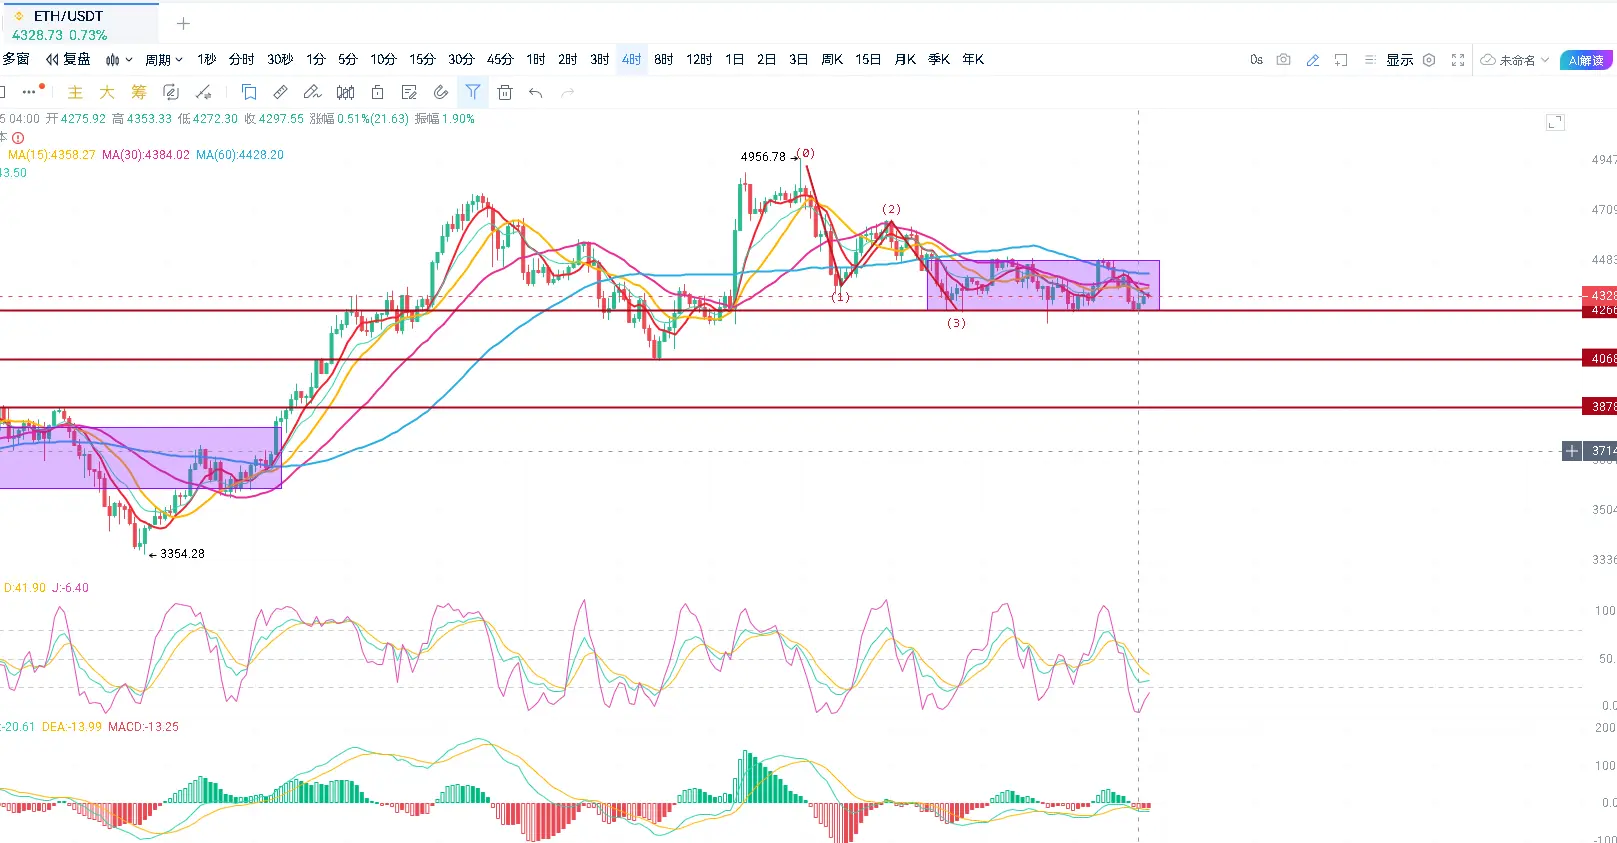
Conclusion: ETH 4-hour cycle continues to build a central area, with a fluctuation range of 4200-4500. Within the range, sell high and buy low; if the range is broken, follow the trend.
K-line patterns:
1-hour level: Recently formed a double bottom structure (4291.02/4295.93), current price has broken through the neckline at 4330 and is pulling back to EMA7 (4326.58).
Daily level: After the long bearish candle from the previous day (4482.05-4265.33), a hammer candle appeared, and yesterday's close confirmed a short-term stop-loss signal.
Technical indicators:
MACD: 1-h
ETH-1.82%
- Reward
- 2
- Comment
- Repost
- Share
Price Trend Analysis
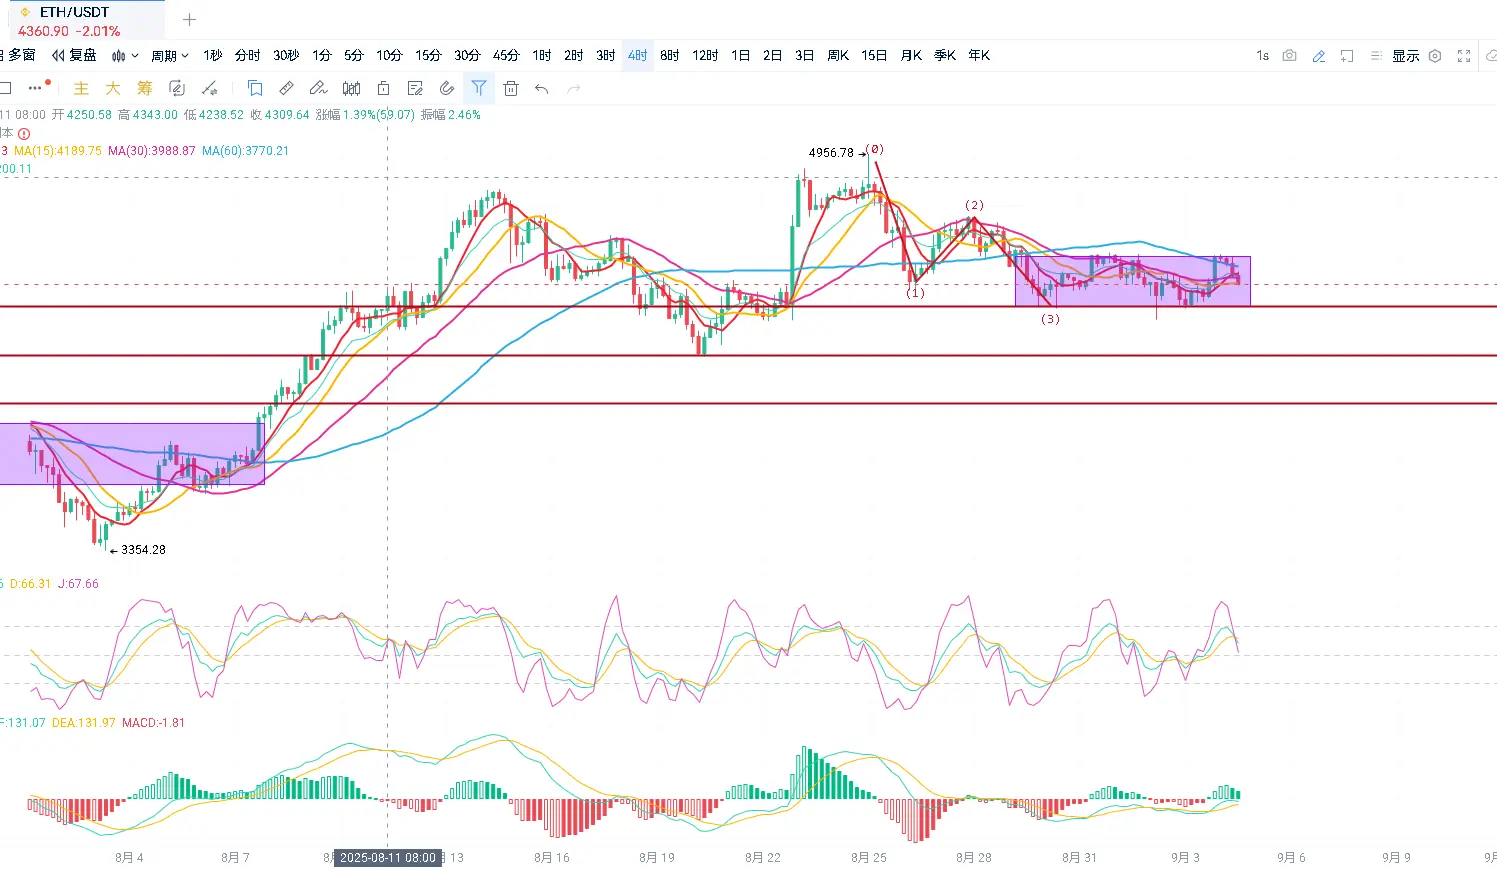
Conclusion: ETH is continuing to build a central point in the hourly period, with a range of 4200-4500, and the intraday trend is weak.
K-line patterns:
The 1-hour EMA7 has crossed below EMA30, forming a death cross, indicating a weakening short-term trend. The daily EMA30 (4280) and EMA120 (3439) maintain a bullish arrangement, but the short-term pullback is evident as the key integer support at 4350 was briefly broken before rebounding, showing that there is buying interest at this level.
Technical indicators:
MACD: The 1-hour level DIF (4.66) crosses below DEA (19.59),
ETH-1.82%
- Reward
- like
- 1
- Repost
- Share
GateUser-4990f8f3:
Just go for it💪Candlestick Patterns:
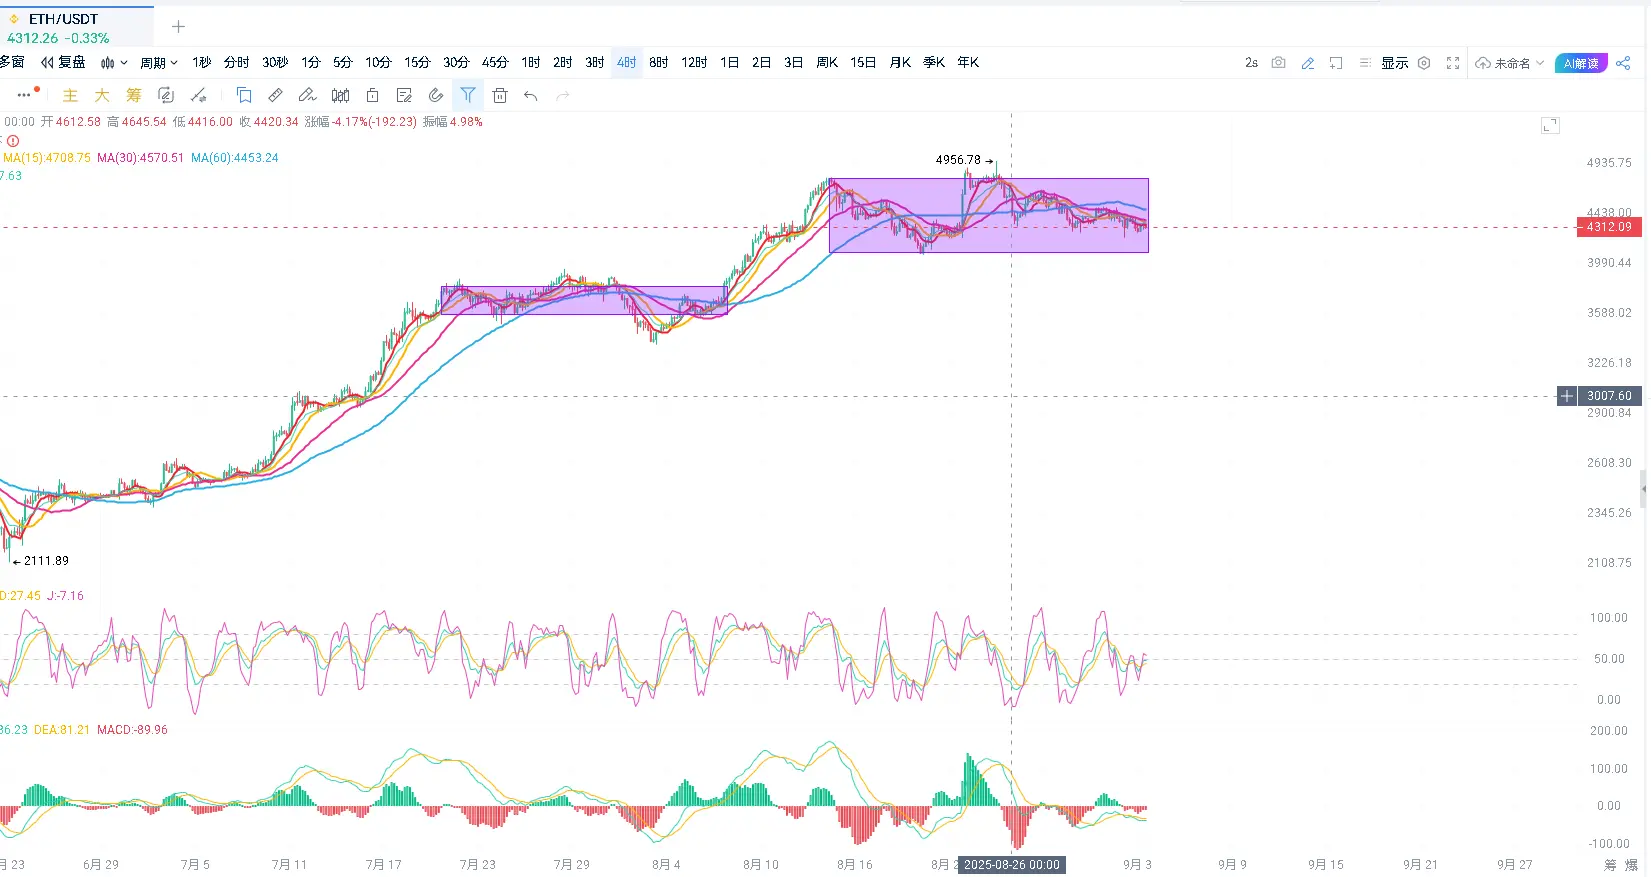
1-hour level: A double top pattern has recently formed (4343.46 and 4340.75), and the current price has broken below the neck line at 4313, with a low test of 4291.19. At the 4-hour level, a long lower shadow has appeared (4266.31-4327.93), indicating strong support in the 4250-4270 area.
Daily level: From August 26 to September 2, an ascending wedge (4633-4210) was formed, and currently, it is oscillating at the lower edge of the wedge. The monthly chart shows a shooting star (4491-4210), with significant selling pressure at high positions.
Technical Indicators:
MACD: Th
ETH-1.82%
- Reward
- 2
- 2
- Repost
- Share
Amarillo:
more details 🙂View More
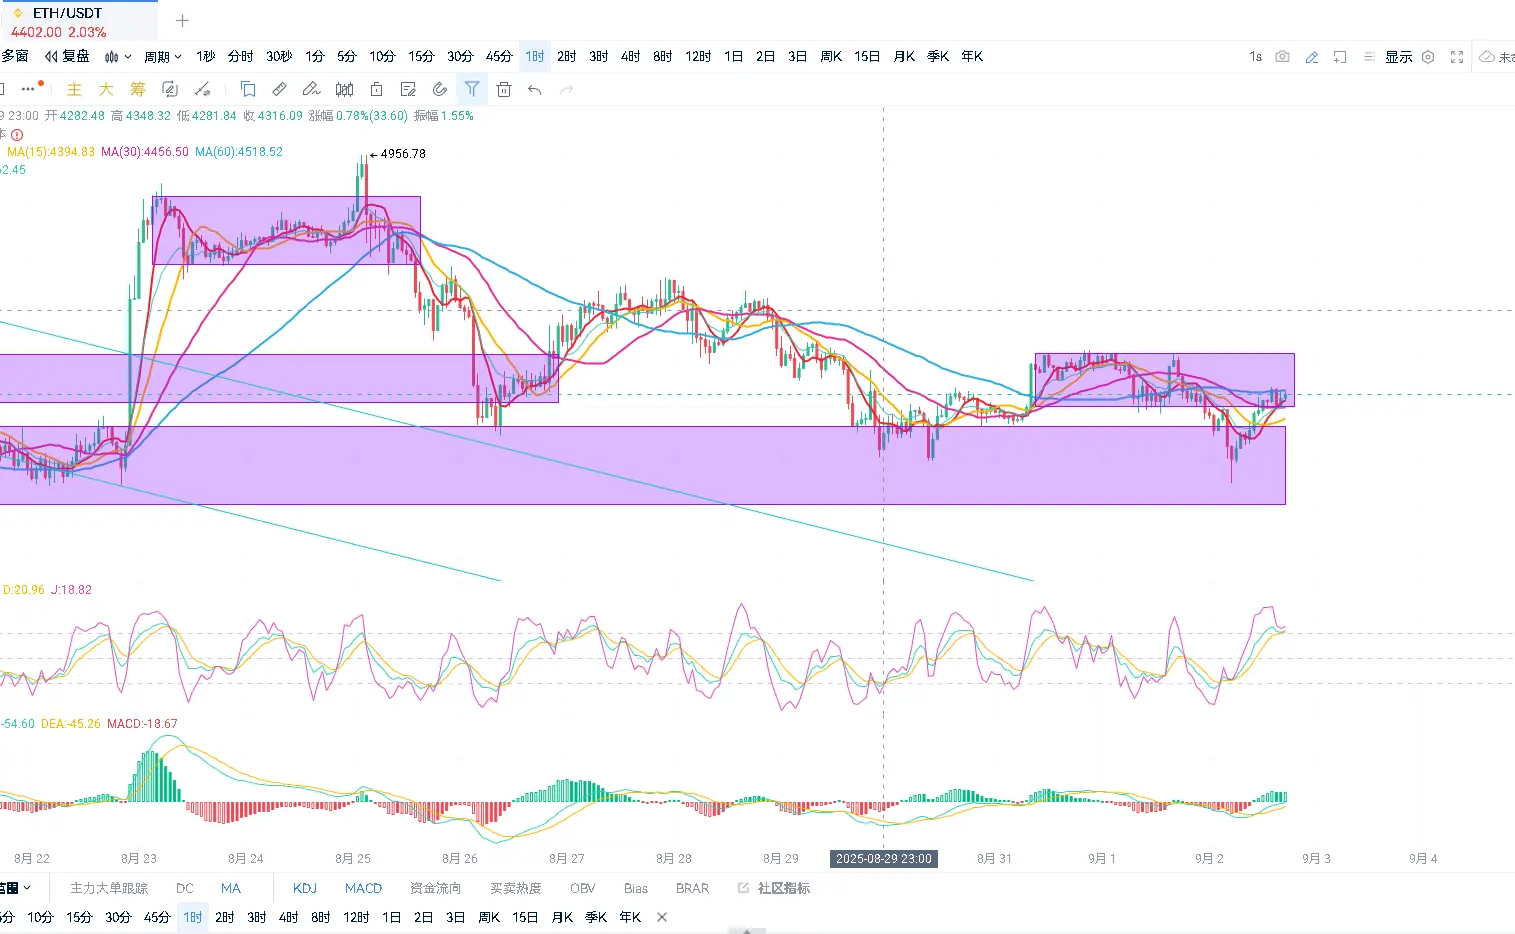
Price Trend Analysis
Conclusion: In the ETH hourly cycle, it is fluctuating upward. Pay attention to the resistance level at 4500 above, which, if not broken, indicates a short position. This was discussed in the morning live broadcast. Today, we are looking for a rebound, and the first target of 4400 has been reached. Next, pay attention to the resistance point at 4500, which is also the second target.
K-line patterns:
The 1-hour level has formed a double bottom (4252.31/4210.61) in the last 24 hours. After breaking through the neckline at 4360 today, it accelerated upward, and the daily line
ETH-1.82%
- Reward
- 1
- Comment
- Repost
- Share