Scan to Download Gate App
qrCode
More Download Options
Don't remind me again today
KatyPaty
vip
DeFi Analyst
Futures Trading Strategist
I'm your go-to for Airdrop insights, streaming the latest in blockchain. Join my content journey for engaging crypto discussions and opportunities.
Pin
  • Reward
  • 35
  • Repost
  • Share
ROCKSTAR99vip:
Bull Run 🐂
View More
GM, everyone! Happy Sunday and welcome to my live broadcast
post-image
  • Reward
  • 15
  • Repost
  • Share
Ybaservip:
Ape In 🚀
View More
$NEAR shows signs of recovery. Possibly the last chance to buy the dip?
Here's what we see on the NEAR/USDT chart:
📈 The technical picture looks promising:
· Breakout and hold above the Bollinger Bands: The price confidently broke through the middle Bollinger line (2.231) and is now testing it as new support. The next key target is the upper band (2.717).
· MACD is turning around: The MACD histogram has become positive (+0.087), and the fast line (DIF) is preparing for a bullish crossover with the slow line (DEA). This is a classic signal of sentiment shift.
· RSI in the neutral zone: RSI (
NEAR5.86%
View Original
  • Reward
  • 14
  • Repost
  • Share
CHAITHUvip:
thank you for the information
View More
#PostToWinTRUST
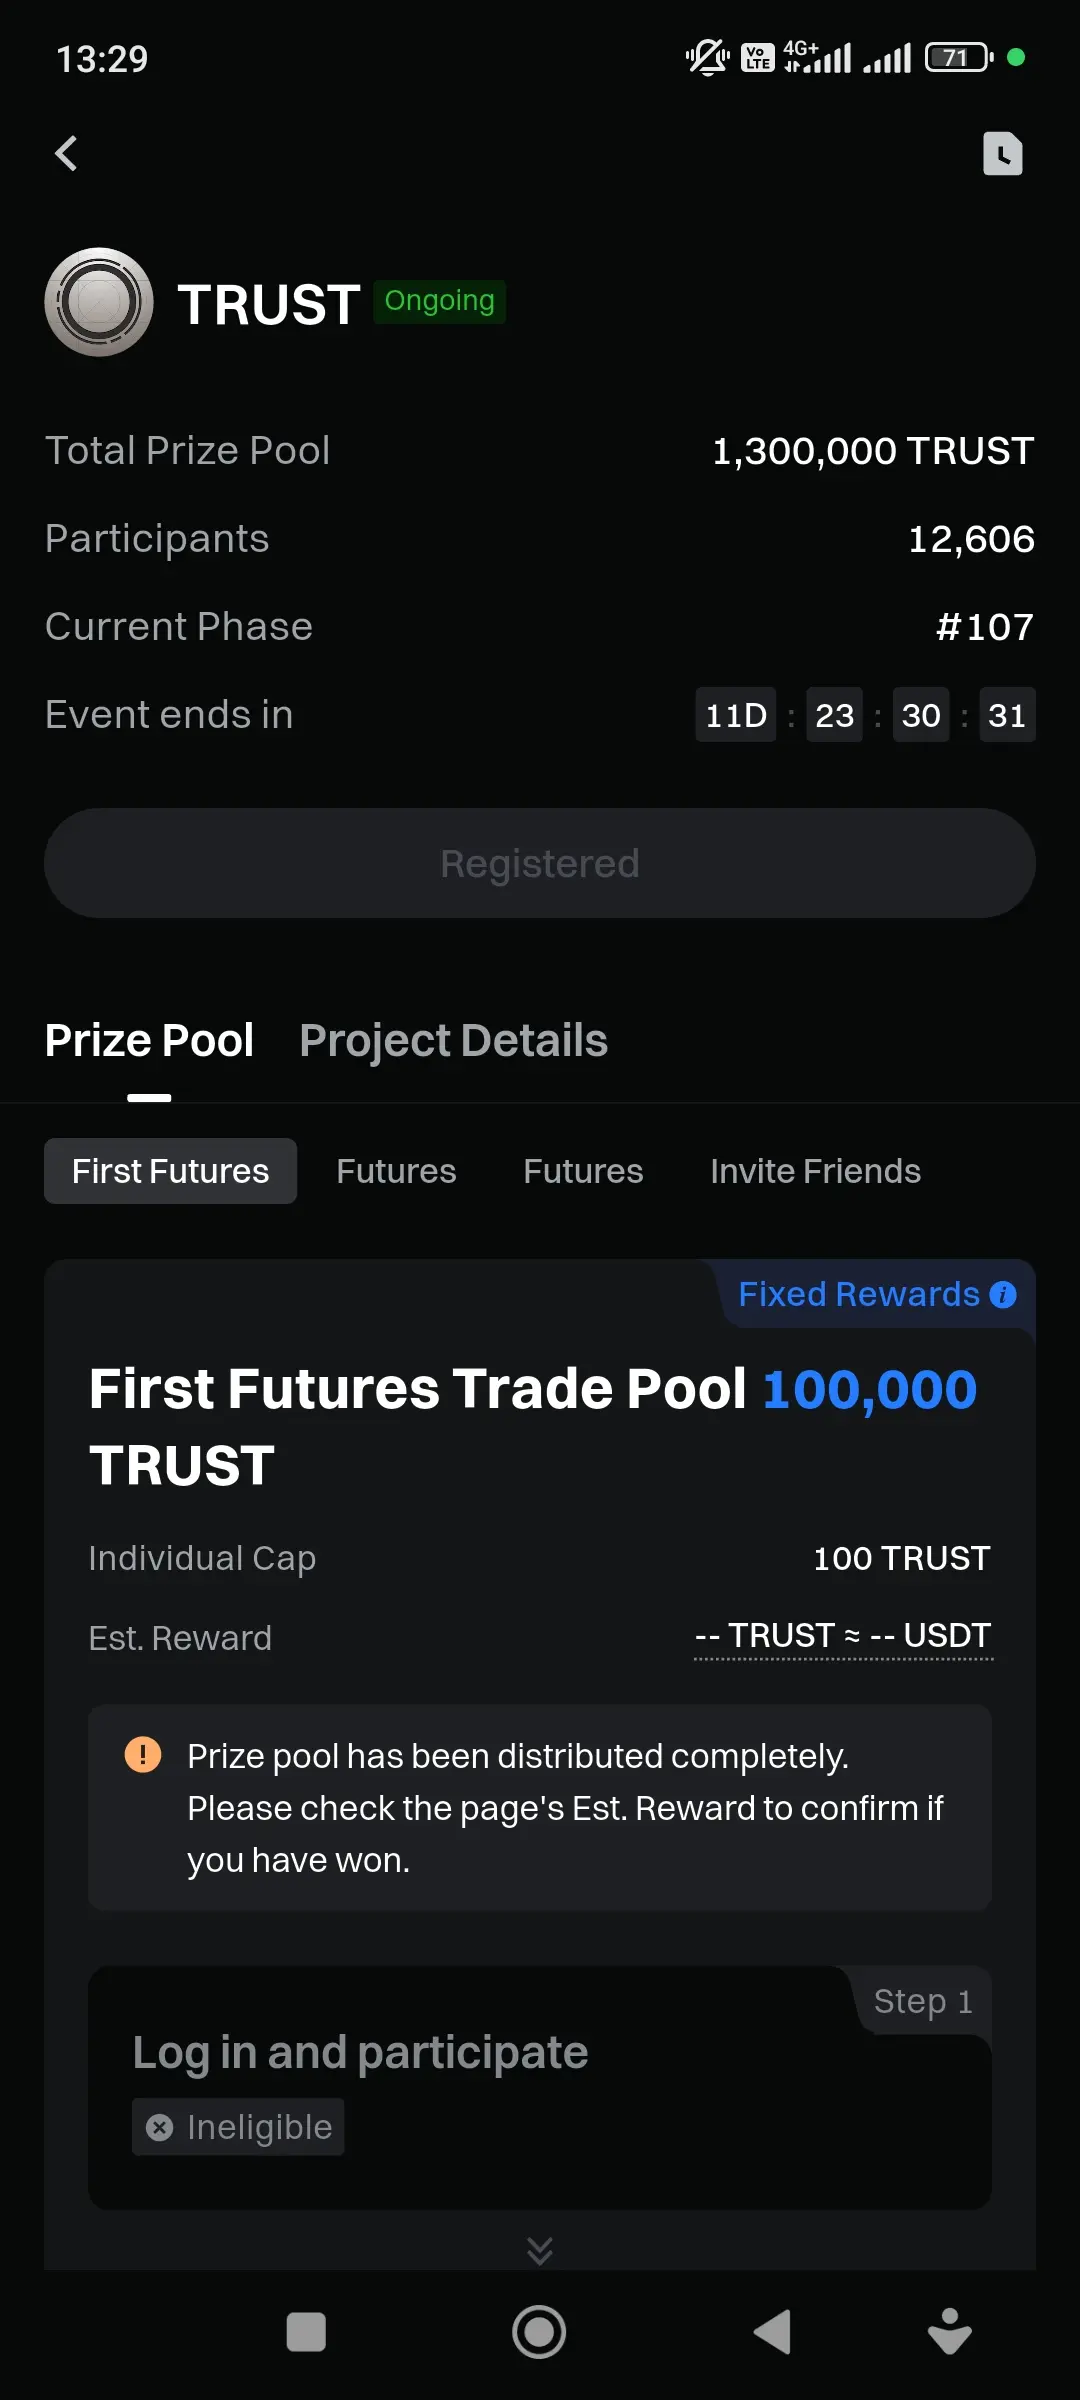
$TRUST (Intuition): A token for monetizing your intuition. Trading starts on Gate.com and Candy Drop!
TRUST is a key element of a decentralized platform that turns human intuition and expert knowledge into a real asset. With it, you can receive paid forecasts, share your insights, and monetize them, creating a new knowledge market.
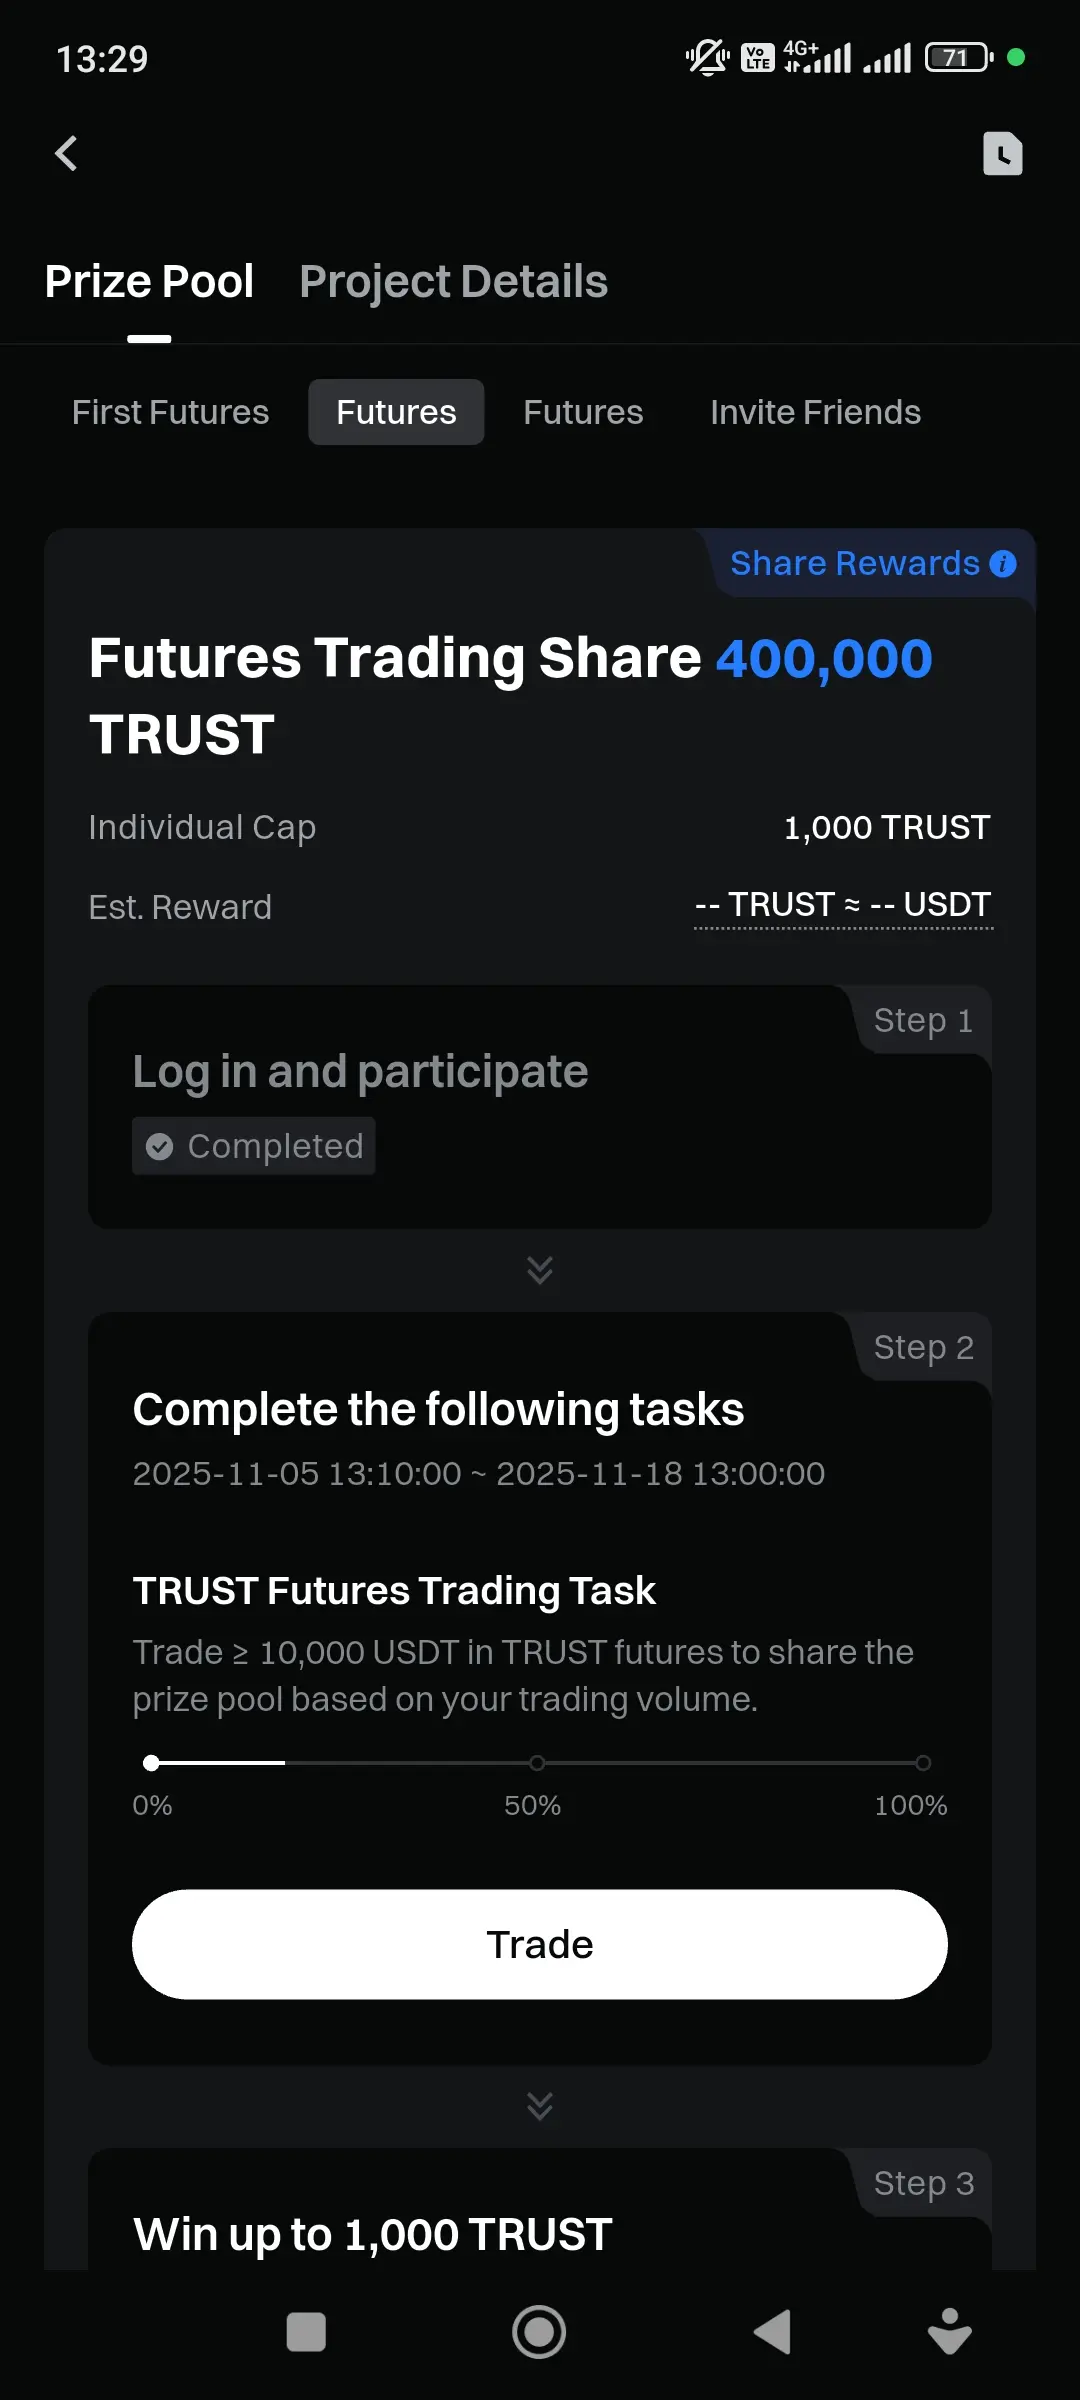
To celebrate the listing, Gate.com is launching a large-scale Candy Drop with a total pool of 1,300,000 TRUST!
Key dates:
· Trading start: November 5, 2025, 10:00 UTC
· Candy Drop: November 5 – 18, 2025
How to participate?
There are several ways to
TRUST-4.58%
View Original
post-image
post-image
  • Reward
  • 29
  • Repost
  • Share
CHAITHUvip:
thank you for the information
View More
GM Friends, welcome to my live broadcast
post-image
  • Reward
  • 5
  • Repost
  • Share
Discoveryvip:
2025 GOGOGO 👊
View More
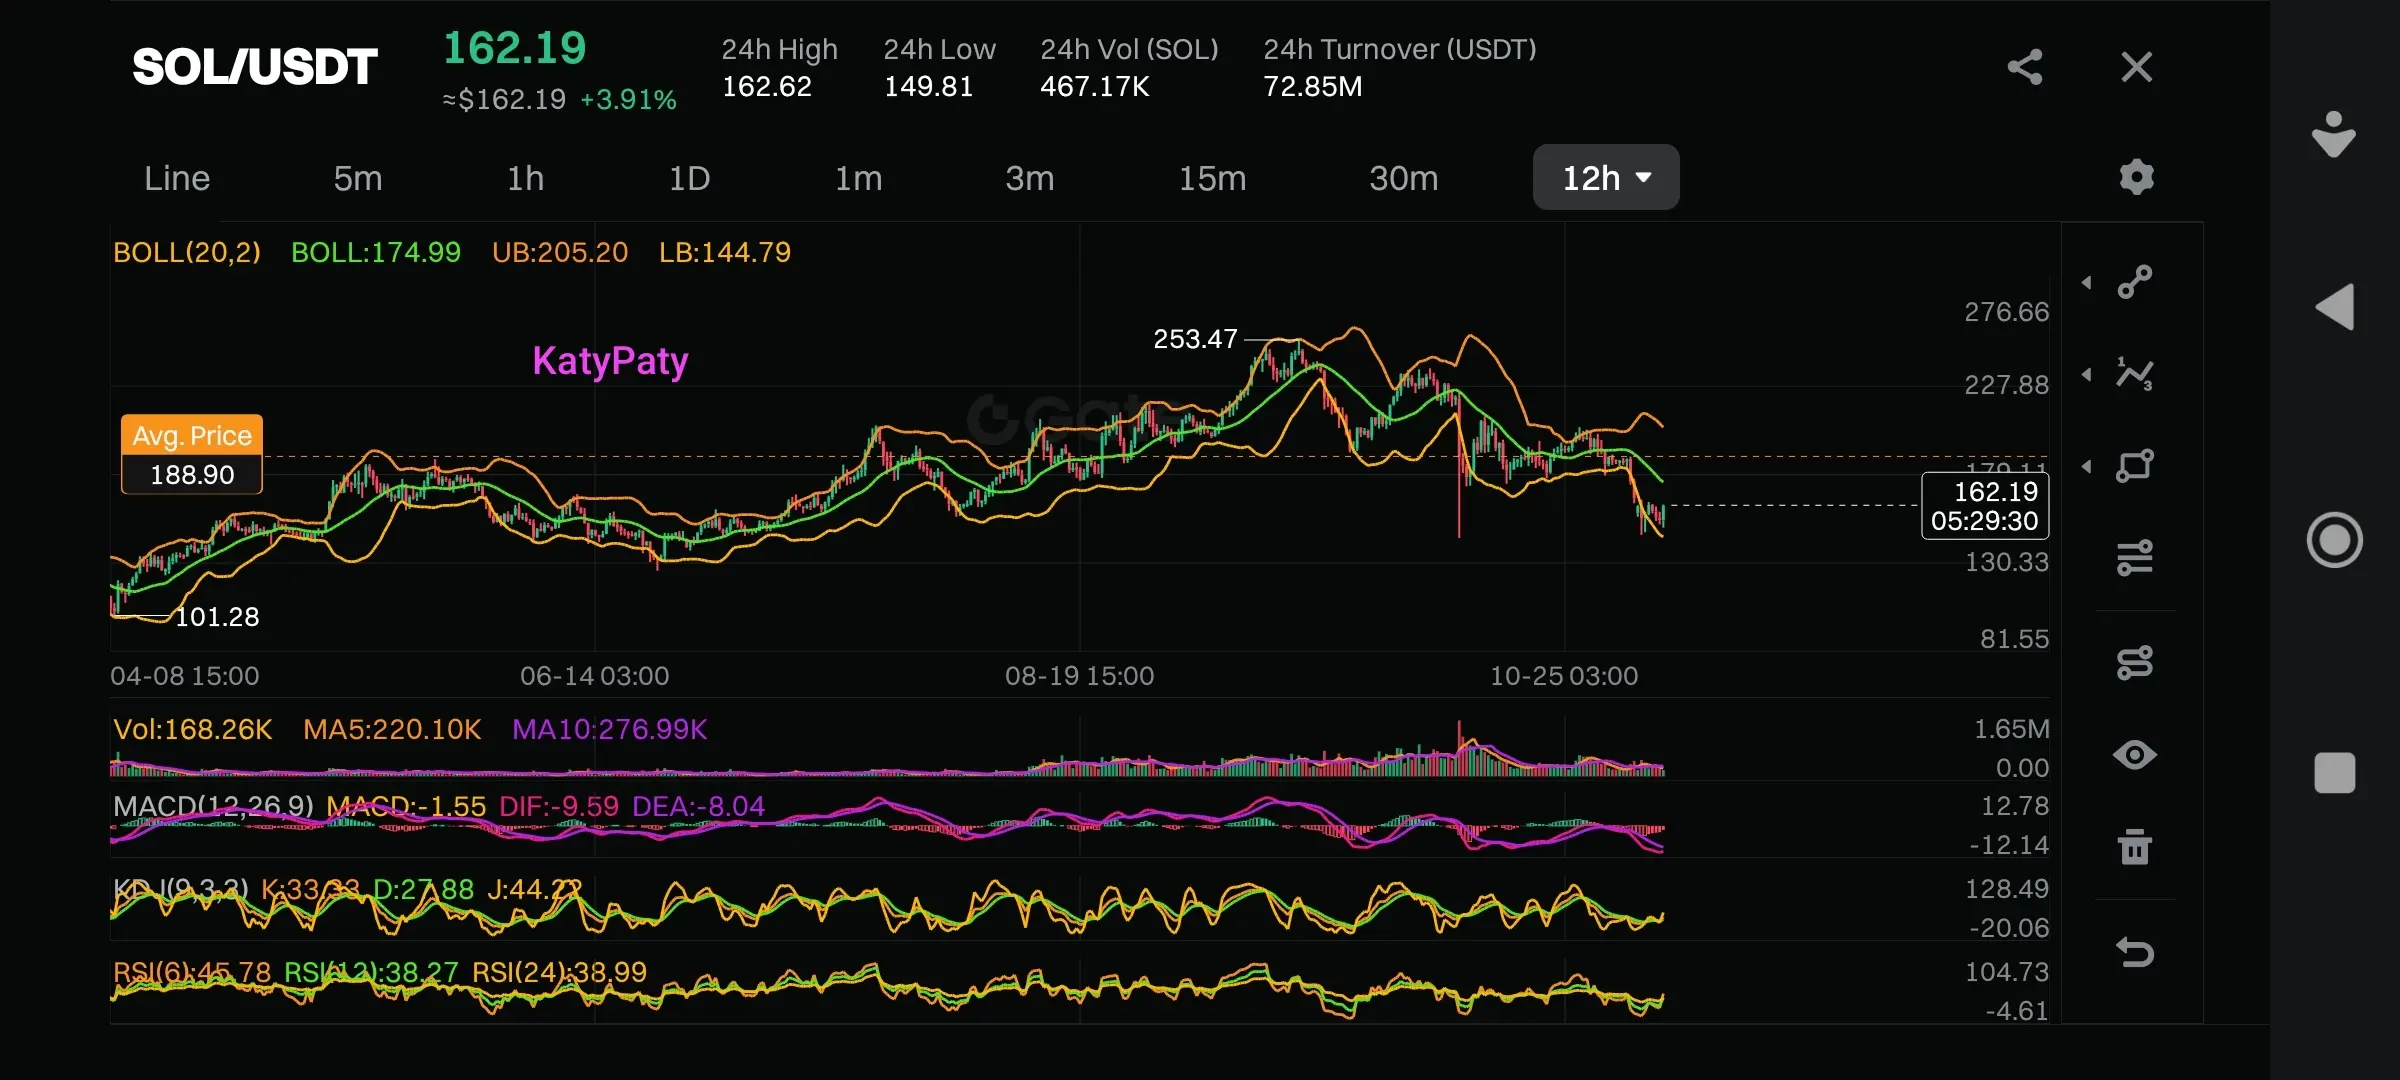
🚀 Solana (SOL): Готовится ли к прорыву? Анализ графика
Взглянем на текущую ситуацию с SOL/USDT. Монета показывает себя довольно волатильно, но в ее графике уже можно разглядеть несколько ключевых сигналов.
📊 Текущая картина:
· Цена: $162.19, демонстрируя небольшой рост за последние часы.
· Ключевой уровень поддержки: Полоса Боллинджера (нижняя, LB) находится на уровне ~$144.79. Это сильный уровень, от которого цена уже отскакивала. Пока SOL держится выше него, структура не сломана.
· Сопротивление: Впереди ждет серьезное препятствие — средняя линия Боллинджера (BOLL) на ~$174.99, а выше — мо
SOL5.95%
post-image
  • Reward
  • 34
  • Repost
  • Share
CHAITHUvip:
thank you for the information
View More
Welcome to my live broadcast Friends
post-image
  • Reward
  • 6
  • Repost
  • Share
ROCKSTAR99vip:
Bull Run 🐂
View More
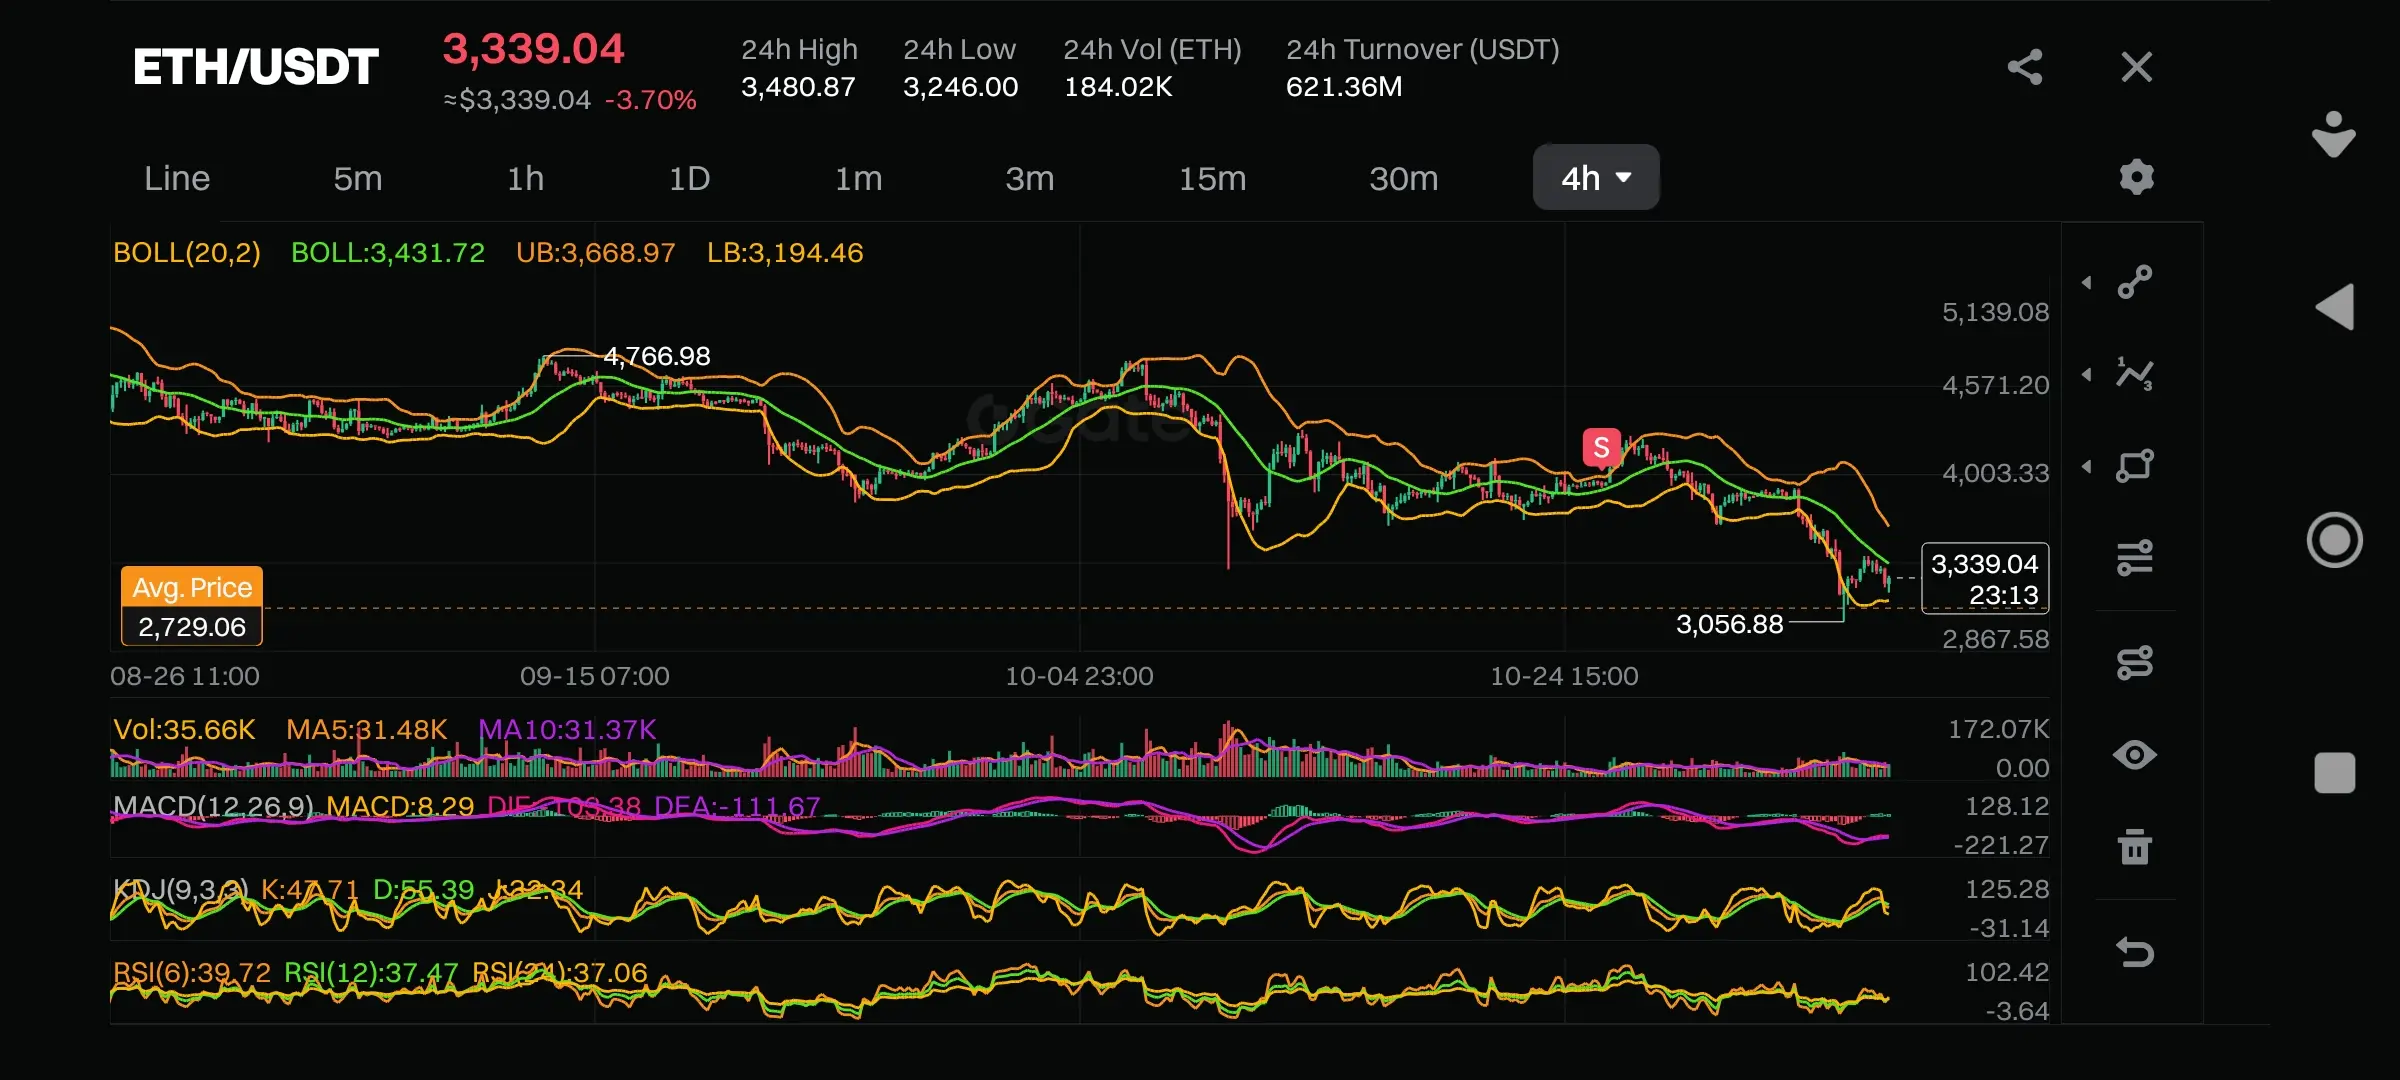
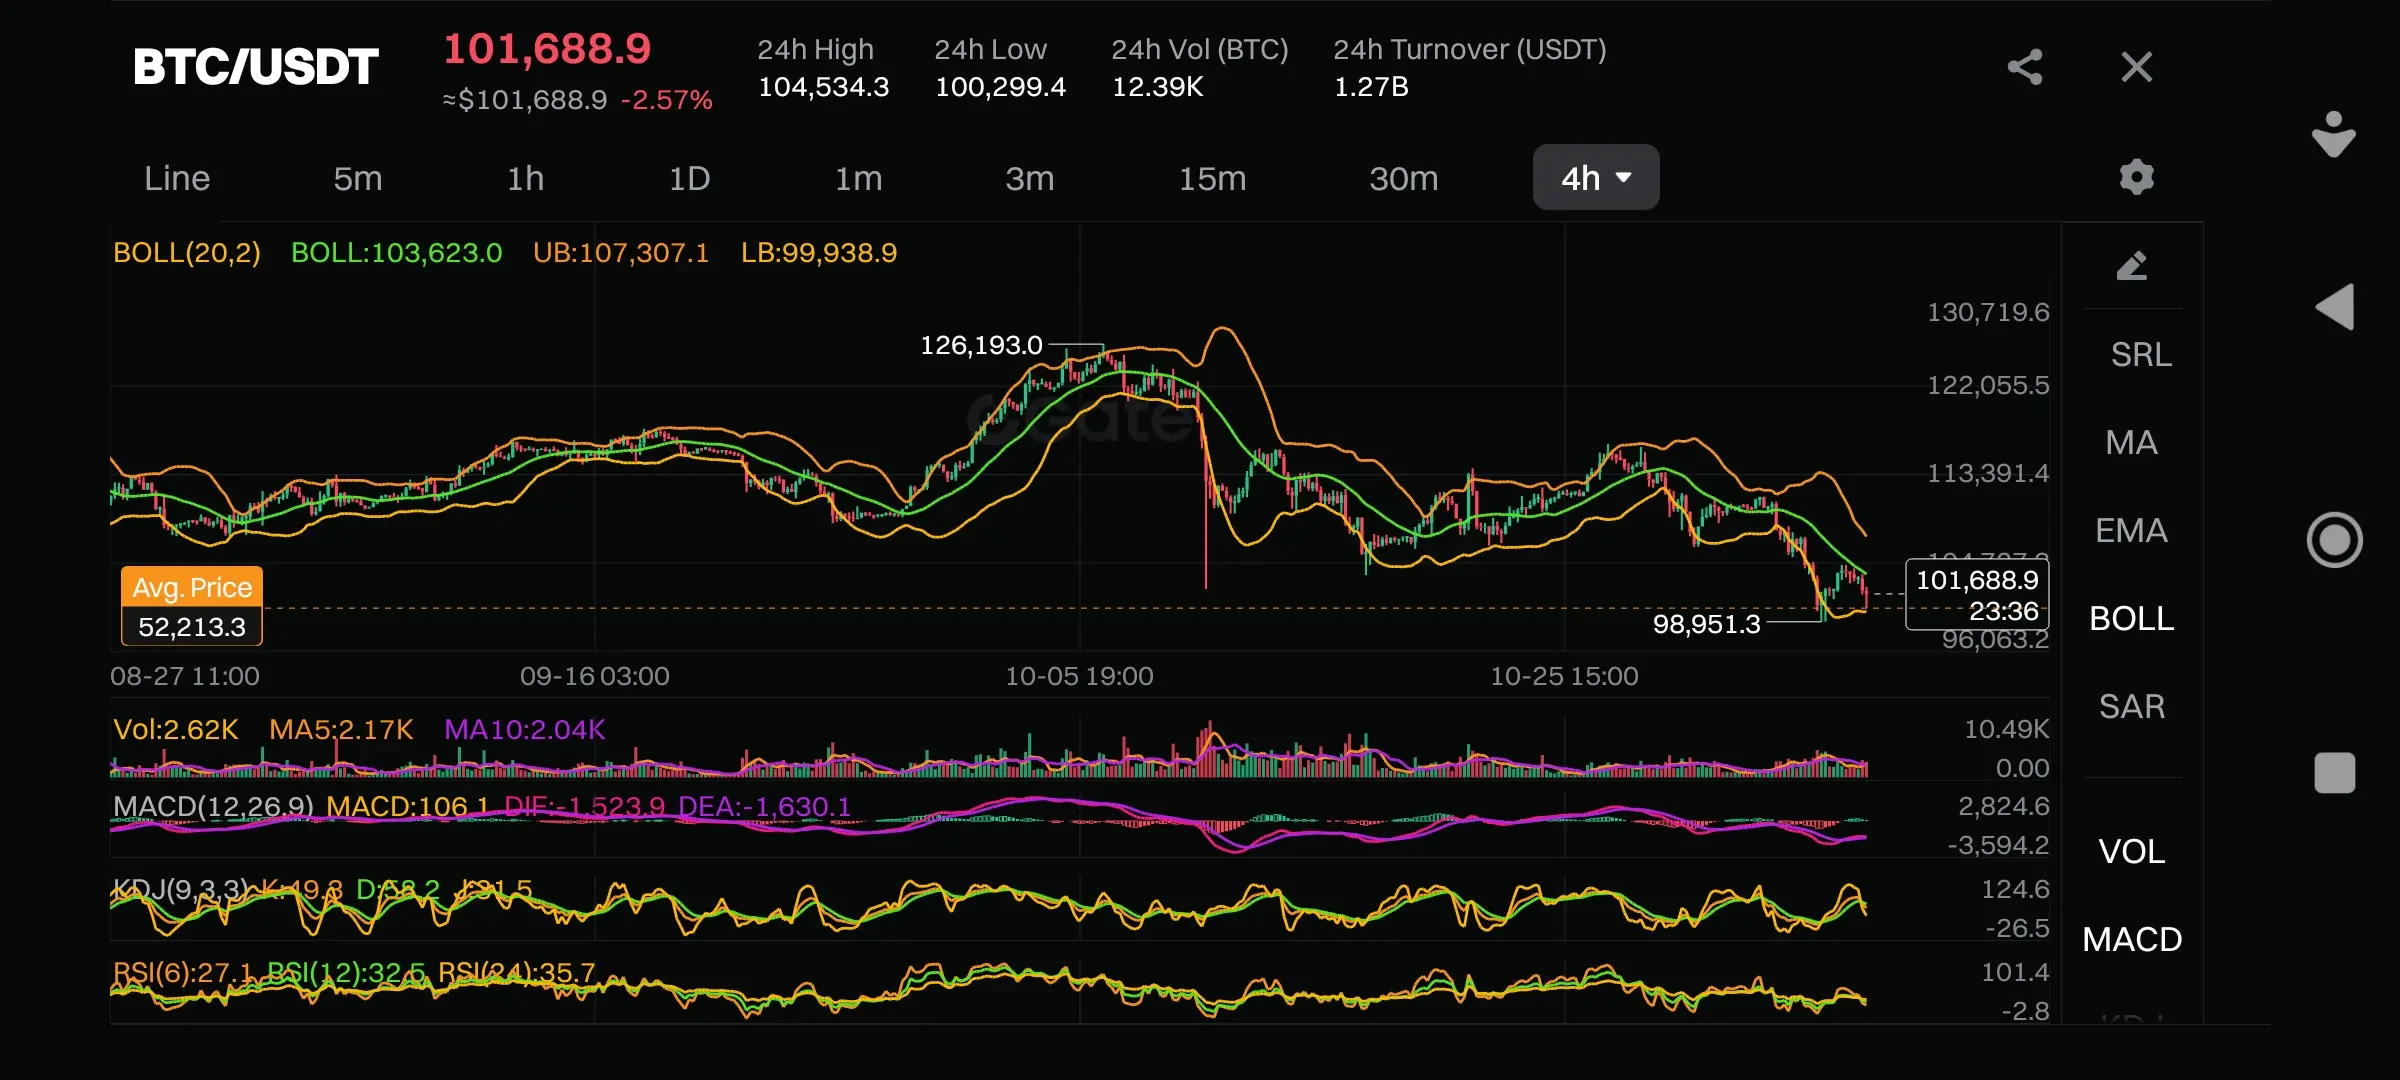
Thoughts on Correction: Is it a Buying Opportunity or Time to Run?
The crypto community has recently been on pause, questioning whether the current market dip is just a short-term shakeout of "weak hands" or the start of a full trend reversal.
Let's take a look at the charts of key assets:
#BTC/USDT
Price: $101,688 #CryptoMarketPullback -2.57%(
- Technicals show BTC bounced off a significant support level around $100,300 )24h Low(, which is also near the lower Bollinger Band )LB: $99,938(.
- RSI )6, 12, 24( is in the 27-35 zones, indicating strong oversold conditions. Historically, this has be
BTC3.88%
ETH5.6%
SOL5.95%
View Original
post-image
post-image
  • Reward
  • 32
  • Repost
  • Share
xiaoXiaovip:
Hold on tight, we are about to To da moon 🛫
View More
Welcome to my live broadcast
  • Reward
  • 20
  • Repost
  • Share
ROCKSTAR99vip:
Ape In 🚀
View More
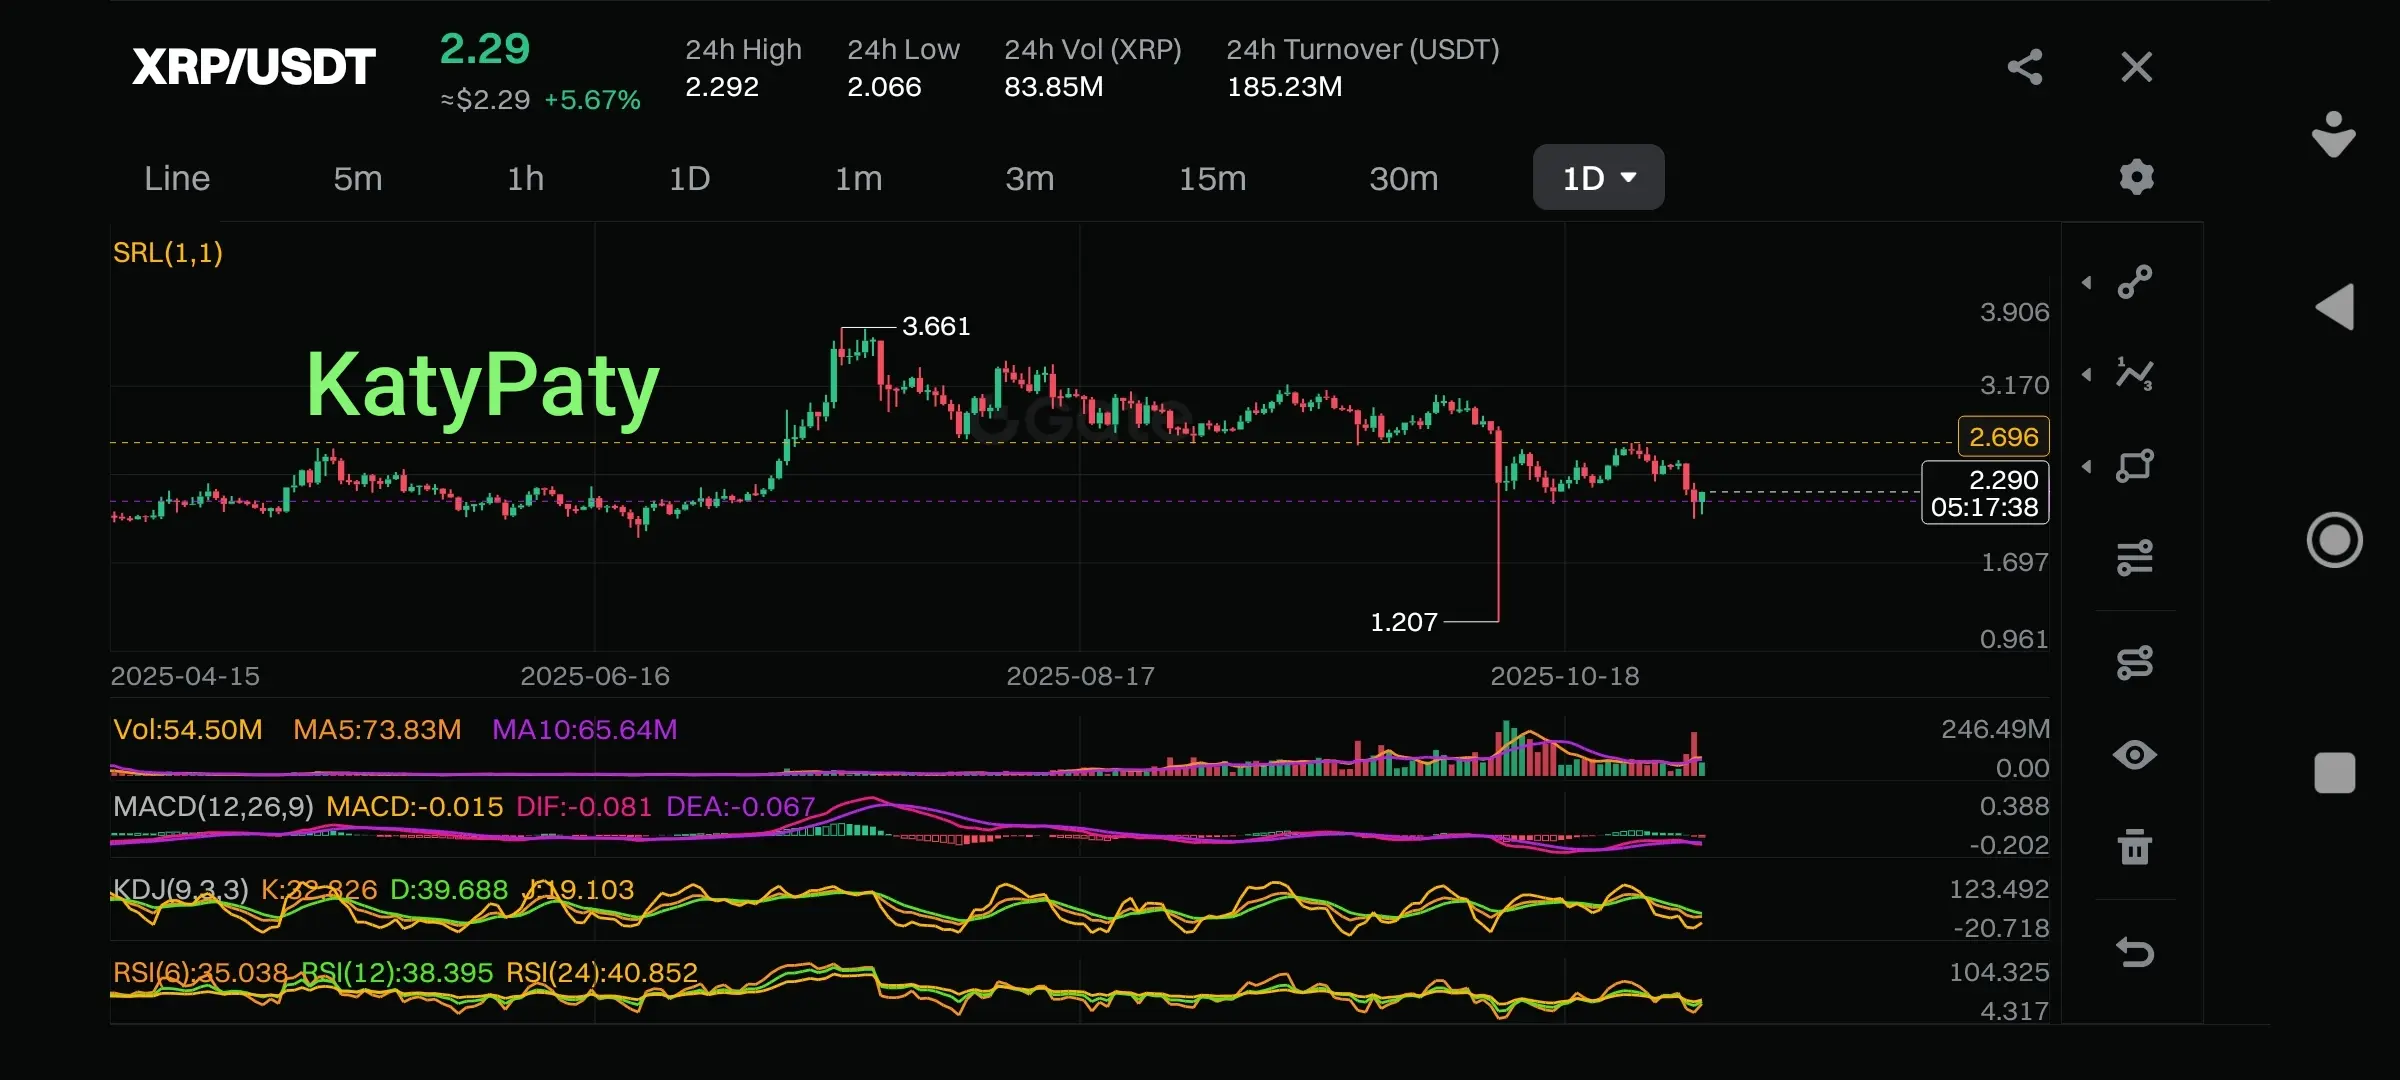
#XRPPriceUpdate
XRP/USDT: Rapid Recovery to $3? Chart Analysis and Key Levels
Hello, crypto community! 👋 Let’s take a look at $XRP , which today shows an impressive increase of +5.67%. The price has risen to $2.29, and many are wondering: could this be the start of a quick rebound toward the coveted $3?
Let’s analyze the current data.
🟢 Arguments IN FAVOR of a rapid rise (Bulls)
1. Break of local high: The price has hit a 24-hour high of ($2.292), indicating strong current momentum.
2. Support at the 50% Fibonacci level: If we consider the entire move from the low (~$1.20) to the high (~$3.
XRP12.84%
View Original
post-image
  • Reward
  • 20
  • Repost
  • Share
CHAITHUvip:
HODL Tight 💪
View More
#AsterBurns50%OfBuybackTokens
$ASTER burns 50% of the buyback: Genius move or desperation? Analyzing tokenomics
As you may have already seen, the Aster project made a loud announcement: they declared that they will burn 50% of all funds allocated for token buybacks (Buyback). The news already had an effect — the ASTER price jumped by 14%. But what’s really behind this move? Let’s analyze, not emotionally but based on documentation, whether this is a well-thought-out long-term strategy or just an attempt to stir up hype.
What is actually happening? Let’s refer to the sources.
According to off
ASTER3.84%
View Original
post-image
  • Reward
  • 24
  • Repost
  • Share
CHAITHUvip:
HODL Tight 💪
View More
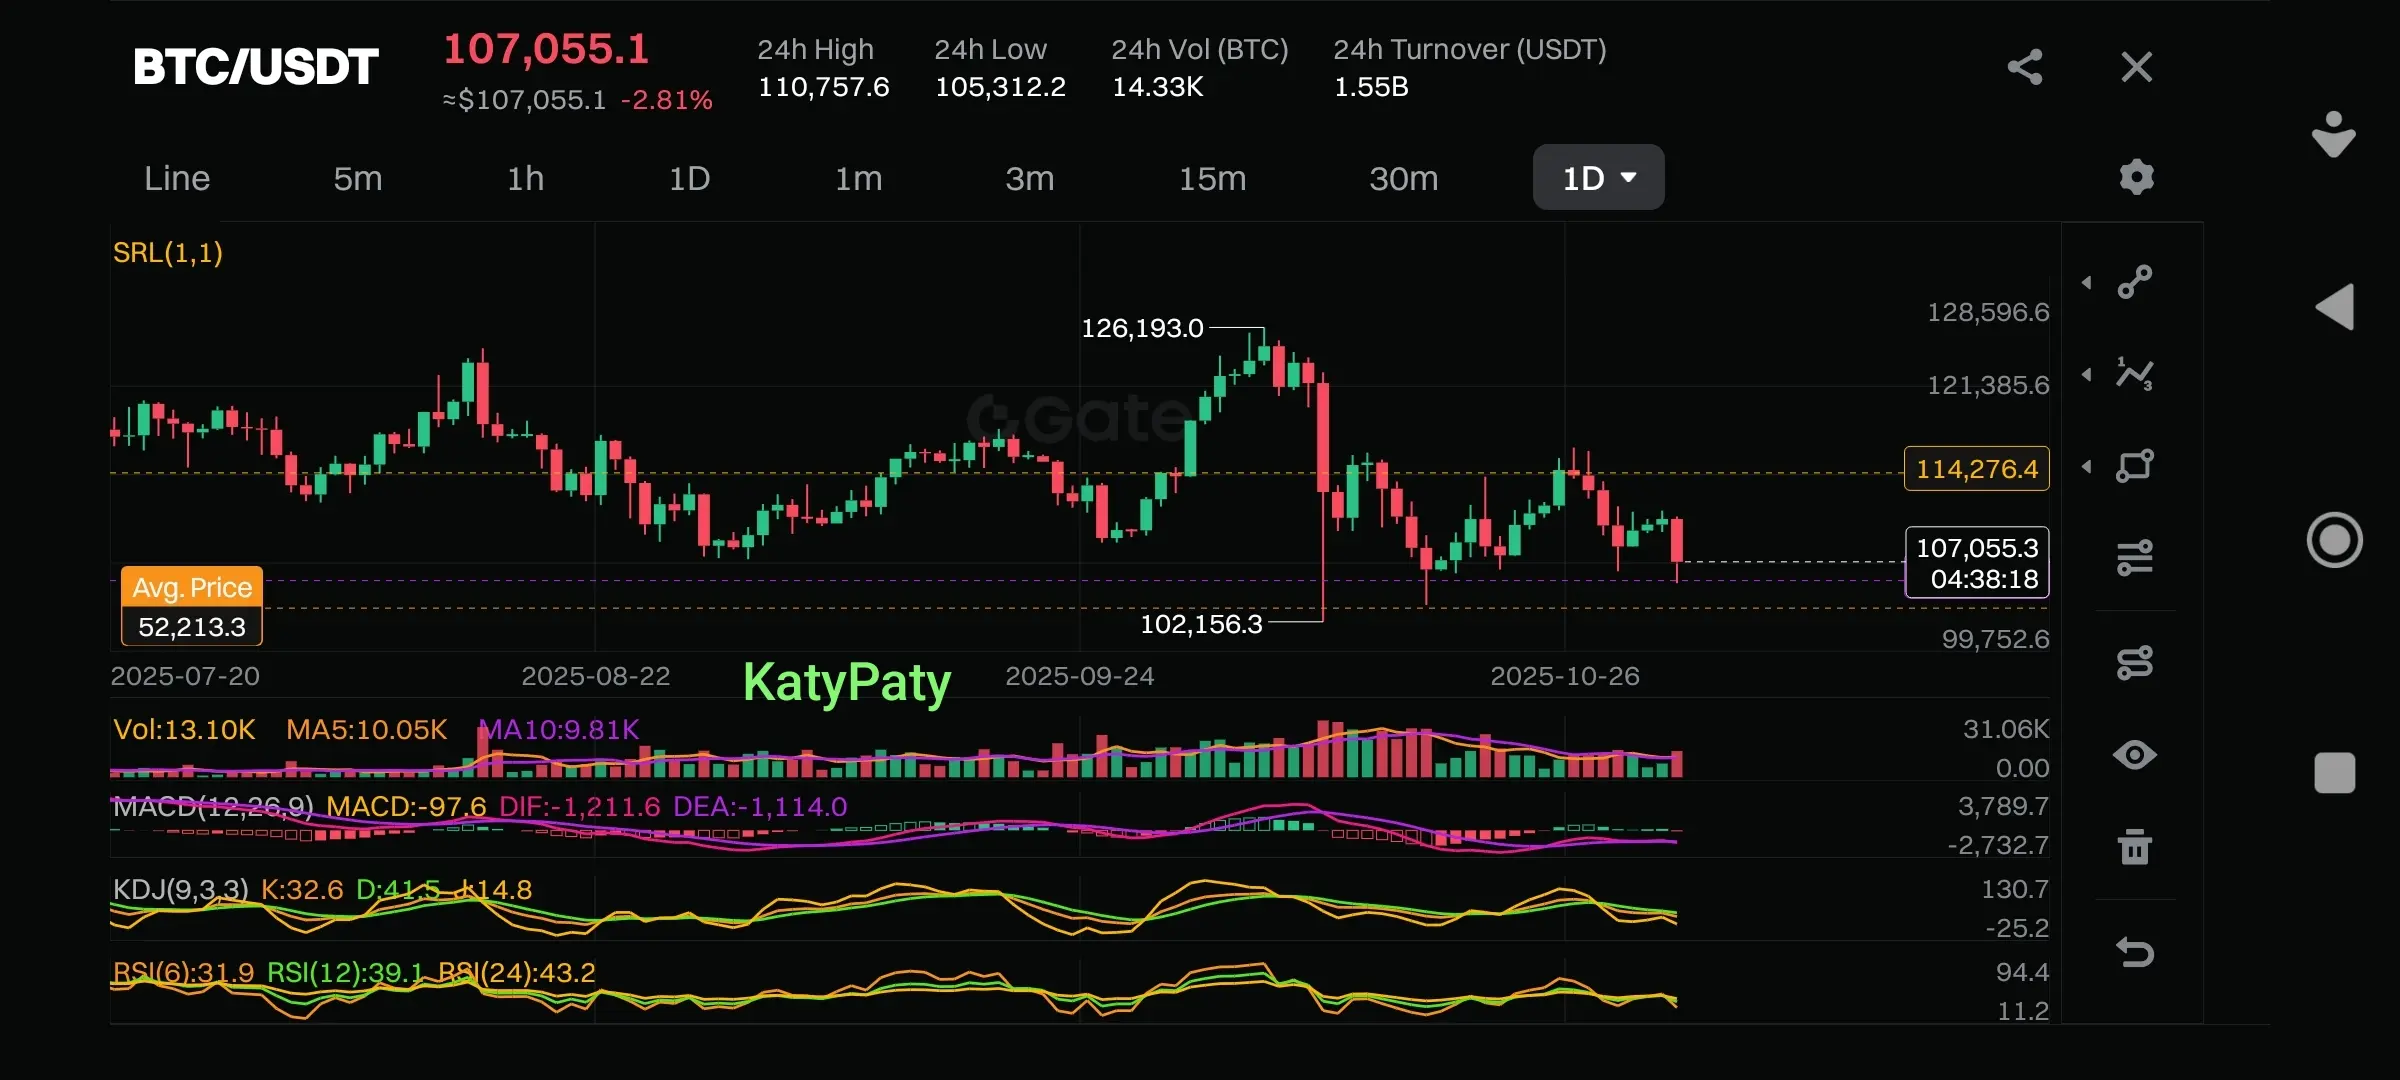
#BitcoinPriceAnalysis
Analysis $BTC /USDT: Deep correction or the start of a more serious decline?
Let's look at the chart, which provides us with a number of interesting signals.
1. Price and Key Levels:
· Current price: ~$107,055. The token is in a clear downtrend, having fallen from a local high around $128,600.
· Critical support: The level of $105,312 (24h Low) is the main barrier for bulls. A break below and consolidation below this level will open the way to test the psychological mark of $100,000 and further down to $99,752 (minimum on the chart).
· Resistance: The nearest resistance
BTC3.88%
View Original
post-image
  • Reward
  • 25
  • Repost
  • Share
ShizukaKazuvip:
Just go for it 💪
View More
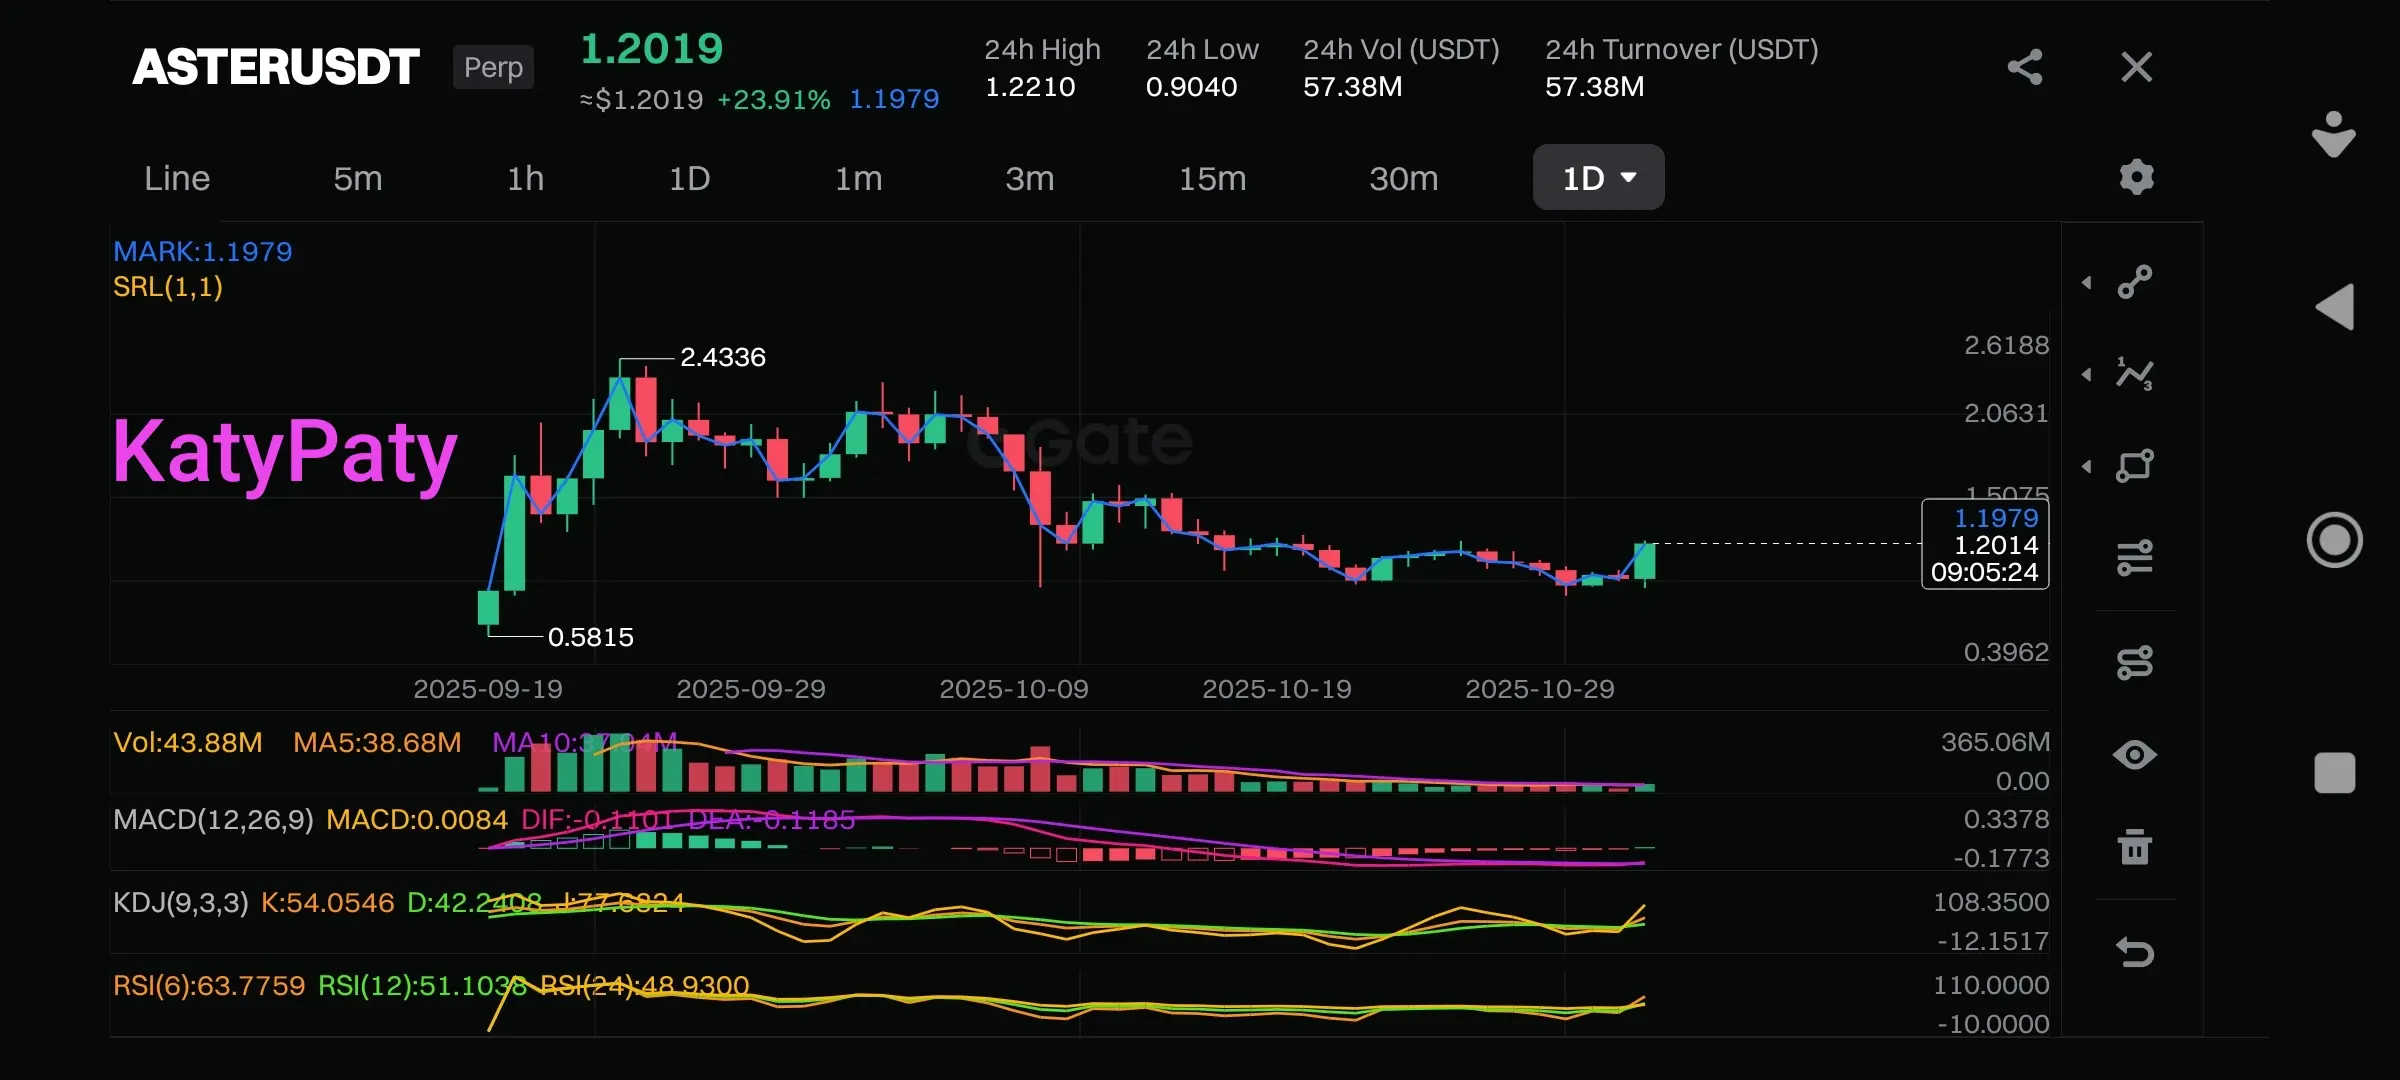
ASTER/USDT: Weekend breakout or fake pump? Analyzing with a cool head.
Greetings, traders! Let’s take a look at $ASTER , which showed a +23.91% move on Sunday. Is this a signal for continued growth or a trap for bulls? Let’s get straight to the data.
📊 Key metrics at the time of analysis:
· Price: $1.2019
· 24-hour change: +23.91%
· 24-hour range: $0.9040 - $1.2210 (wide!)
· 24-hour volume: $57.38M
Arguments FOR a breakout (Bullish scenario):
1. Strong price impulse: A nearly 24% rise is a significant move that’s hard to ignore. The price is trading near the upper boundary of yesterday’s rang
ASTER3.84%
View Original
post-image
  • Reward
  • 19
  • Repost
  • Share
UQueenvip:
HODL Tight 💪
View More
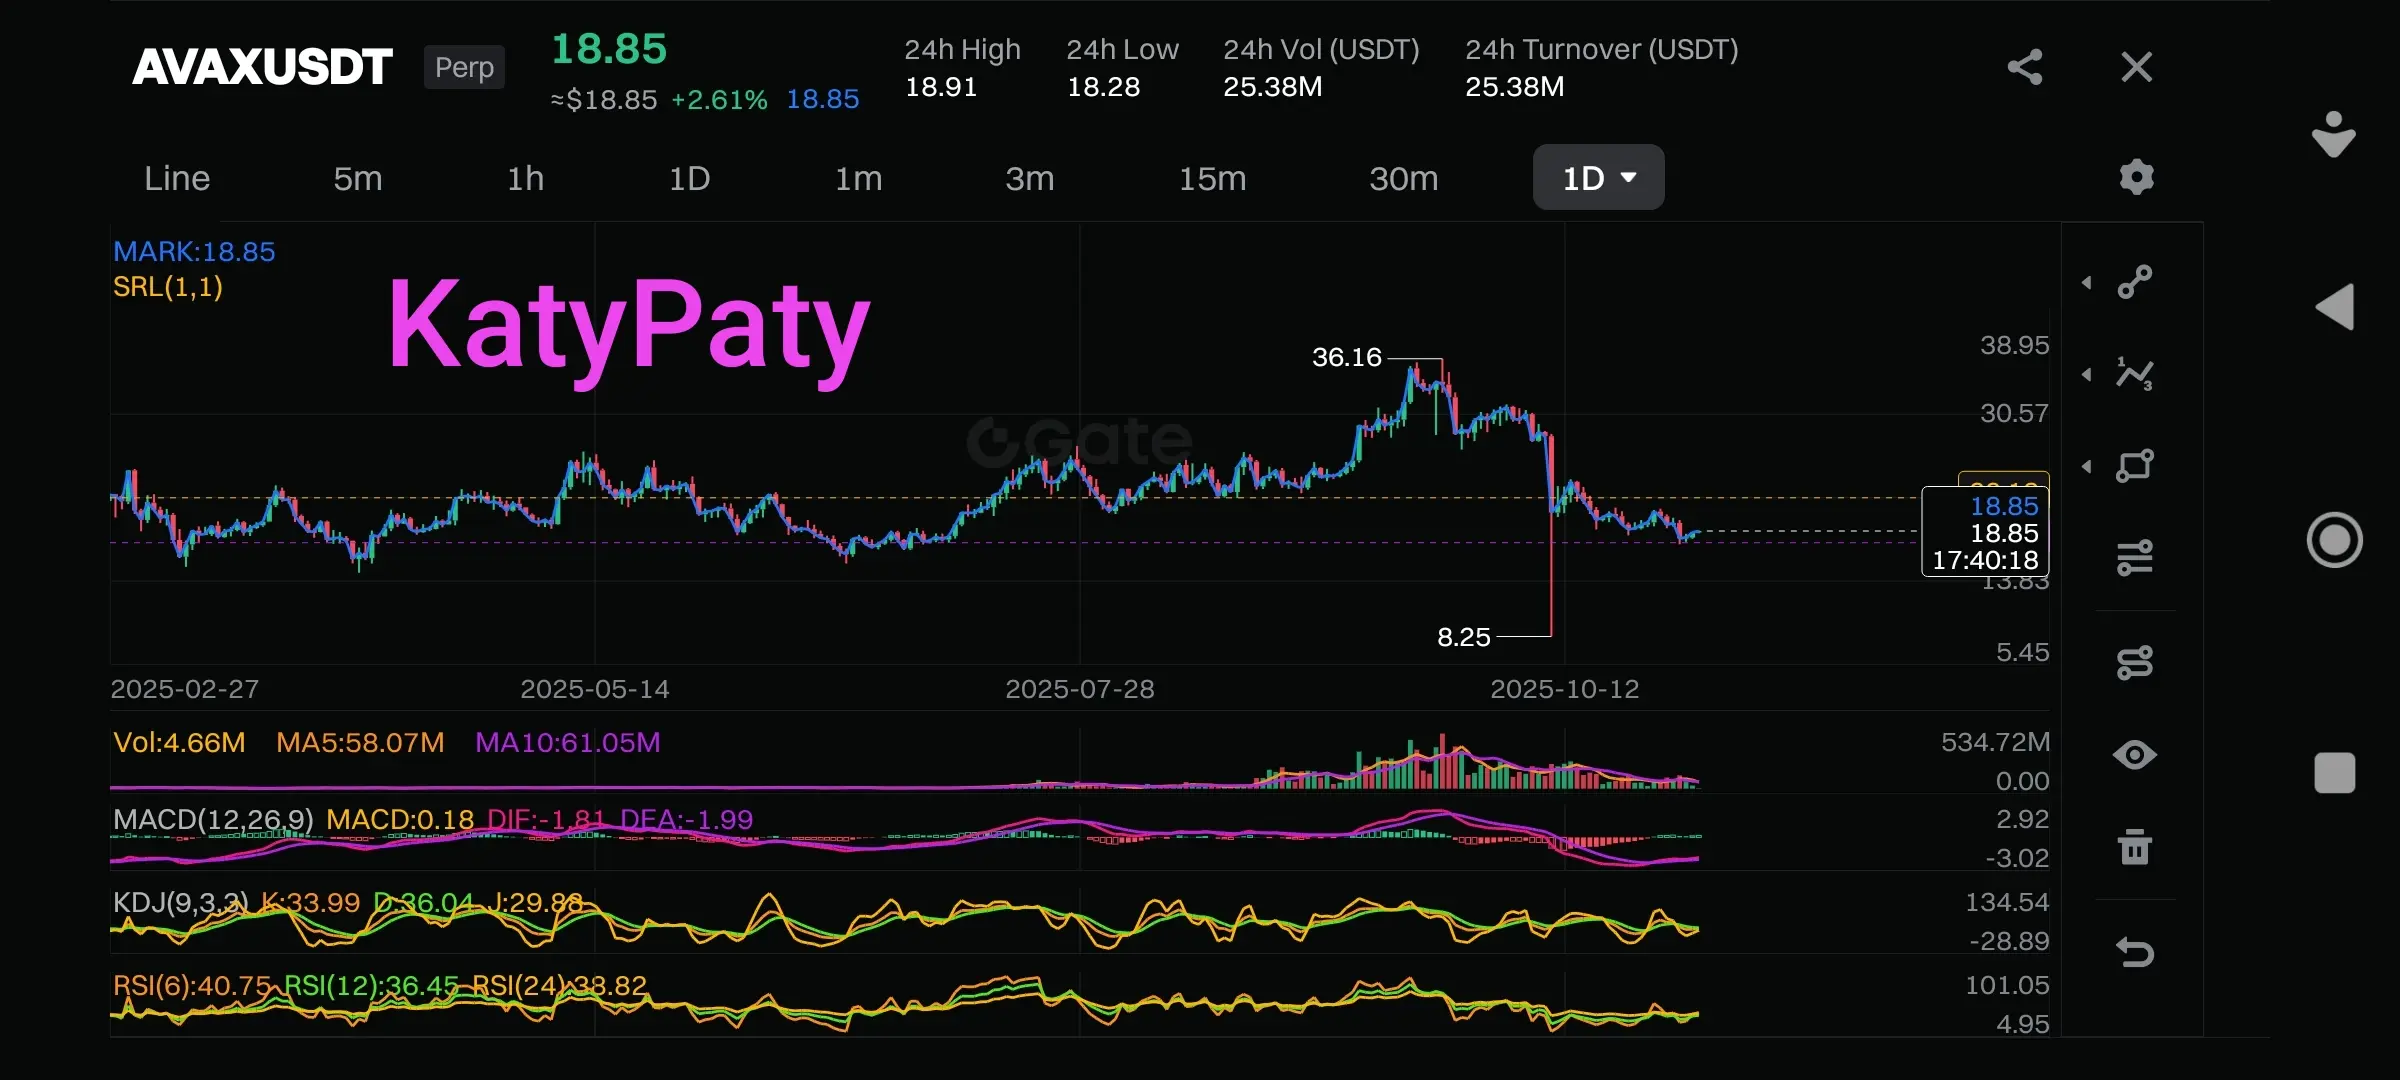
AVAX: Is a quick return to $36 expected?
Hello, crypto family! Let’s take a look at AVAX, which many are wondering about: "When will we see $36 again?"
Current picture:
· Price: ~$18.85
· Trend: The overall downward trend continues.
· Key level: Struggling to stay above the support at $18.30.
What do the indicators say?
· MACD: Almost at zero. No strength from the bears, nor a strong charge from the bulls. We are stagnating.
· Volumes: Extremely low. Whale activity is absent, indicating a lack of interest in a sharp price movement right now.
Can AVAX quickly soar to $36?
Short answer: No
AVAX4.96%
View Original
post-image
  • Reward
  • 17
  • Repost
  • Share
UQueenvip:
HODL Tight 💪
View More
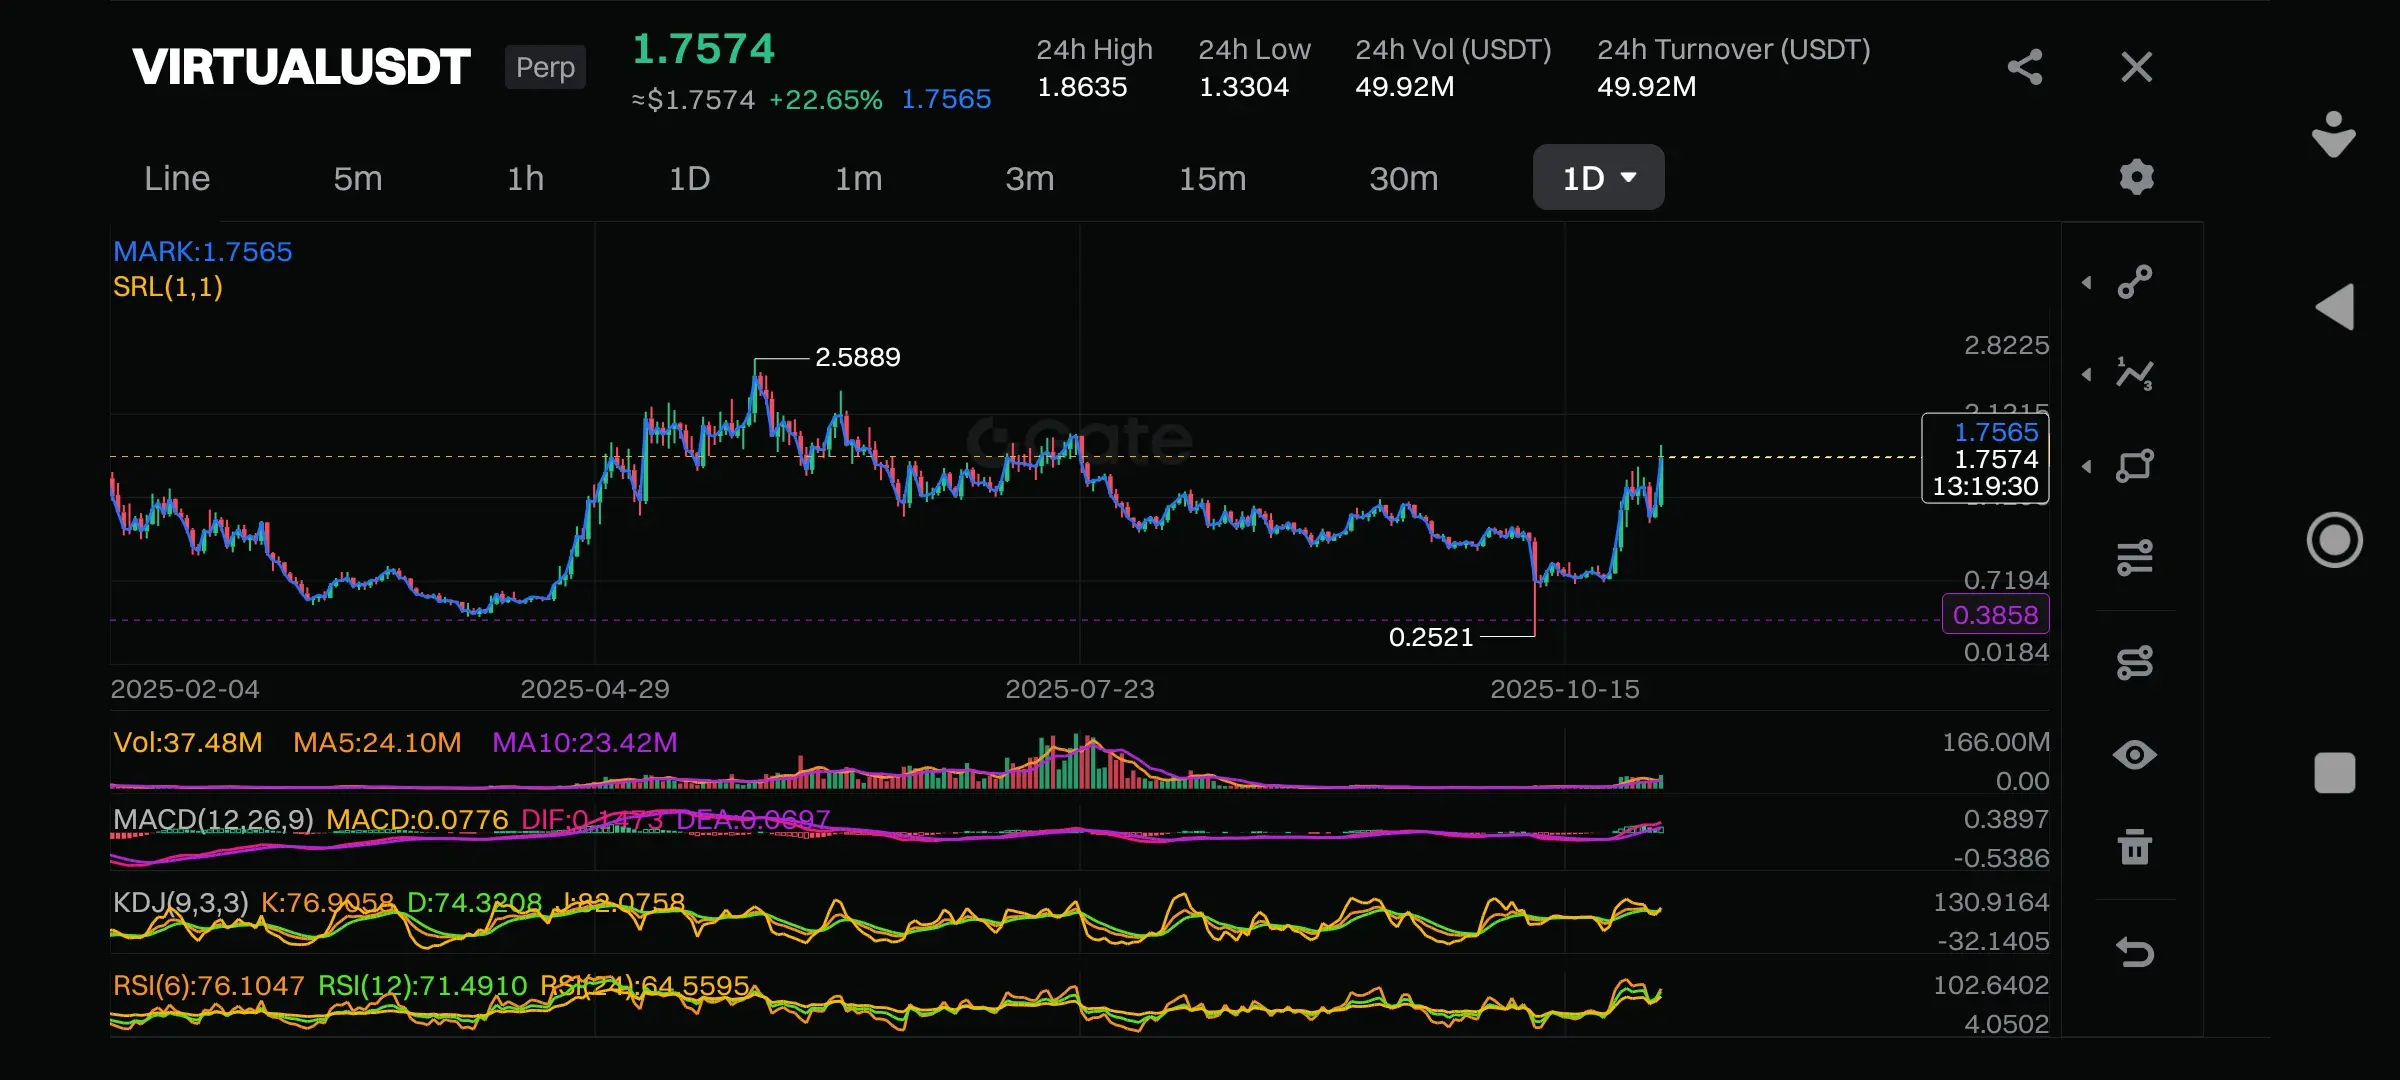
VIRTUAL/USDT: Bright Recovery or Bull Trap? Analyzing the Current Situation
I just looked at the VIRTUAL/USDT chart — and it looks truly impressive! The coin shows a strong rebound +22.65% with a price around $1.7574. But what’s behind this beautiful green candle? Let’s figure it out.
What we see in technical analysis:
**Strengths:**
· RSI is soaring: RSI(24) at 94.58 — this signals incredible momentum. The growth is clearly not exhausted.
· Volumes speak for themselves: Current volume is 37.48M compared to MA5 (24.10M) — a fresh influx of capital is evident.
· Key level broken: The price
VIRTUAL10.2%
View Original
post-image
  • Reward
  • 20
  • Repost
  • Share
Asiftahsinvip:
1000x Vibes 🤑
View More
🐋Where Are the Whales Heading? Notes on November Hopes and Appetite of the Giants of the Crypto Market.
I've always wondered what the crypto market resembles. Sometimes I think it's an ocean. On the surface, there are waves of panic and excitement that everyone can see. But the true driving force is hidden beneath the depths. These are the whales — the largest players whose decisions can set the direction of the currents.
It's interesting to look at analyst data and see where these giants are directing their capital ahead of November. The picture that emerges is quite revealing.
Here's what c
ETH5.6%
XRP12.84%
LINK7.68%
XLM12.19%
View Original
post-image
  • Reward
  • 25
  • 1
  • Share
Asiftahsinvip:
1000x Vibes 🤑
View More
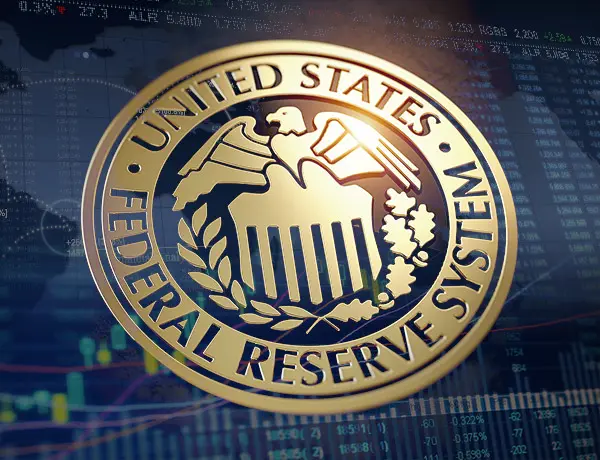
#FedCutsRatesBy25Bp
The U.S. Federal Reserve has lowered the rate for the second consecutive time by 0.25%. What consequences can we expect for the market?
So, the Federal Reserve (Federal Reserve) is taking its second consecutive step toward easing monetary policy, lowering the key rate to a range of 3.75%–4.00%. This is no longer just a "test" but the start of a full cycle of rate cuts. Let’s consider what this might mean for various market sectors.
Why is this important?
A rate cut by the Fed is like turning a tap of cheap money. Loans for businesses and consumers become more accessible, s
View Original
post-image
  • Reward
  • 21
  • Repost
  • Share
Asiftahsinvip:
1000x Vibes 🤑
View More
Join the Gate P2P Halloween Trade & Treat Carnival to win F1 VIP tickets and grab a share of the $18,888 prize pool!
  • Reward
  • 16
  • Repost
  • Share
Asiftahsinvip:
HODL Tight 💪
View More
The @LineaBuild ecosystem is becoming a powerful hub for DeFi and gaming.
Growing TVL thanks to Lynex and Mendi Finance.
🎮 Boom of gaming projects like Dizzle.
⚡ ZK-rollup technology for speed and low fees. The future belongs to active L2s. LINEA is leading the race!
#LINEA @E2#
LYNX1.4%
LINEA9.4%
View Original
post-image
  • Reward
  • 14
  • 1
  • Share
Asiftahsinvip:
1000x Vibes 🤑
View More
📊📉📈Analysis of HBAR/USDT: Deep rebound or temporary pause before growth?
Greetings, community! Let's take a look at the HBAR/USDT chart, which shows a very interesting and ambiguous picture after recent strong movement.
Key data at the time of analysis:
· Current price: $0.1946 ( - 2.87% over 24 hours )
· 24-hour range: $0.19245 — $0.21980
· Important point: Price is testing the lower boundary of its 24-hour range.
What do the indicators say?
1. RSI ( Relative Strength Index ):
· RSI (6): 74.91 — The value indicates overbought conditions on short timeframes. This often precedes a correct
HBAR15.19%
View Original
  • Reward
  • 16
  • Repost
  • Share
Asiftahsinvip:
HODL Tight 💪
View More
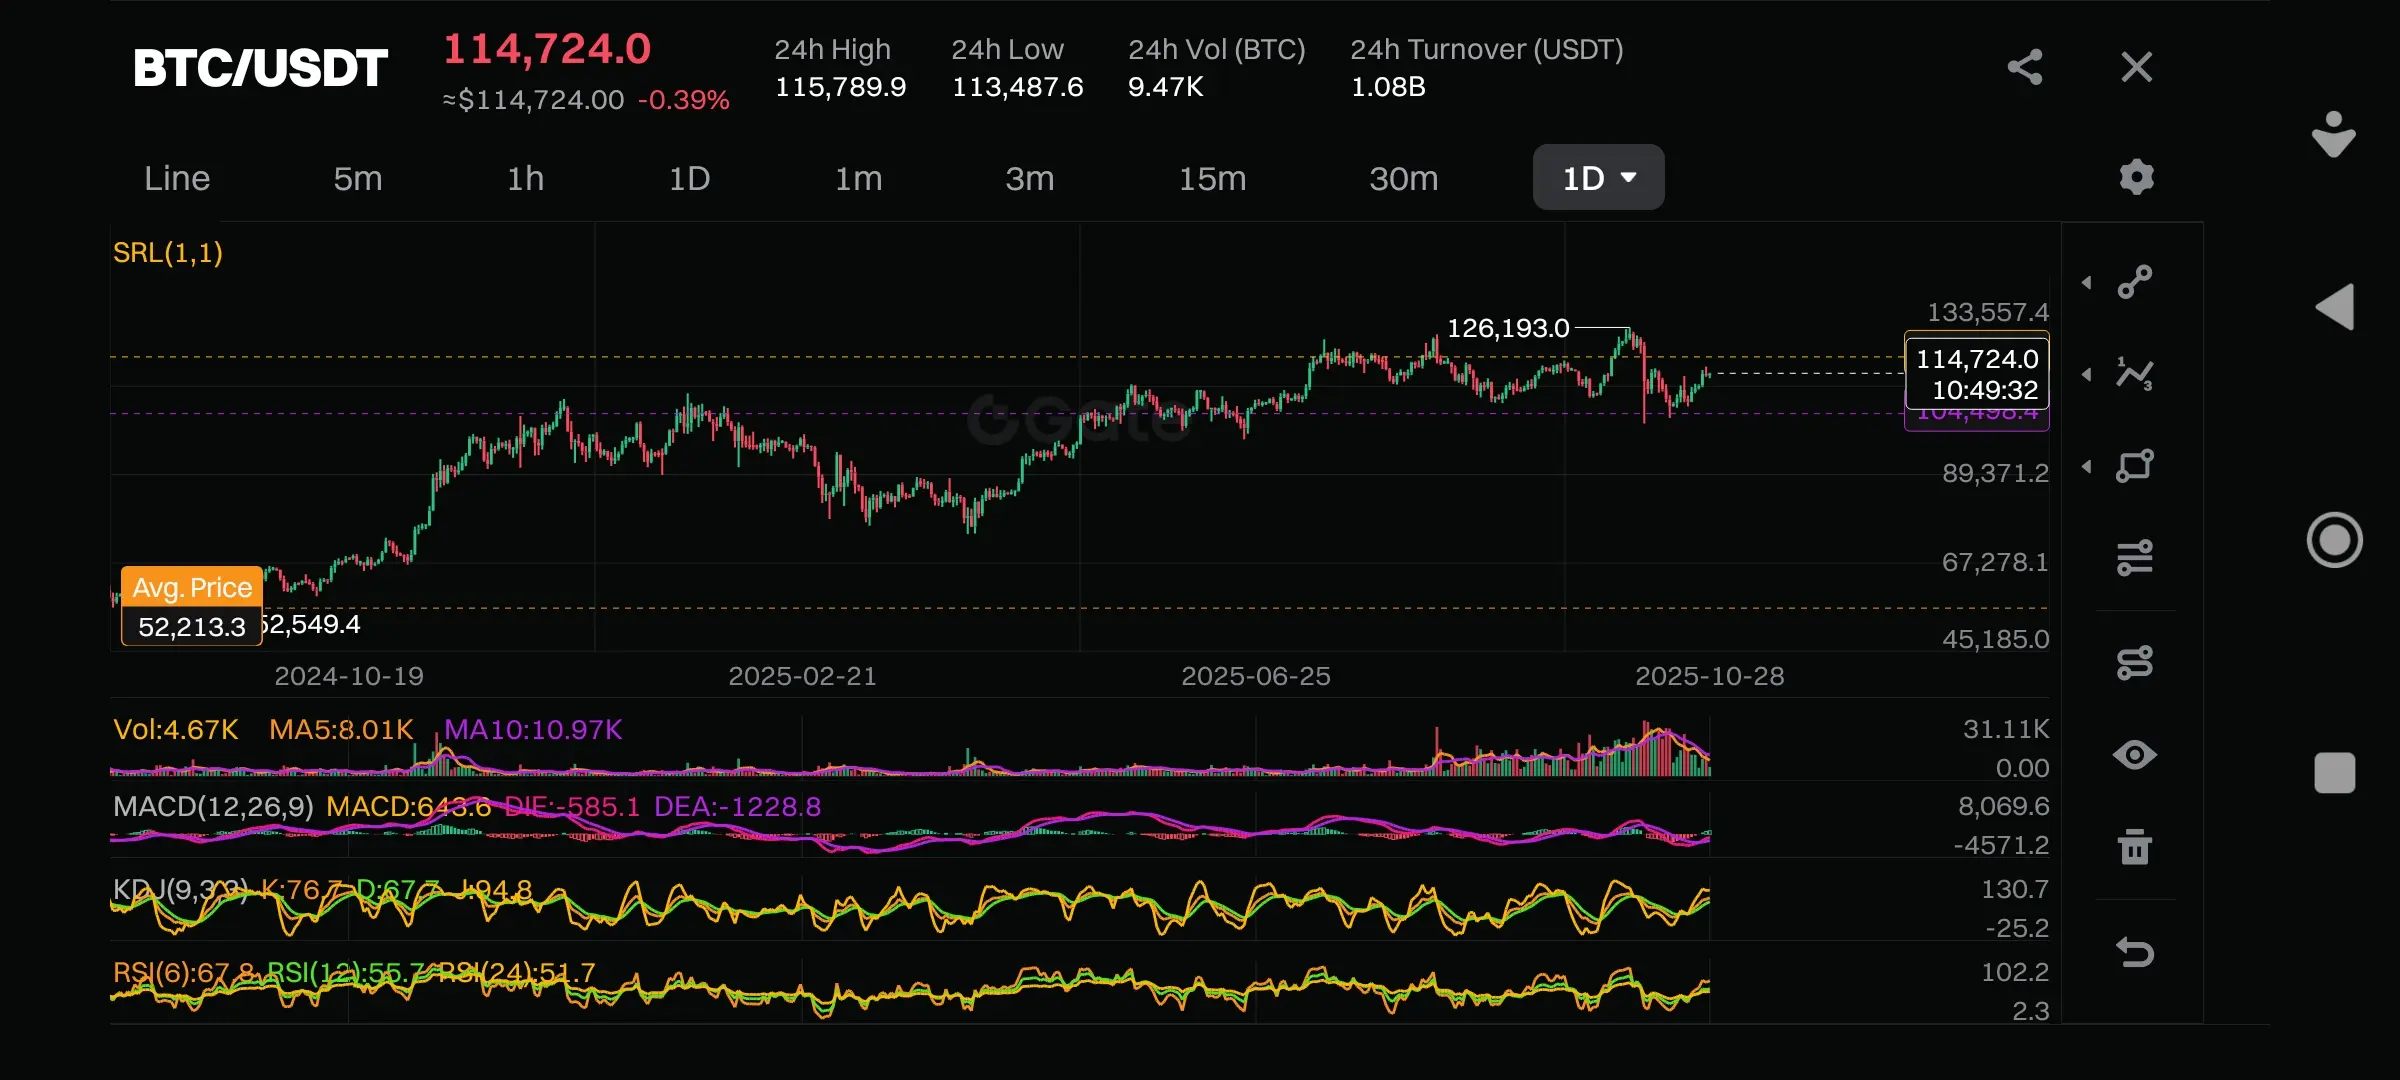
#WillBTCHit120K
📈 Market Insights Weekly: Weekly Forecast Challenge
💡 My forecast:
I believe that BTC will not reach the $120K level this week. Moreover, there is still a risk of correction, and one of the key factors could be an unfilled GAP on the CME chart.
📉 Technical analysis justification:
· Current price: $114,724. BTC is in a consolidation zone below the key resistance of $115,789 (24 h High ).
· Indicators signal overbought conditions:
· RSI(9) = 87.4 — indicates strong overboughtness. Historically, such levels often precede a correction or sideways movement.
· MACD: Positive
BTC3.88%
View Original
post-image
  • Reward
  • 24
  • Repost
  • Share
Asiftahsinvip:
1000x Vibes 🤑
View More
  • Trending TopicsView More
  • Pin
Trade Crypto Anywhere Anytime
qrCode
Scan to download Gate App
Community
English
  • 简体中文
  • English
  • Tiếng Việt
  • 繁體中文
  • Español
  • Русский
  • Français (Afrique)
  • Português (Portugal)
  • Bahasa Indonesia
  • 日本語
  • بالعربية
  • Українська
  • Português (Brasil)