

How are you everyone? Hope you all are doing well. Today my Wi-Fi internet line got disconnected, so there will be no livestream today. I’ll be back tomorrow at the usual time once it’s fixed.
Trade
Trading Type
Spot
Trade crypto freely
Alpha
Points
Get promising tokens in streamlined on-chain trading
Pre-Market
Trade new tokens before they are officially listed
Margin
Magnify your profit with leverage
Convert & Block Trading
0 Fees
Trade any size with no fees and no slippage
Leveraged Tokens
Get exposure to leveraged positions simply
Futures
Futures
Points
Hundreds of contracts settled in USDT or BTC
Options
HOT
Trade European-style vanilla options
Unified Account
Maximize your capital efficiency
Demo Trading
Futures Kickoff
Get prepared for your futures trading
Futures Events
Participate in events to win generous rewards
Demo Trading
Use virtual funds to experience risk-free trading
Earn
Launch
CandyDrop
Collect candies to earn airdrops
Launchpool
Quick staking, earn potential new tokens
HODLer Airdrop
Hold GT and get massive airdrops for free
Launchpad
Be early to the next big token project
Alpha Points
New
Trade on-chain assets and enjoy airdrop rewards!
Futures Points
New
Earn futures points and claim airdrop rewards
Investment
Simple Earn
Earn interests with idle tokens
Auto-Invest
Auto-invest on a regular basis
Dual Investment
Buy low and sell high to take profits from price fluctuations
Soft Staking
Earn rewards with flexible staking
Crypto Loan
0 Fees
Pledge one crypto to borrow another
Lending Center
One-Stop Lending Hub
VIP Wealth Hub
New
Customized wealth management empowers your assets growth
Private Wealth Management
Customized asset management to grow your digital assets
Quant Fund
Top asset management team helps you profit without hassle
Staking
Stake cryptos to earn in PoS products
BTC Staking
HOT
Stake BTC and earn 10% APR
GUSD Minting
New
Use USDT/USDC to mint GUSD for treasury-level yields
More
Asiftahsin
Share Crypto Related Market Analysis, Share Crypto Related knowledge for my follower(brother and Sister)
Asiftahsin
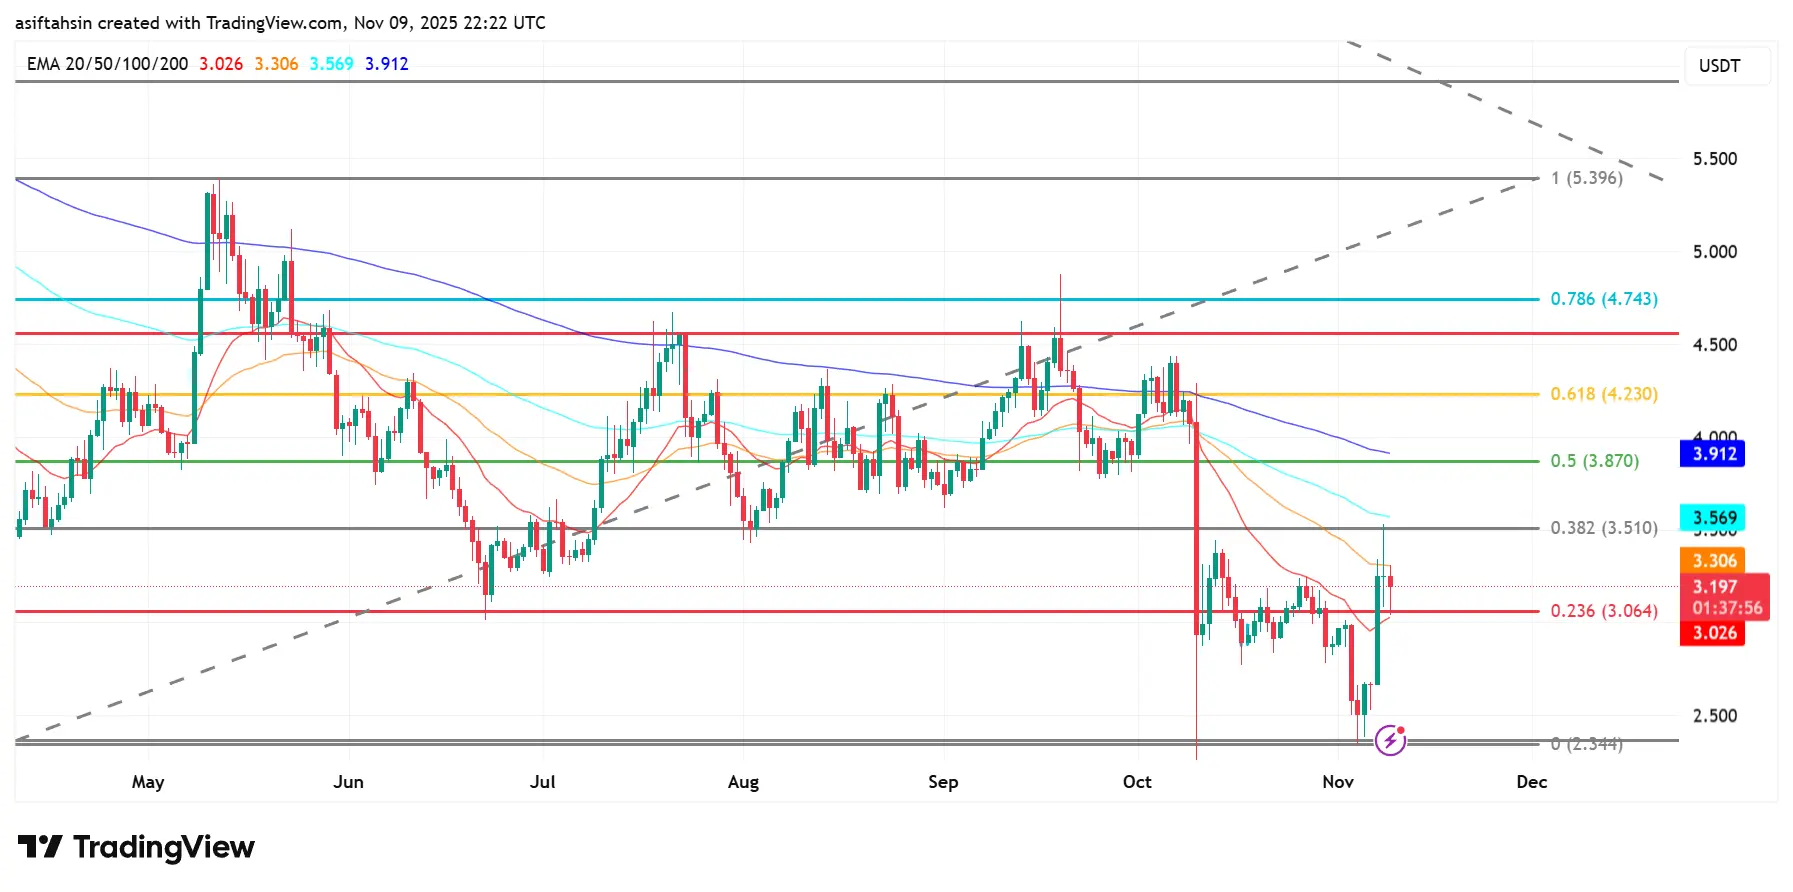
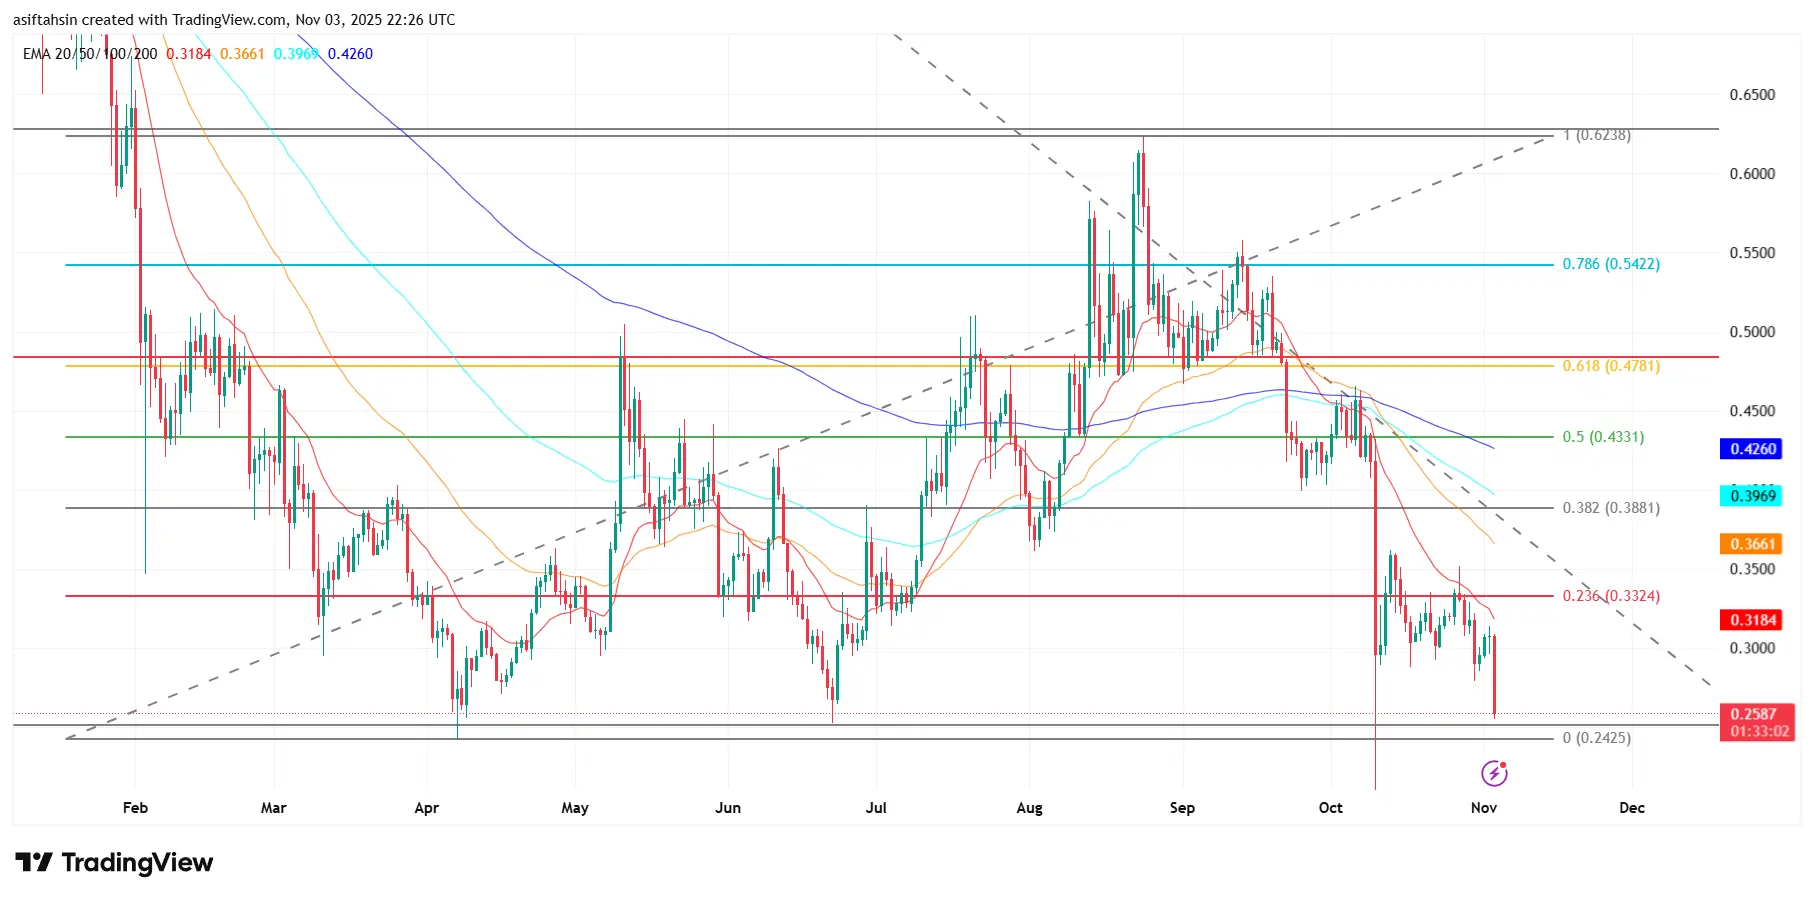
Technical Outlook for DOT (Polkadot/USDT) - Polkadot Rebounds from Lows — Can DOT Sustain Momentum Above $3.50?
Polkadot has shown a mild rebound from its recent lows near $2.53, currently trading around $3.19, reclaiming the 0.236 Fib level ($3.06). However, the price still faces multiple resistance layers ahead.
📊 Key Technical Levels:
Immediate Resistance: $3.50 (0.382 Fib)
Major Resistance: $3.87 (0.5 Fib) and $4.23 (0.618 Fib)
Support Zone: $3.06 (Fib 0.236) and $2.53 (recent low)
EMA Levels:
20 EMA: $3.02
50 EMA: $3.30
100 EMA: $3.56
200 EMA: $3.91
The RSI (53) indicates slight bullish
DOT0.65%
- Reward
- 3
- 3
- Repost
- Share
ToranTuo :
:
2025 GOGOGO 👊View More
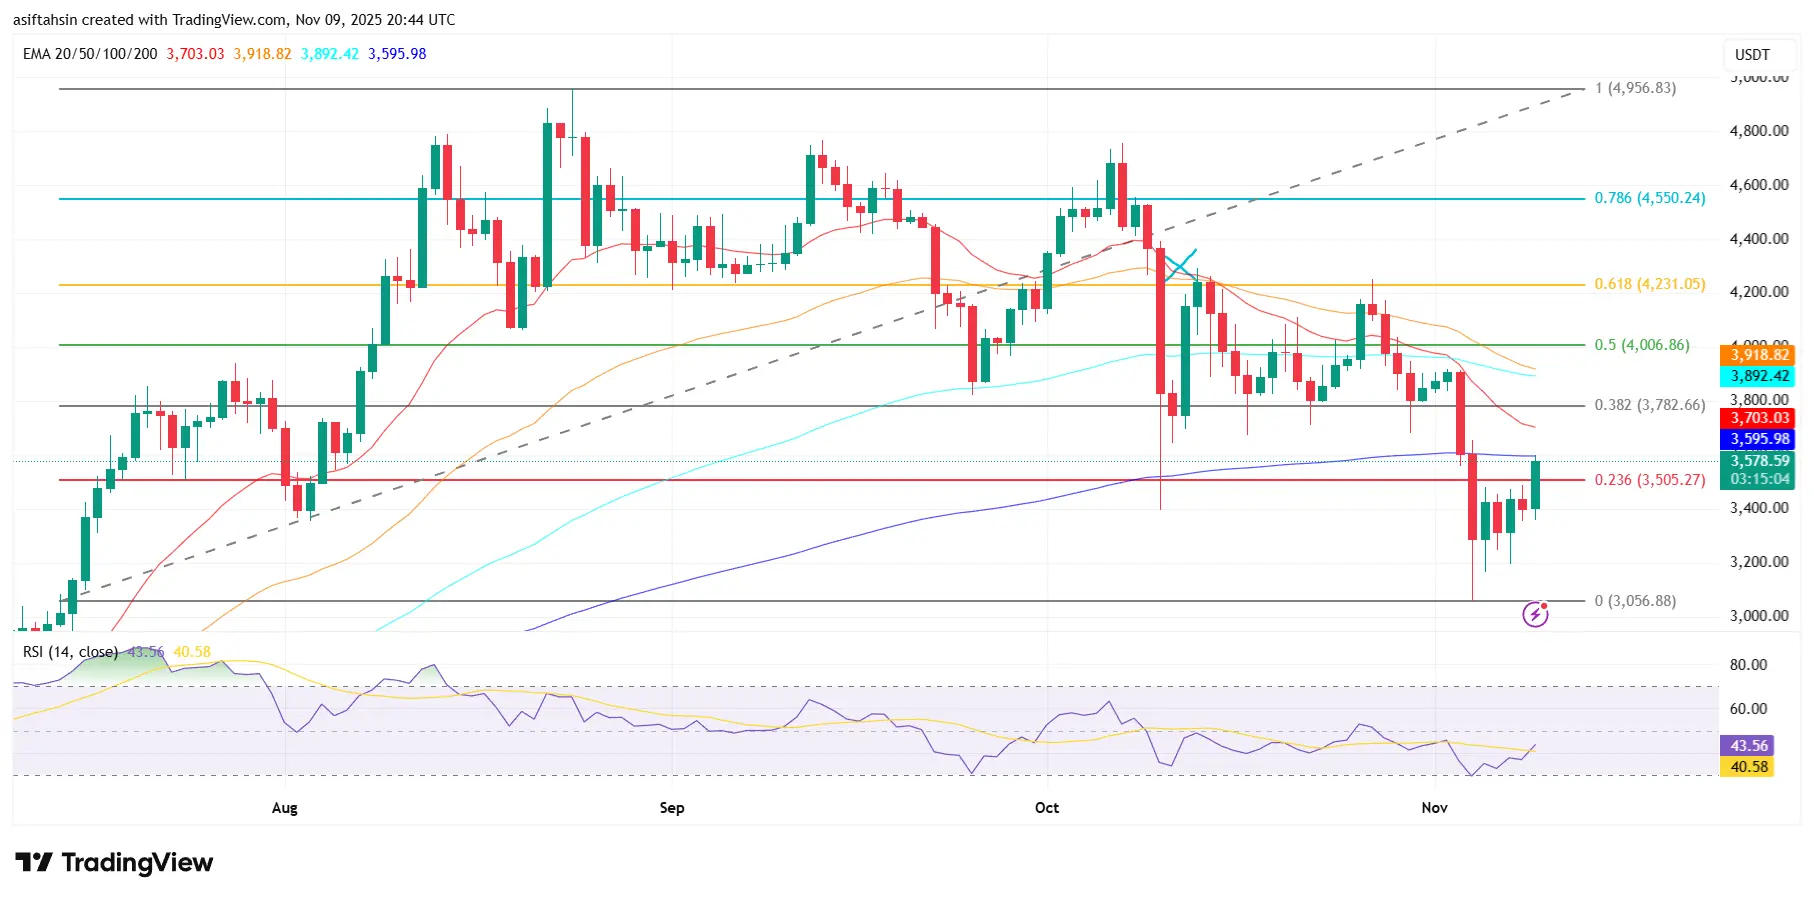
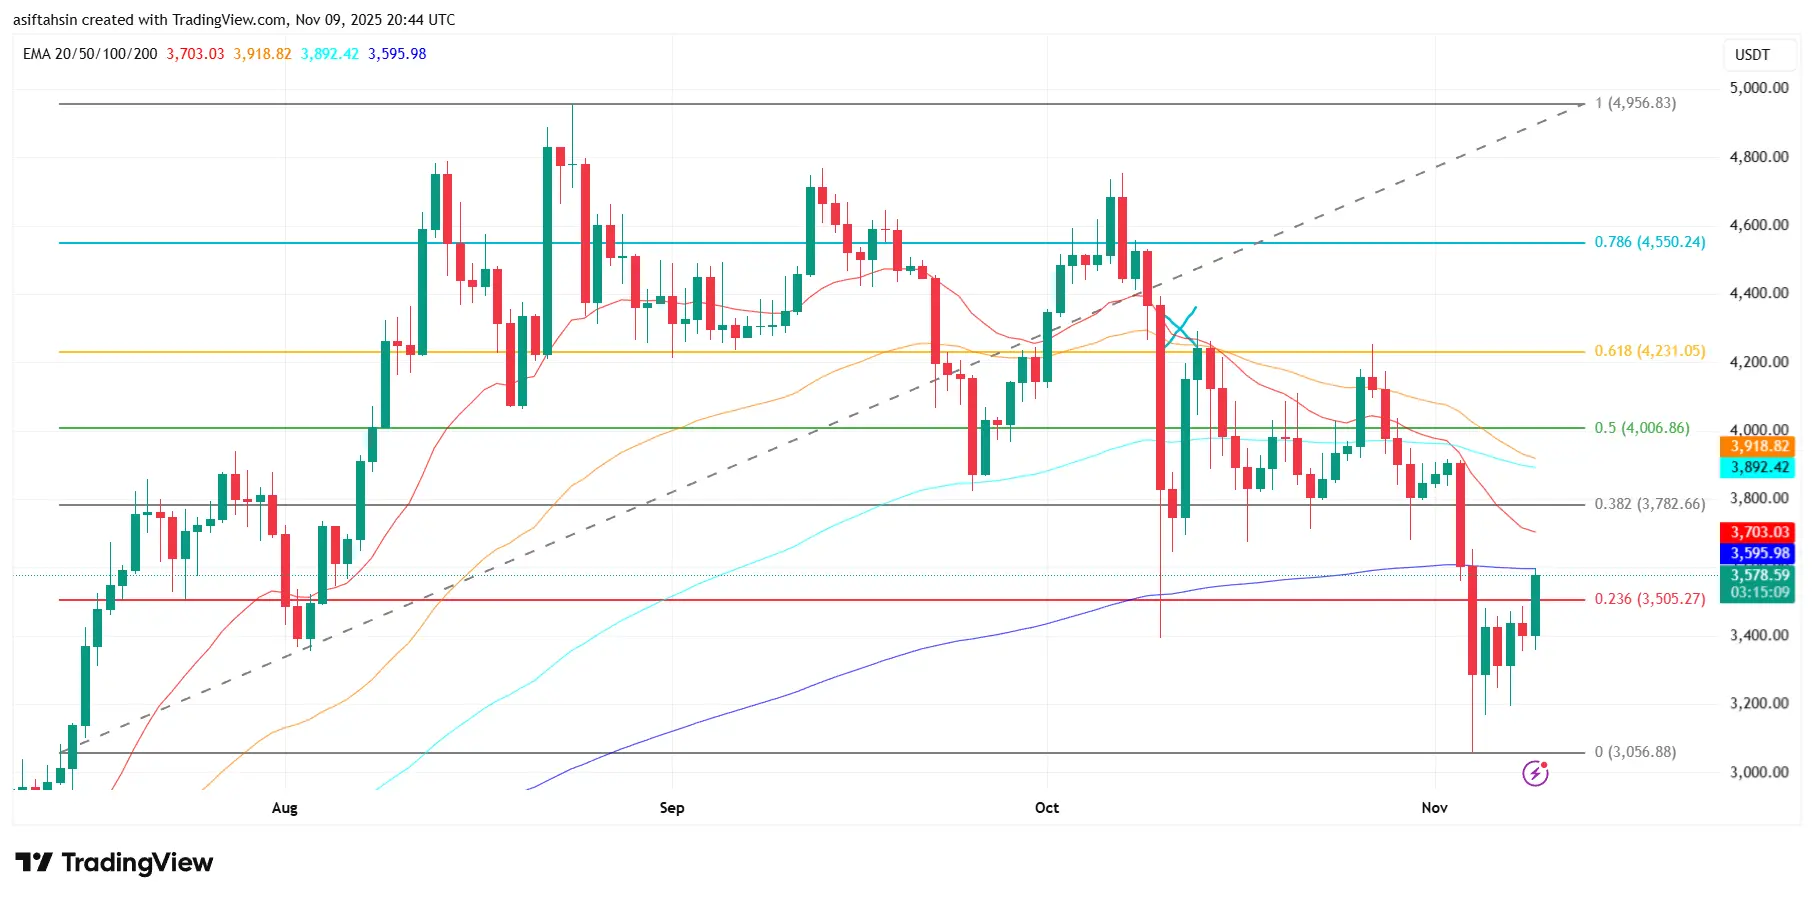
Technical Outlook for ETH - ETH Rebounds from Support — Bulls Eye Recovery Toward $3,800 Zone
ETH is showing signs of recovery after finding strong support near $3,050, rebounding back above the Fib 0.236 retracement level at $3,505. The recent bounce suggests that buyers are gradually regaining control after a sharp correction phase in early November.
Currently, ETH is trading around $3,570, testing the confluence area of the 20 EMA ($3,703) and the 100 EMA ($3,892) — both acting as near-term resistance levels. A decisive daily close above this zone could confirm bullish momentum, paving the
ETH7.93%
- Reward
- 4
- 4
- Repost
- Share
Ryakpanda:
Just go for it💪View More
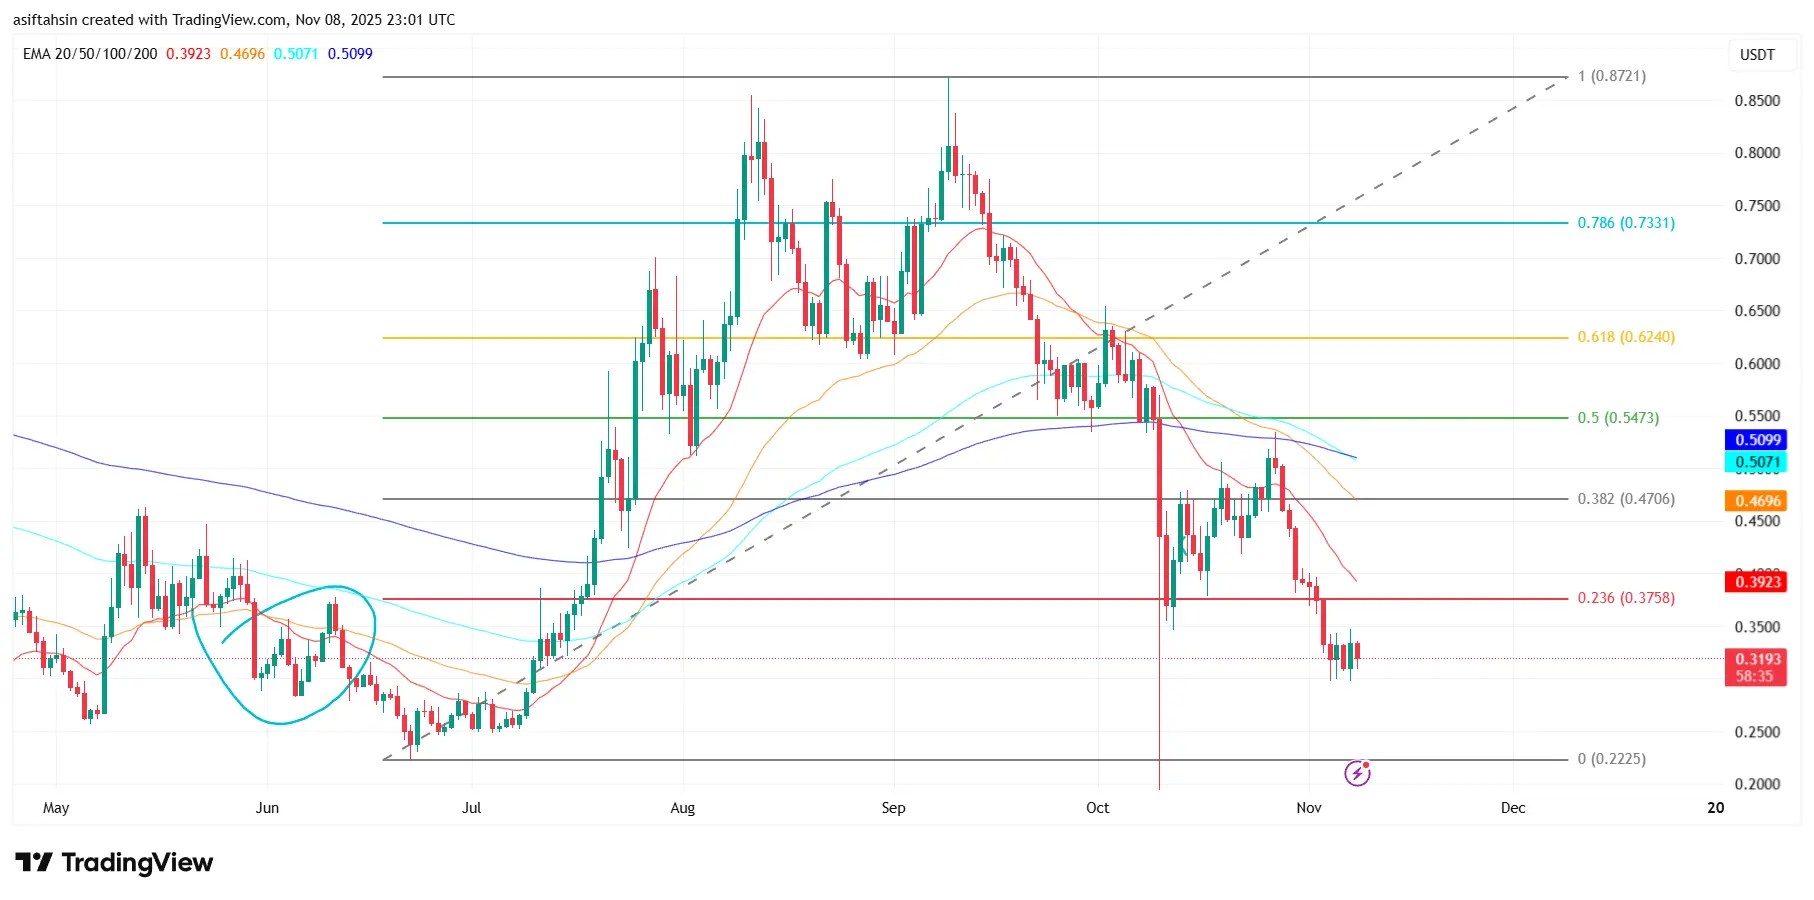
Technical Outlook for ENA - ENA Struggles Below Key EMAs — Market Awaits Break Above $0.37
ENA has been facing consistent downward pressure, currently trading around $0.32 after failing to recover from its October sell-off. Despite multiple attempts to stabilize, the price continues to remain below all major exponential moving averages, confirming that sellers are still in control of the broader trend.
Over the past few weeks, ENA has struggled to reclaim the Fib 0.236 retracement level ($0.37), which has now turned into a strong resistance barrier. A breakout above this zone would be a key te
ENA8.9%

- Reward
- 9
- 15
- Repost
- Share
JOHAR09:
1000x Vibes 🤑View More
SOL Consolidates Near $160 — Market Awaits Clear Breakout or Breakdown
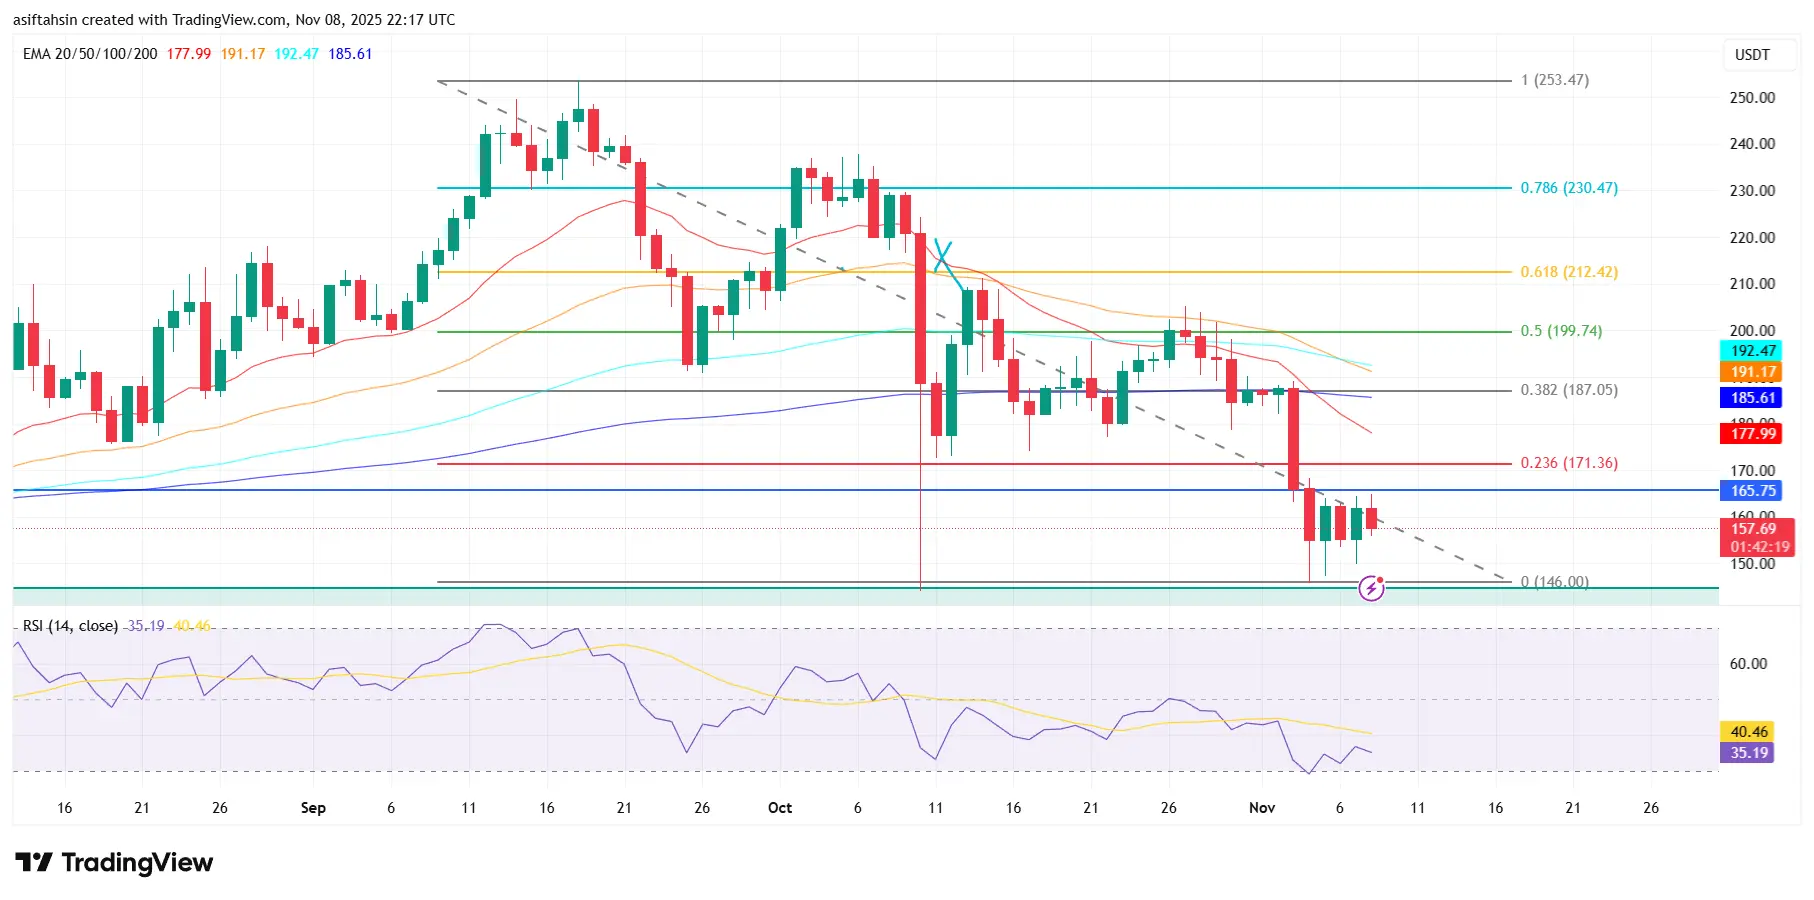
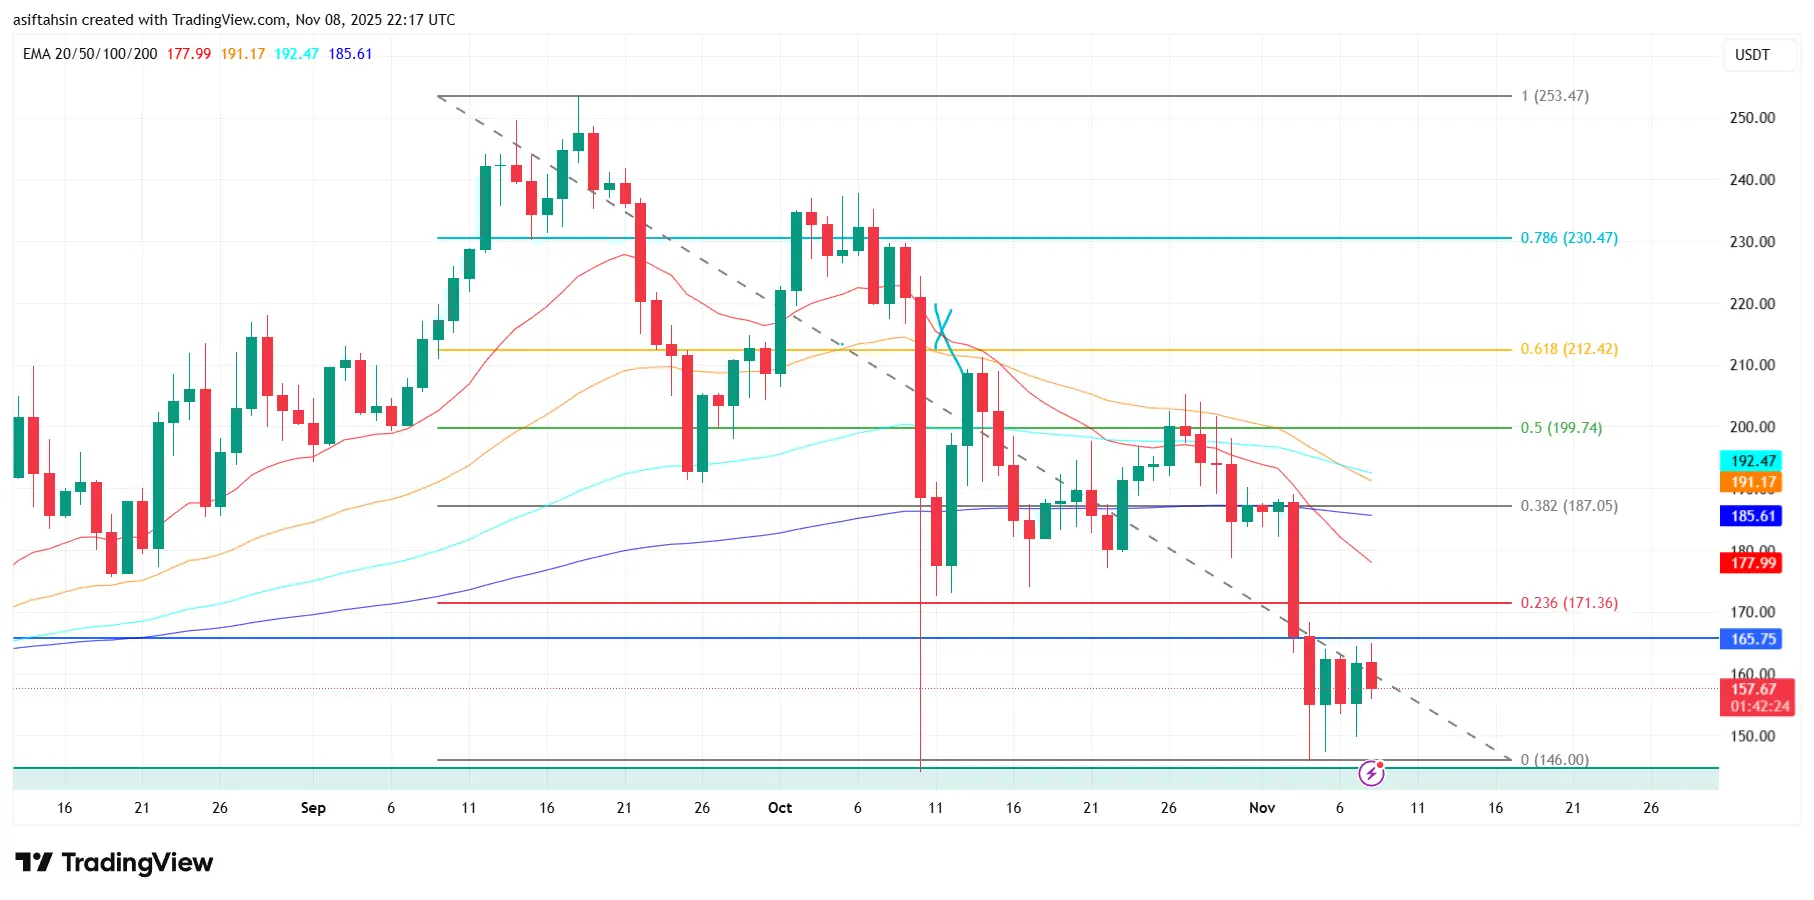
Solana (SOL) continues to consolidate around the $160 zone, showing indecision after facing repeated rejections near $175. The price remains trapped between short-term support and resistance levels, reflecting a tug-of-war between bulls and bears.
Currently, SOL is holding slightly above the 20 EMA ($158) and 50 EMA ($154), which serve as near-term supports. A decisive break below these levels could trigger a deeper pullback toward $147 (Fib 0.382) and $138 (Fib 0.5).
On the upside, a clean breakout above $175–$178 could re
SOL7.68%
- Reward
- 11
- 15
- Repost
- Share
JOHAR09:
1000x Vibes 🤑View More
Polkadot (DOT) Technical Outlook – Strong Rebound as Buyers Defend Multi-Month Support
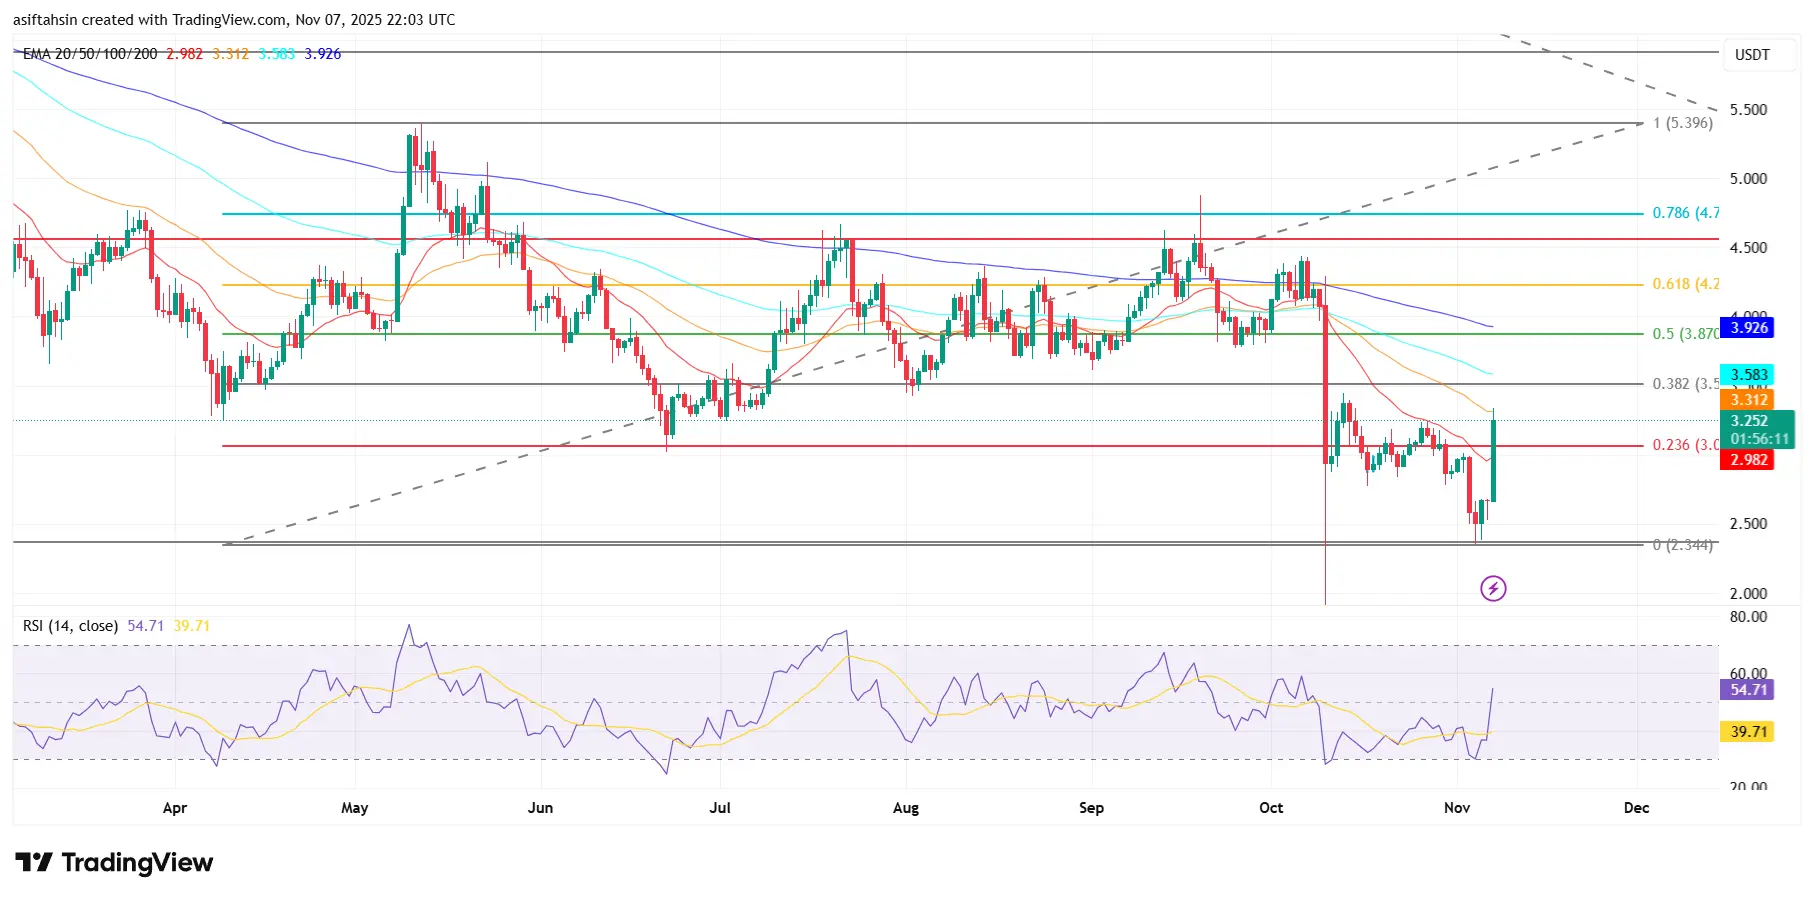
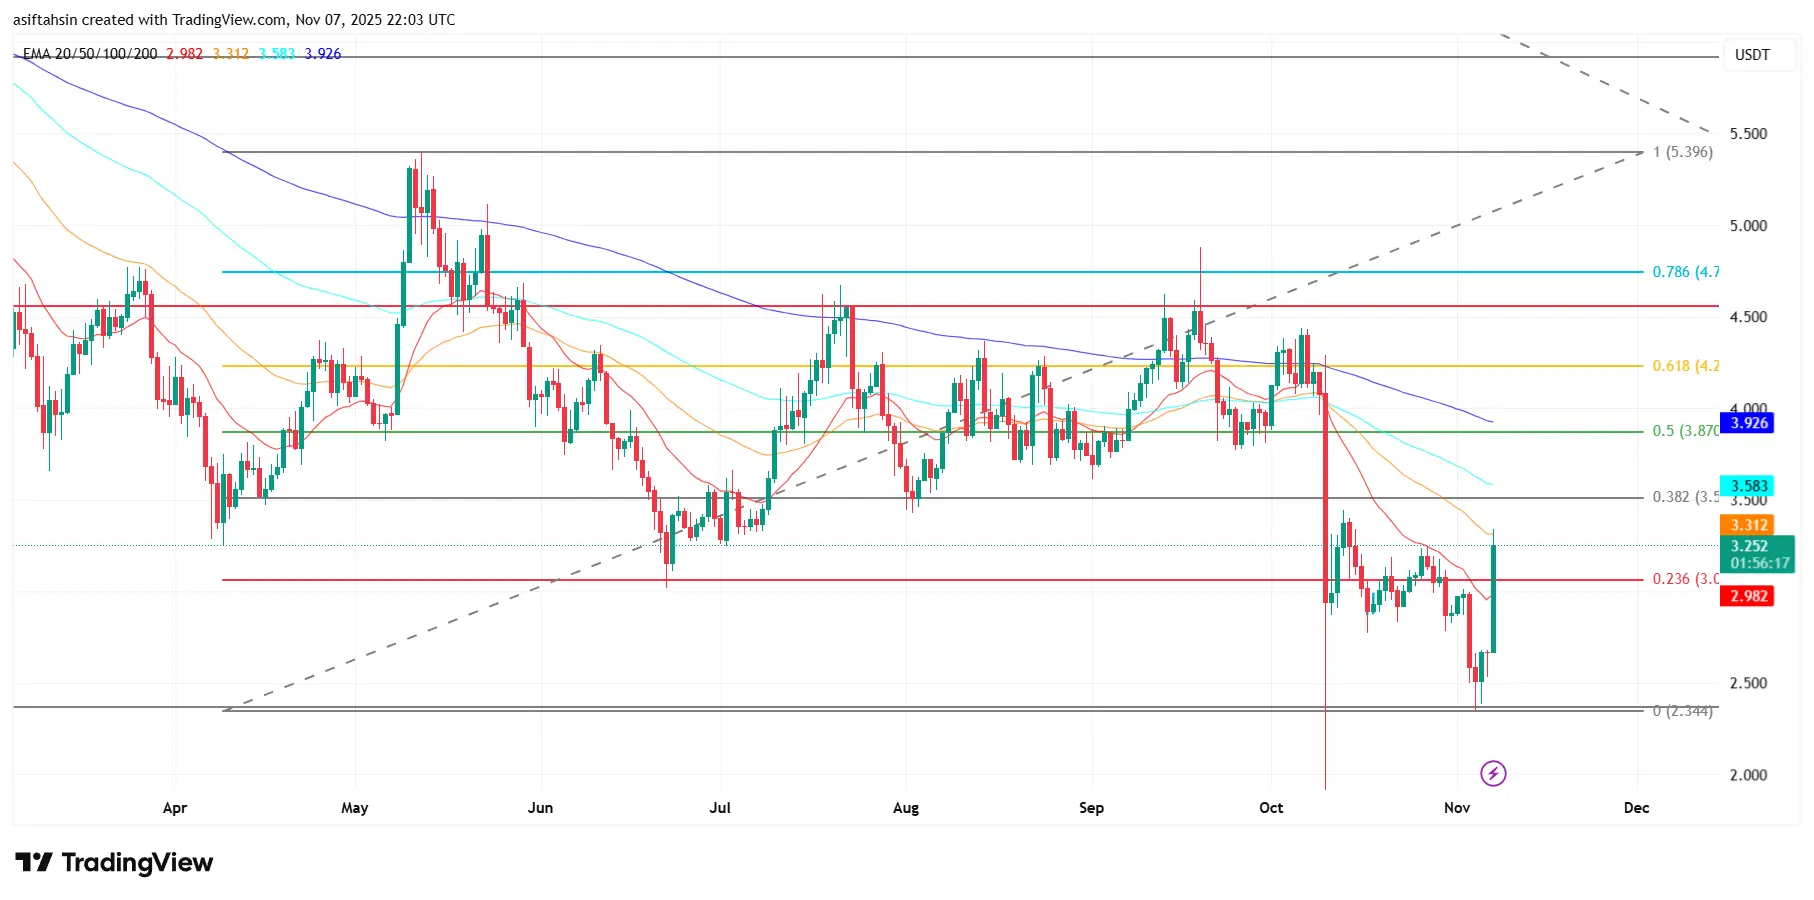
Polkadot (DOT) has posted a sharp recovery after finding solid support near the $2.34 zone (Fibonacci 0 level), rebounding by over 35% in just a few sessions. The token is now trading around $3.25, reclaiming the 0.236 Fib level ($3.06) and showing signs of renewed bullish momentum.
The next major resistance lies at $3.31–$3.58, aligning with the 20 EMA ($2.98) and 50 EMA ($3.31) cluster. A breakout above $3.58 (0.382 Fib) could open the path toward $3.87 (0.5 Fib) and $4.20 (0.618 Fib) — critical levels tha
DOT0.65%
- Reward
- 11
- 14
- Repost
- Share
JOHAR09:
1000x Vibes 🤑View More
- Reward
- 10
- 11
- Repost
- Share
JOHAR09:
1000x Vibes 🤑View More
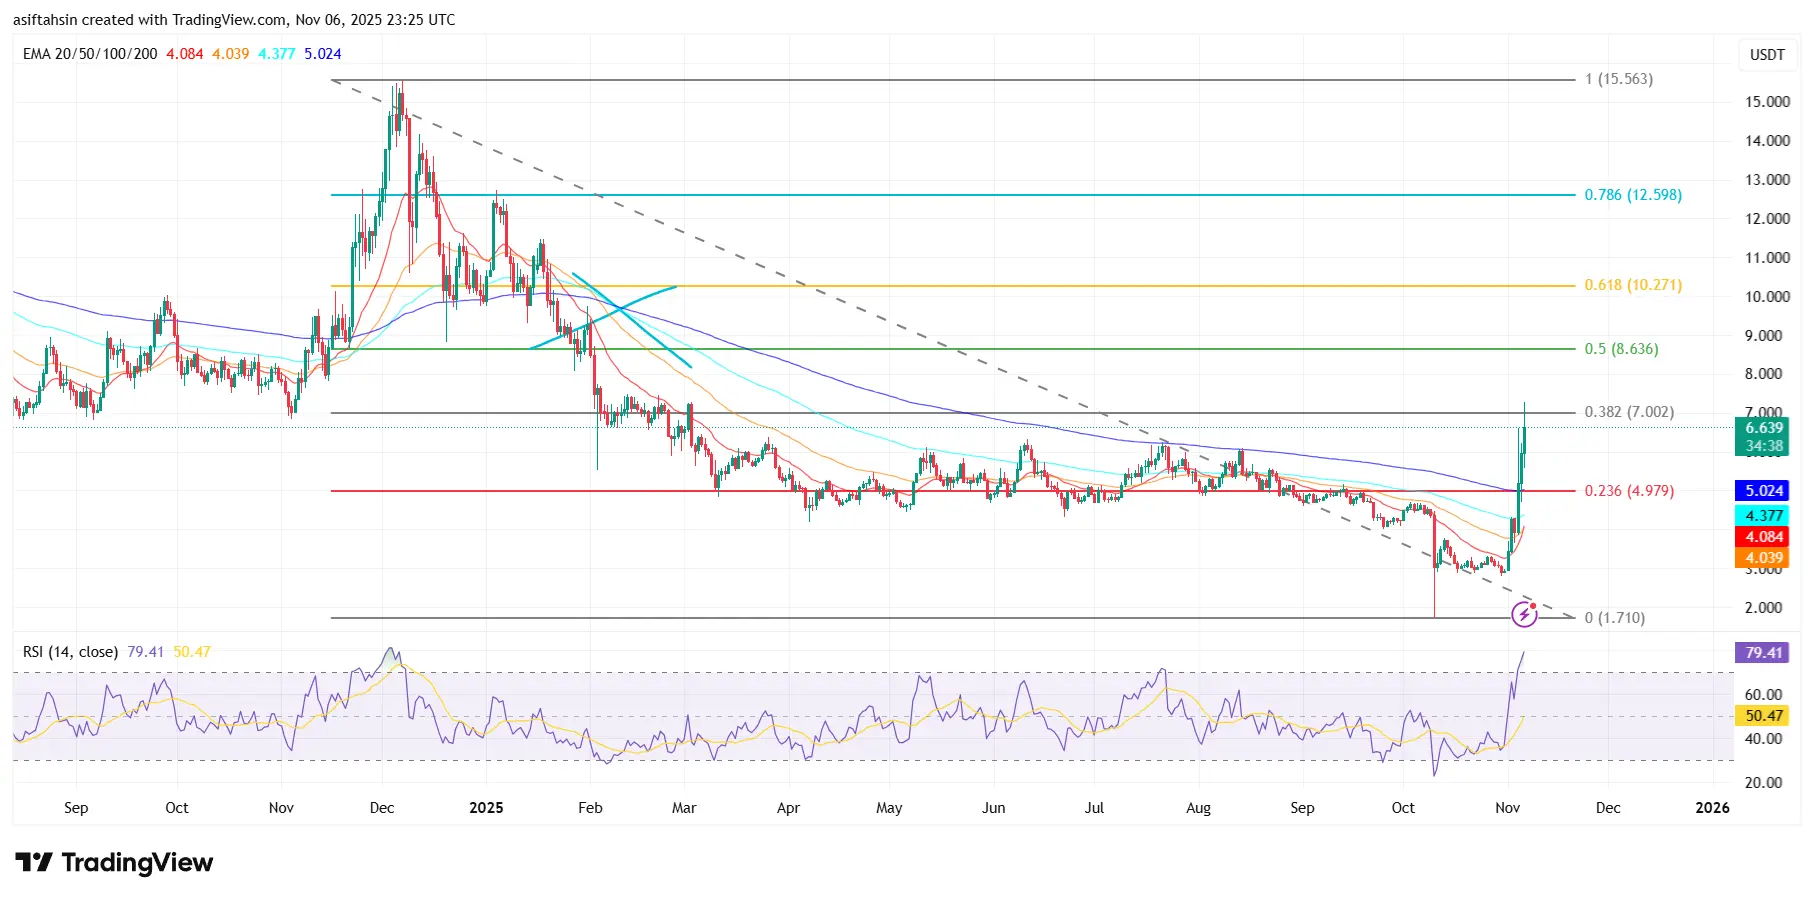
Technical Outlook for ICP - ICP Price Explodes Above Key EMAs, Eyeing $7 Resistance Next
ICP has shown a strong bullish breakout, surging toward $6.63 after a prolonged period of consolidation. The move marks a significant shift in market sentiment as price decisively broke above the descending trendline that had capped ICP since early 2025.
This rally pushed ICP through multiple resistance levels, including the 20 EMA ($4.08), 50 EMA ($4.03), and 100 EMA ($4.37) — all of which are now turning into potential short-term support zones. The price also cleared the Fib 0.236 retracement at $4.97, i
ICP-8.08%

- Reward
- 11
- 10
- Repost
- Share
MominurRahman990 :
:
HODL Tight 💪View More
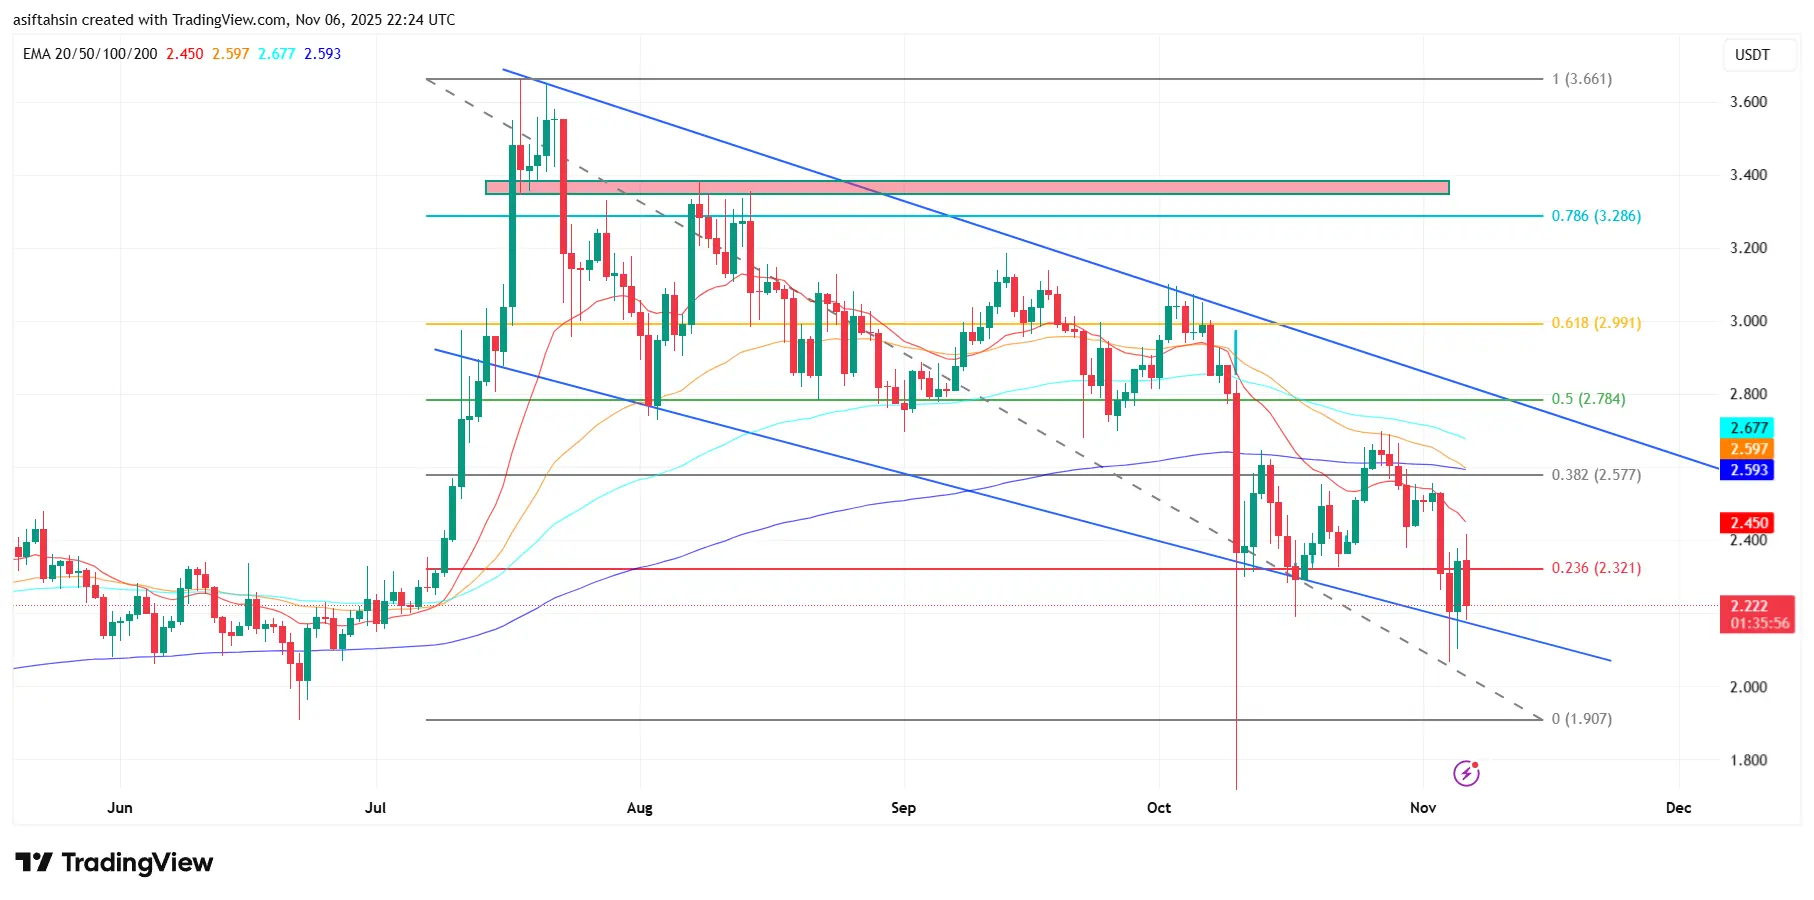
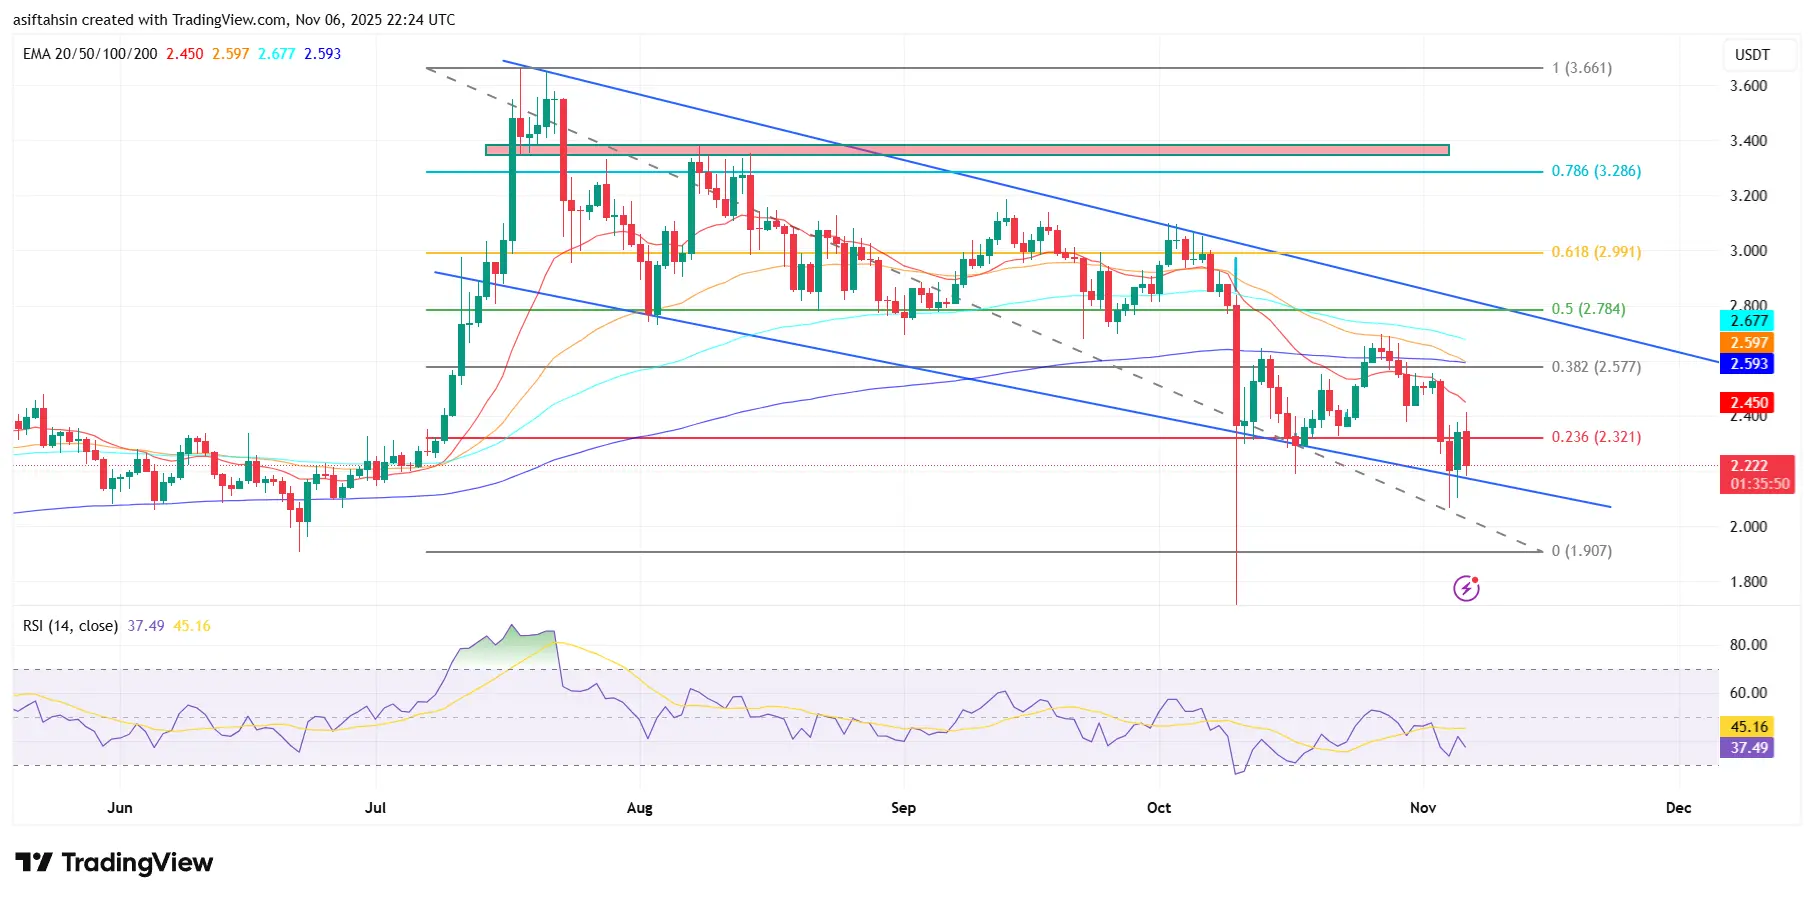
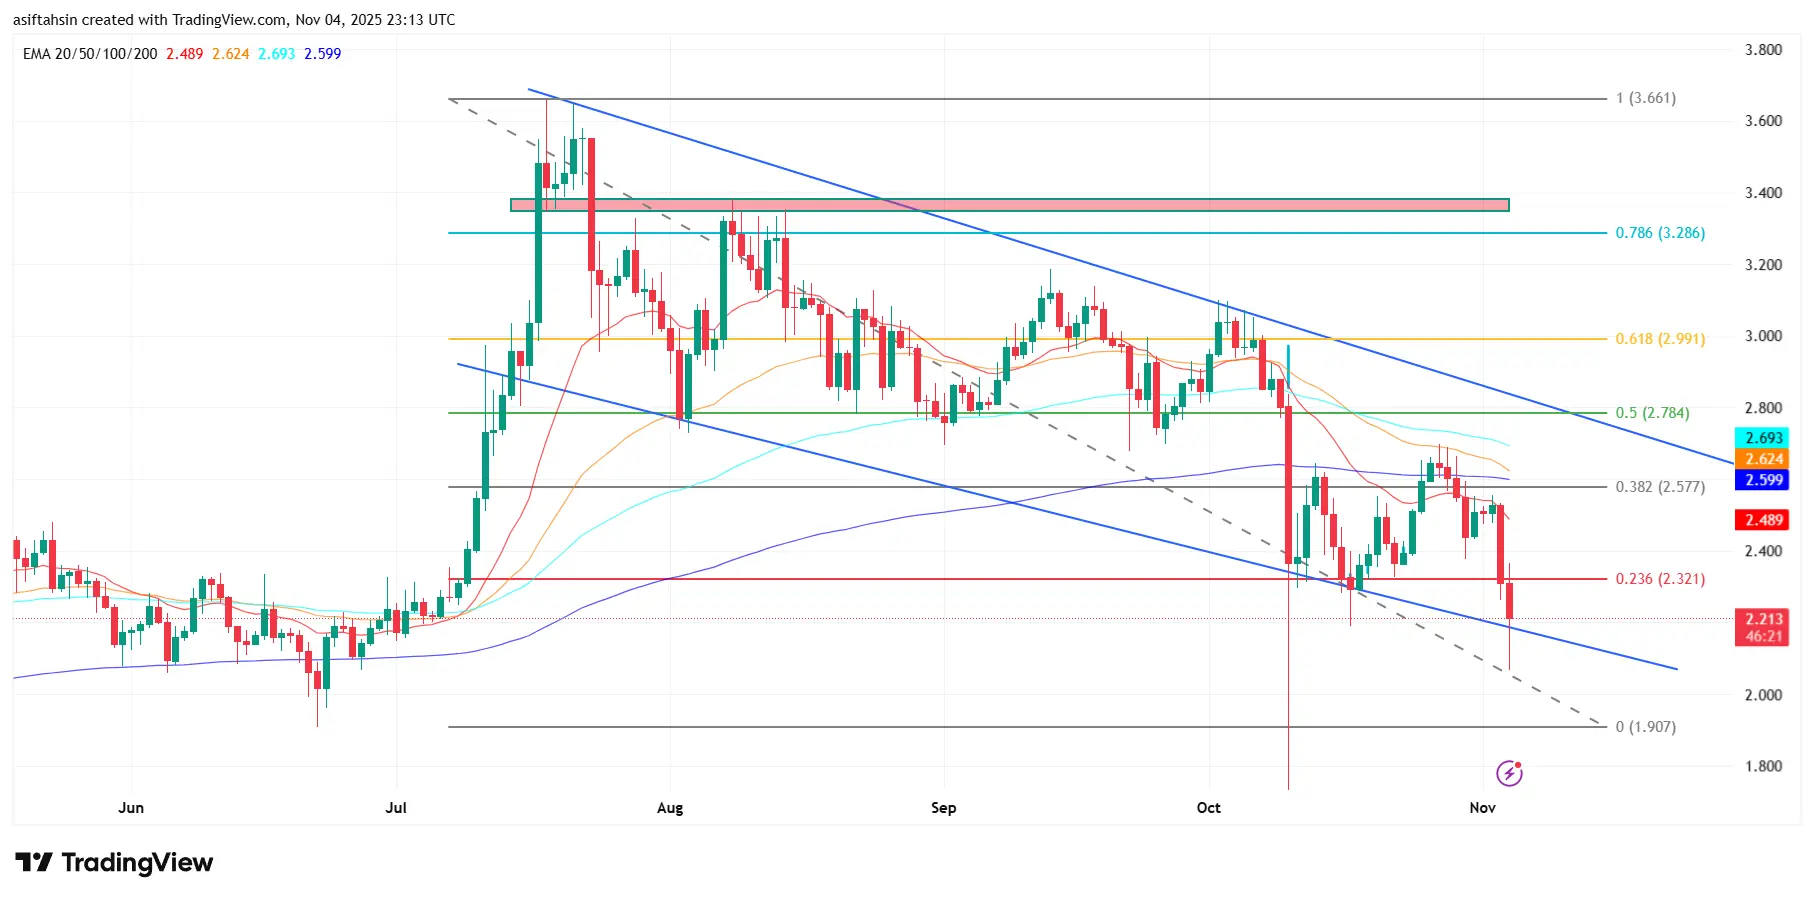
Technical Outlook For XRP: XRP Holds Above Key Trendline Support Near $2.20
XRP continues to trade within a descending channel, showing signs of consolidation after a sharp decline toward the $2.20 support zone. The token has managed to hold this crucial level, which aligns closely with the channel bottom trendline — a potential short-term defense for bulls.
The price remains below major EMAs — 20 EMA ($2.45), 50 EMA ($2.59), 100 EMA ($2.67), and 200 EMA ($2.59) — indicating that bearish momentum still dominates the broader structure. A breakout above $2.32 (0.236 Fib) could trigger a minor r
XRP7.29%
- Reward
- 12
- 13
- Repost
- Share
MominurRahman990:
HODL Tight 💪View More
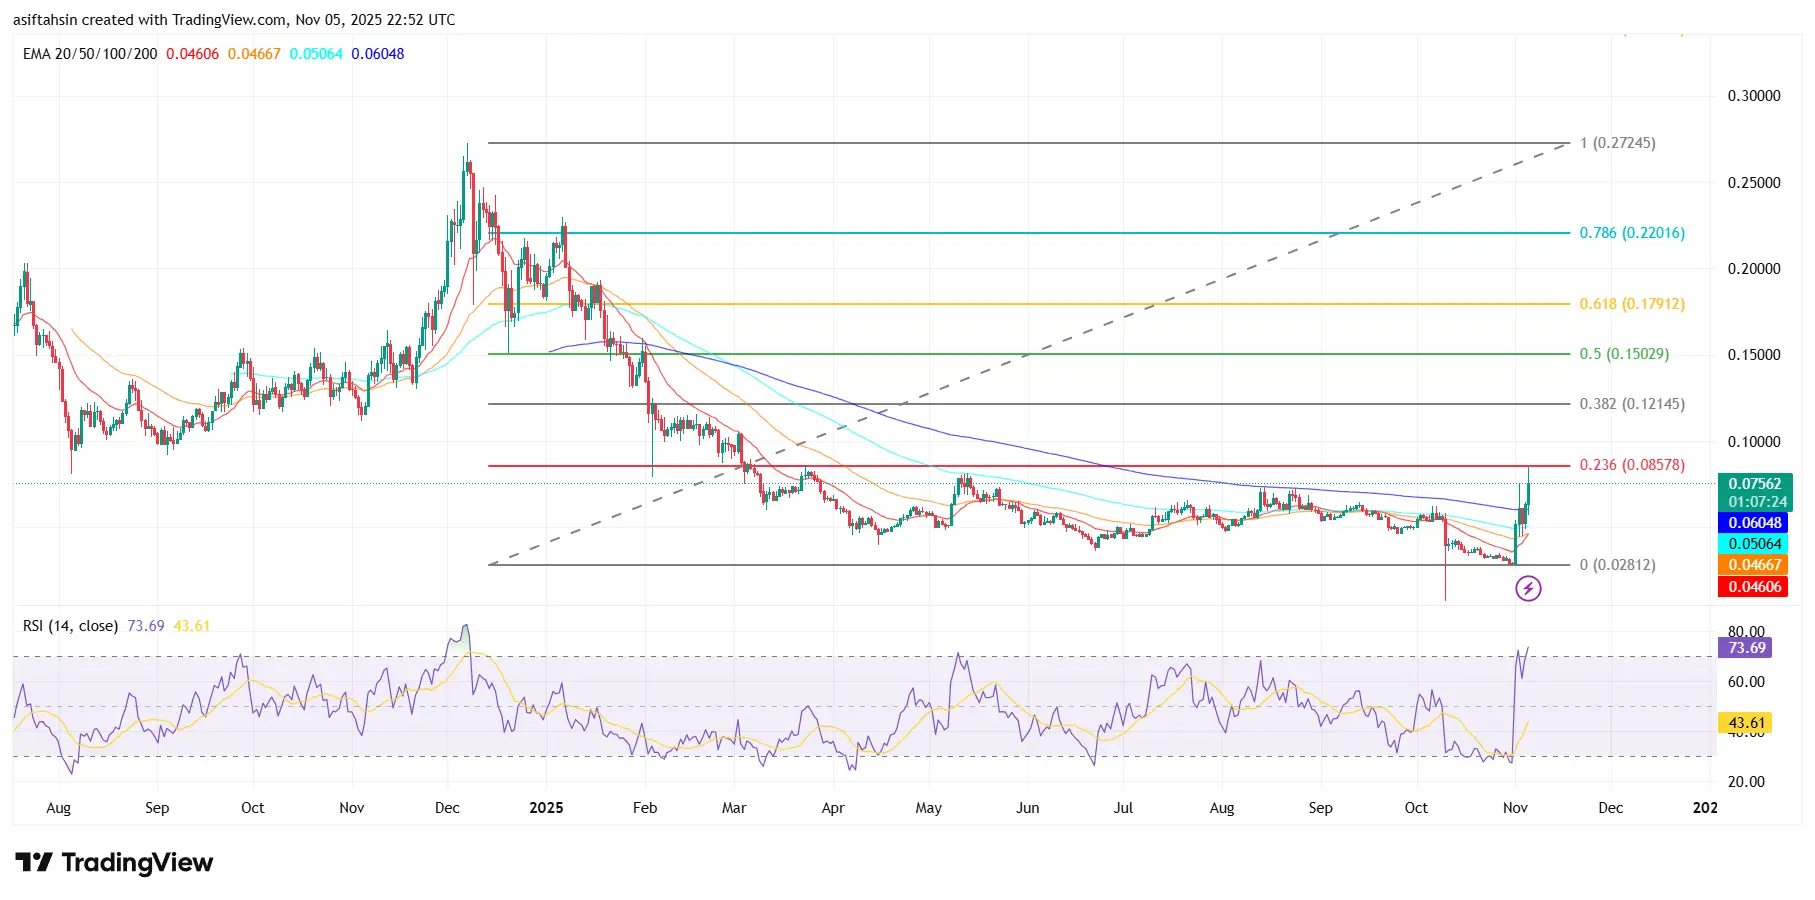
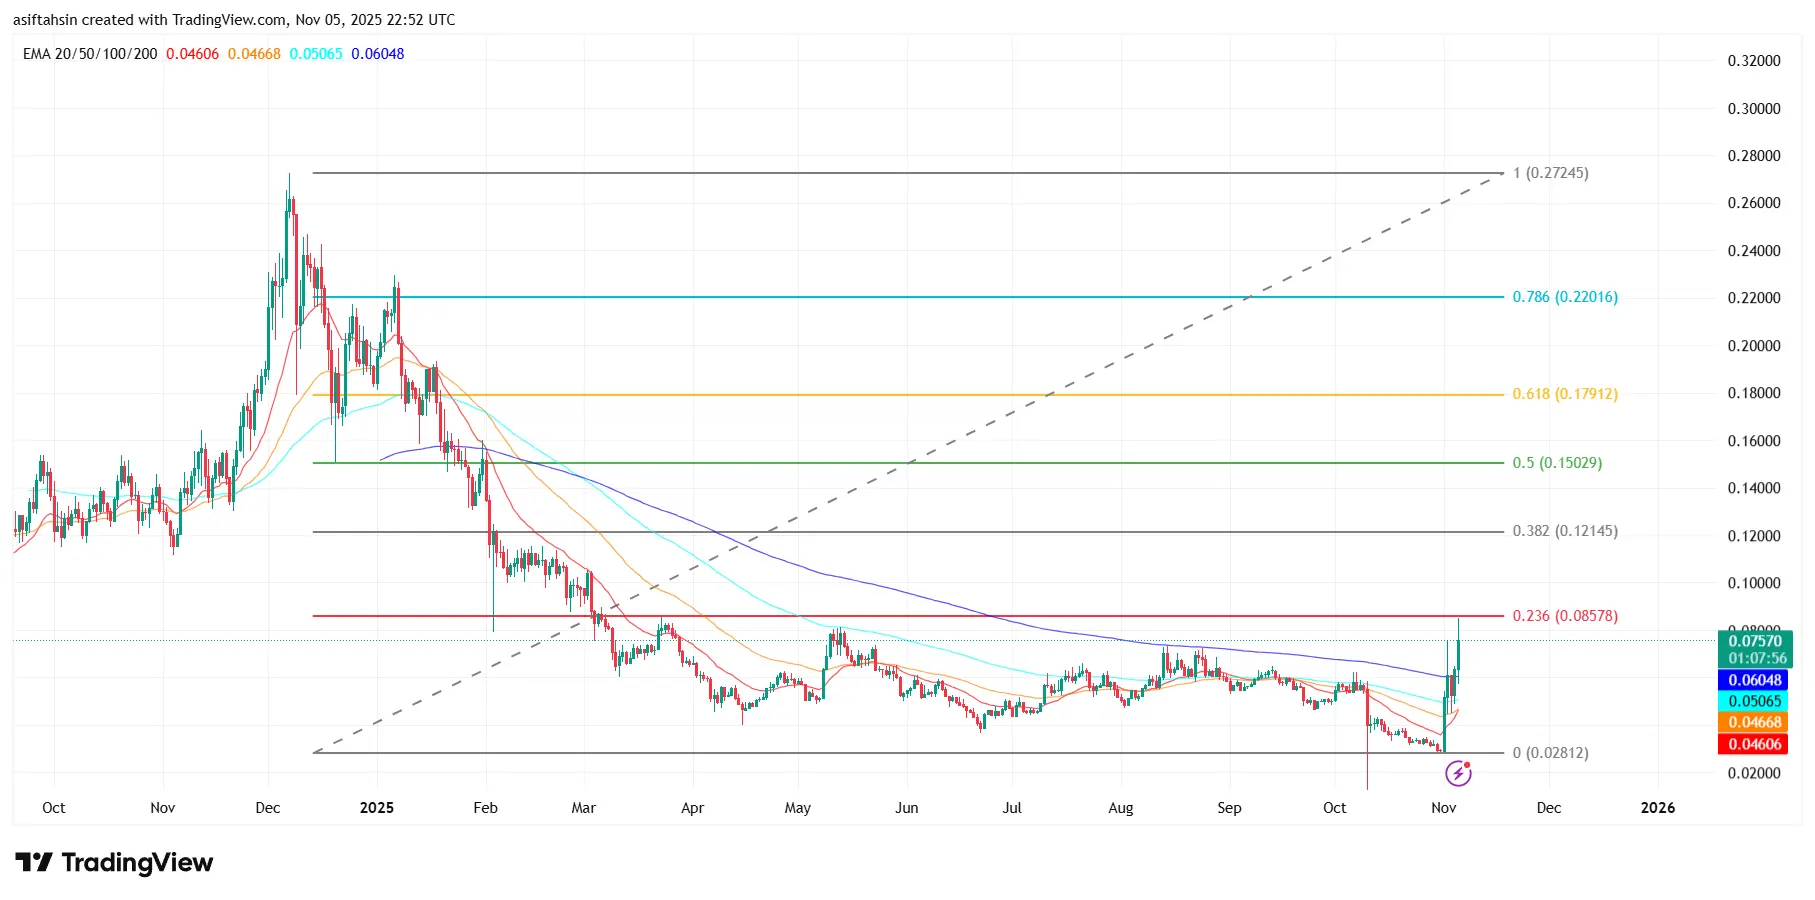
Technical Outlook For ZK : ZK Skyrockets Above Key EMAs — Testing Major Resistance at $0.085
ZK has shown a strong bullish breakout, surging past the 20, 50, 100, and 200 EMAs — a significant technical shift after months of consolidation. The token is currently testing the $0.085 resistance zone (0.236 Fib) after rebounding from its long-term base around $0.028.
Momentum remains strong, with RSI climbing to 73.6, indicating overbought conditions but reflecting intense buying pressure. If bulls sustain this move, the next resistance levels lie at $0.12 (0.382 Fib), followed by $0.15 and $0.18,
ZK3.61%
- Reward
- 8
- 8
- Repost
- Share
MominurRahman990:
HODL Tight 💪View More
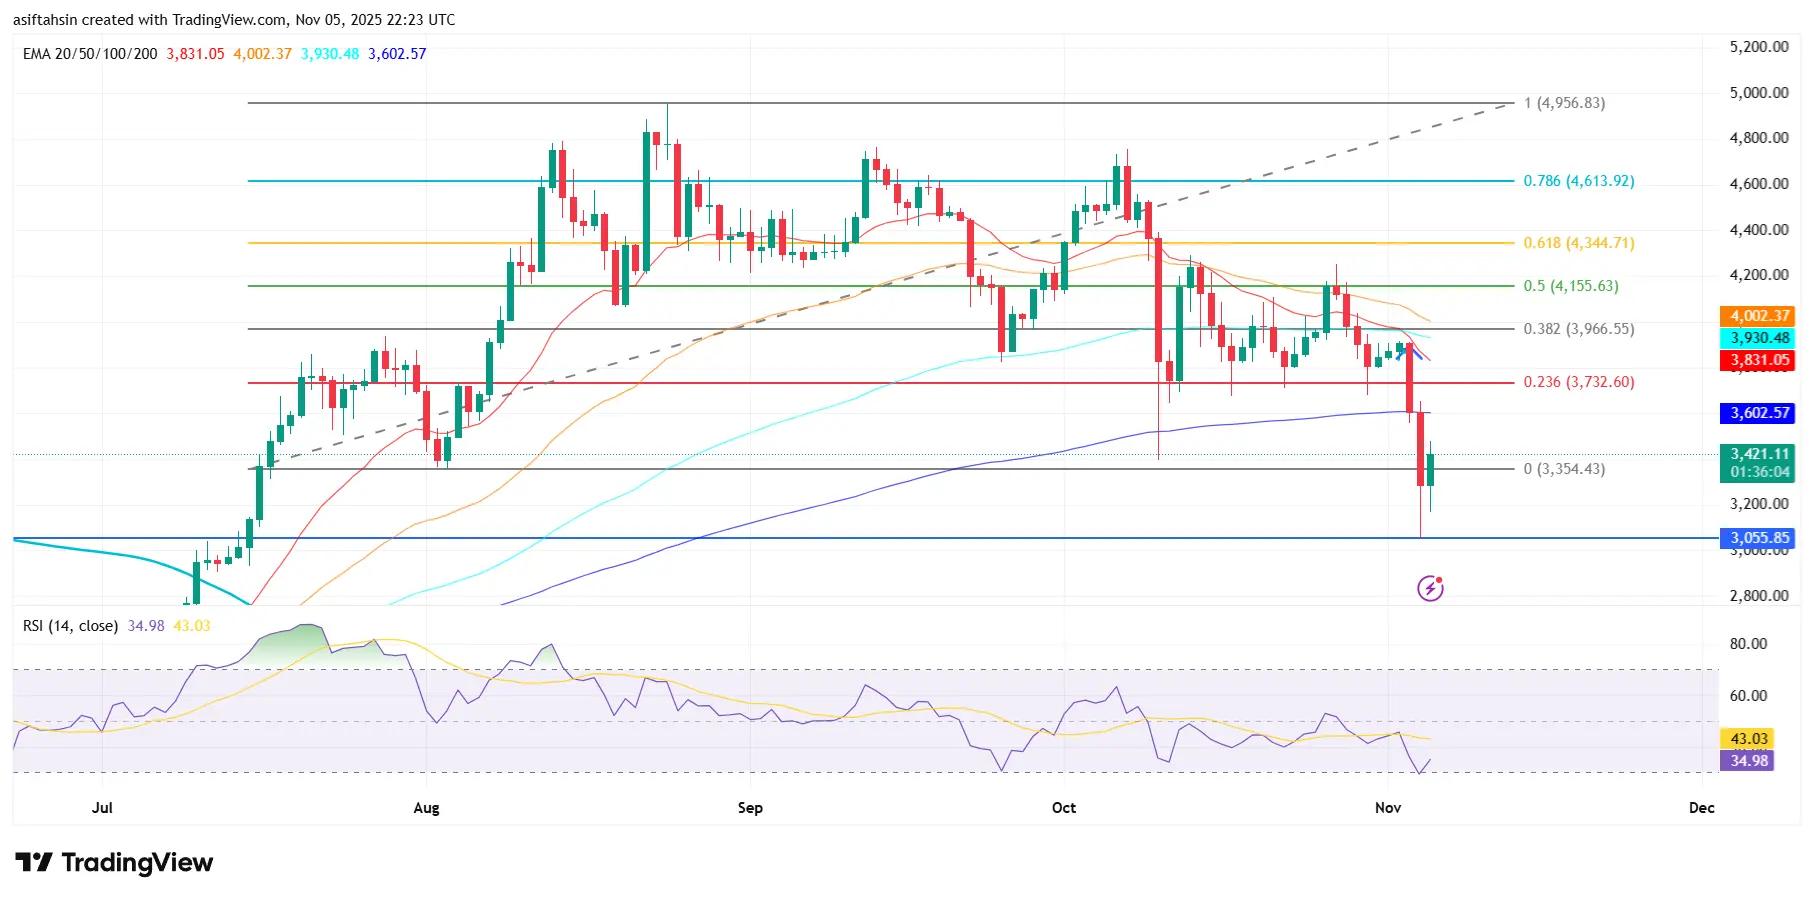
Ethereum (ETH) Technical Outlook : Ethereum Attempts Recovery After Sharp Drop Below $3,600
Ethereum (ETH) has seen a sharp correction, falling below major support levels before stabilizing near $3,350. The price has since rebounded slightly, trading around $3,420, but remains under pressure as it sits below key moving averages — signaling that bears still dominate short-term momentum.
The 20 EMA ($3,831), 50 EMA ($4,002), 100 EMA ($3,930), and 200 EMA ($3,602) are all acting as strong overhead resistance. For ETH to regain strength, a daily close above $3,730 (0.236 Fib) and $3,966 (0.382 Fib
ETH7.93%
- Reward
- 9
- 8
- Repost
- Share
Celebration:
ETH showing early signs of stabilization! Holding above $3,350 is key now if bulls can reclaim the $3,800 zone, we might see momentum shift back in their favor.View More
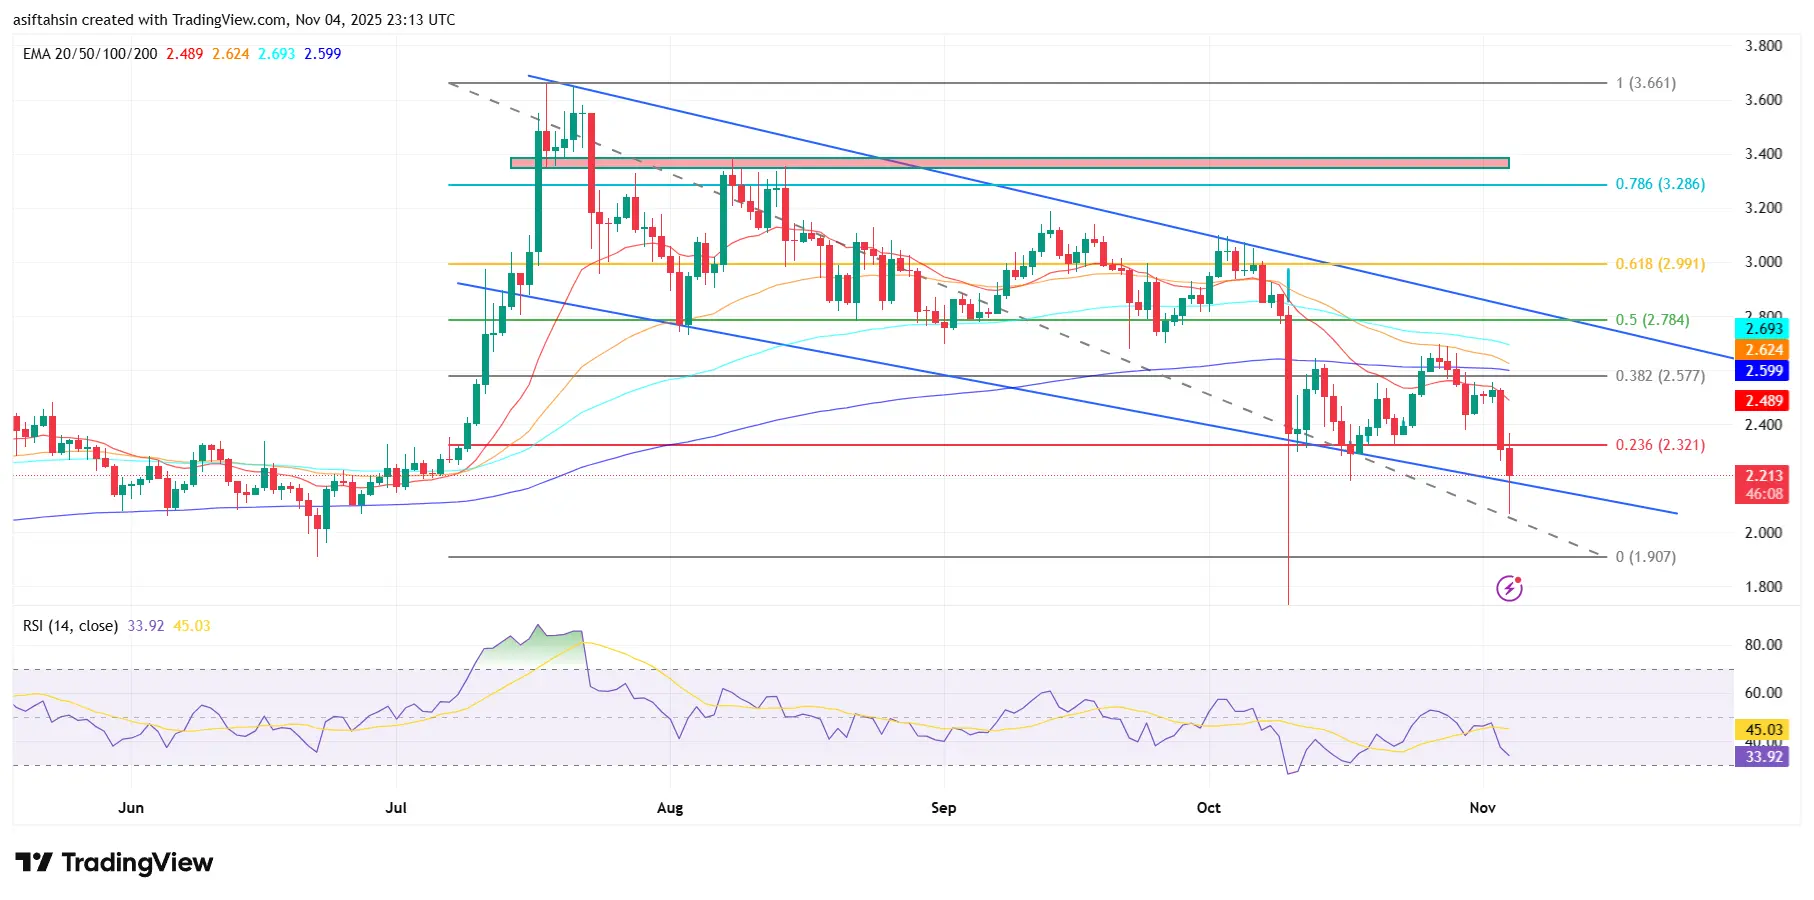
📉 XRP Technical Outlook : XRP Slides Toward $2.10 — Can Bulls Defend Key Support?
XRP continues to trade within a descending channel, maintaining its bearish momentum after failing to hold above key moving averages. The token has dropped below the 0.236 Fibonacci support at $2.32, currently hovering around $2.21, reflecting sustained selling pressure.
The 20 EMA ($2.48), 50 EMA ($2.62), 100 EMA ($2.69), and 200 EMA ($2.59) are all sloping downward — a classic sign of persistent bearish bias. Unless XRP can reclaim these EMAs, the path of least resistance remains to the downside.
The lower bou
XRP7.29%
- Reward
- 11
- 10
- 1
- Share
CryptoKINGJ:
1000x Vibes 🤑View More
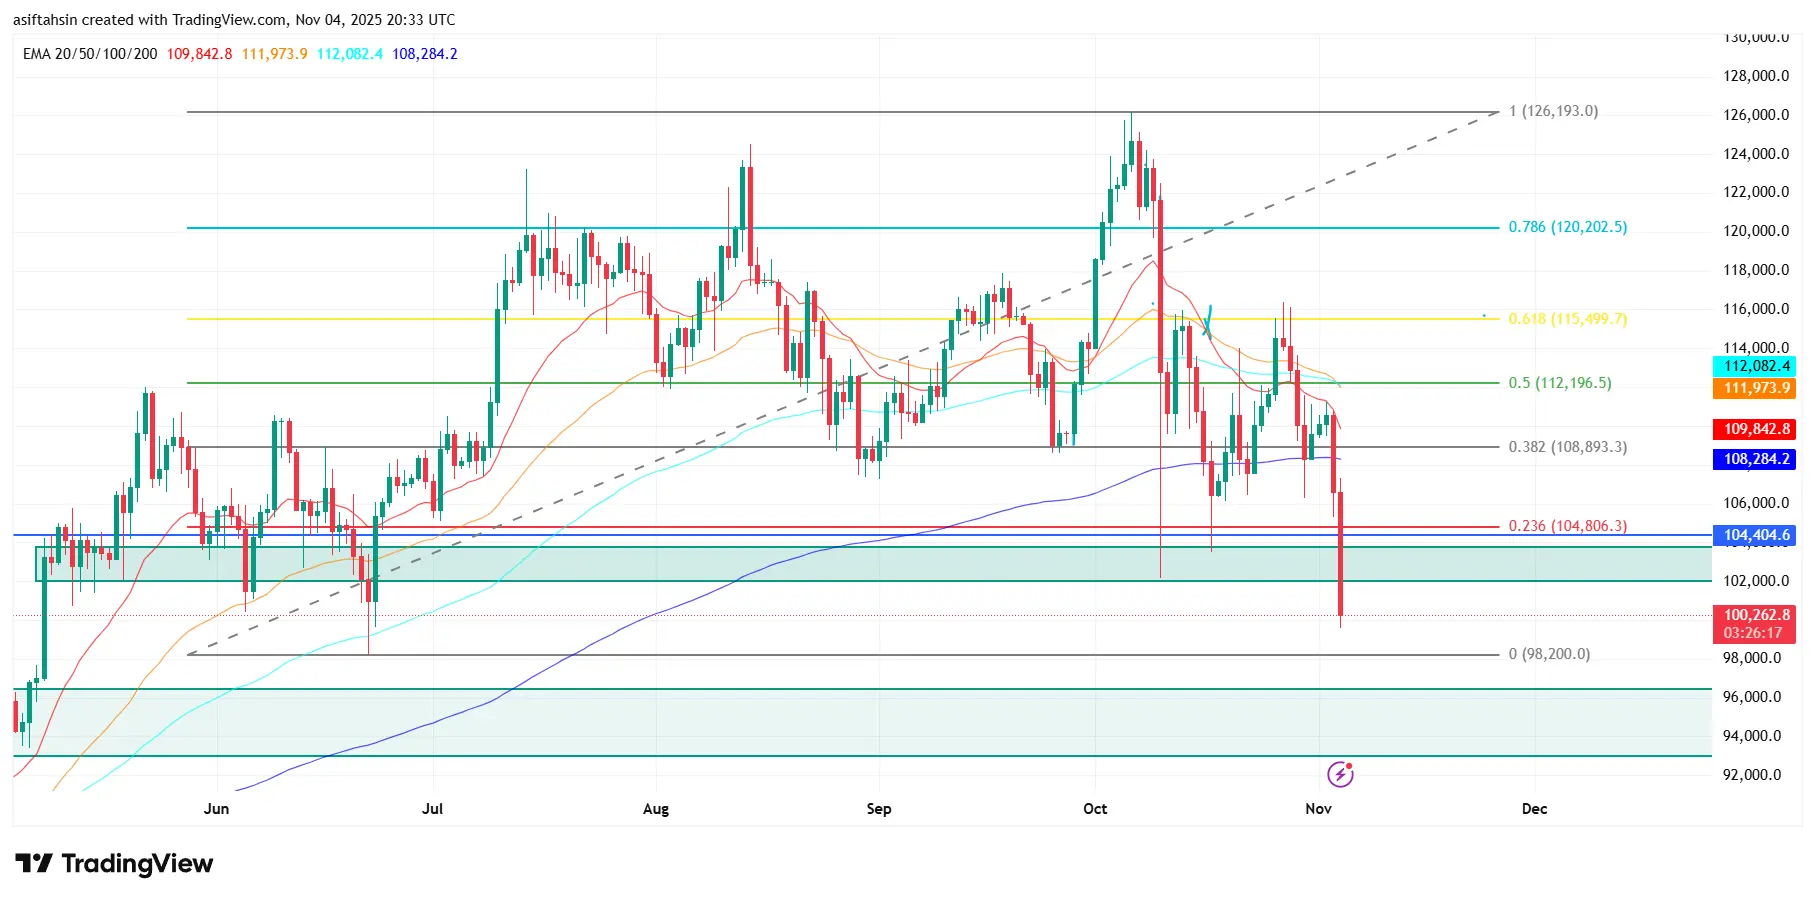
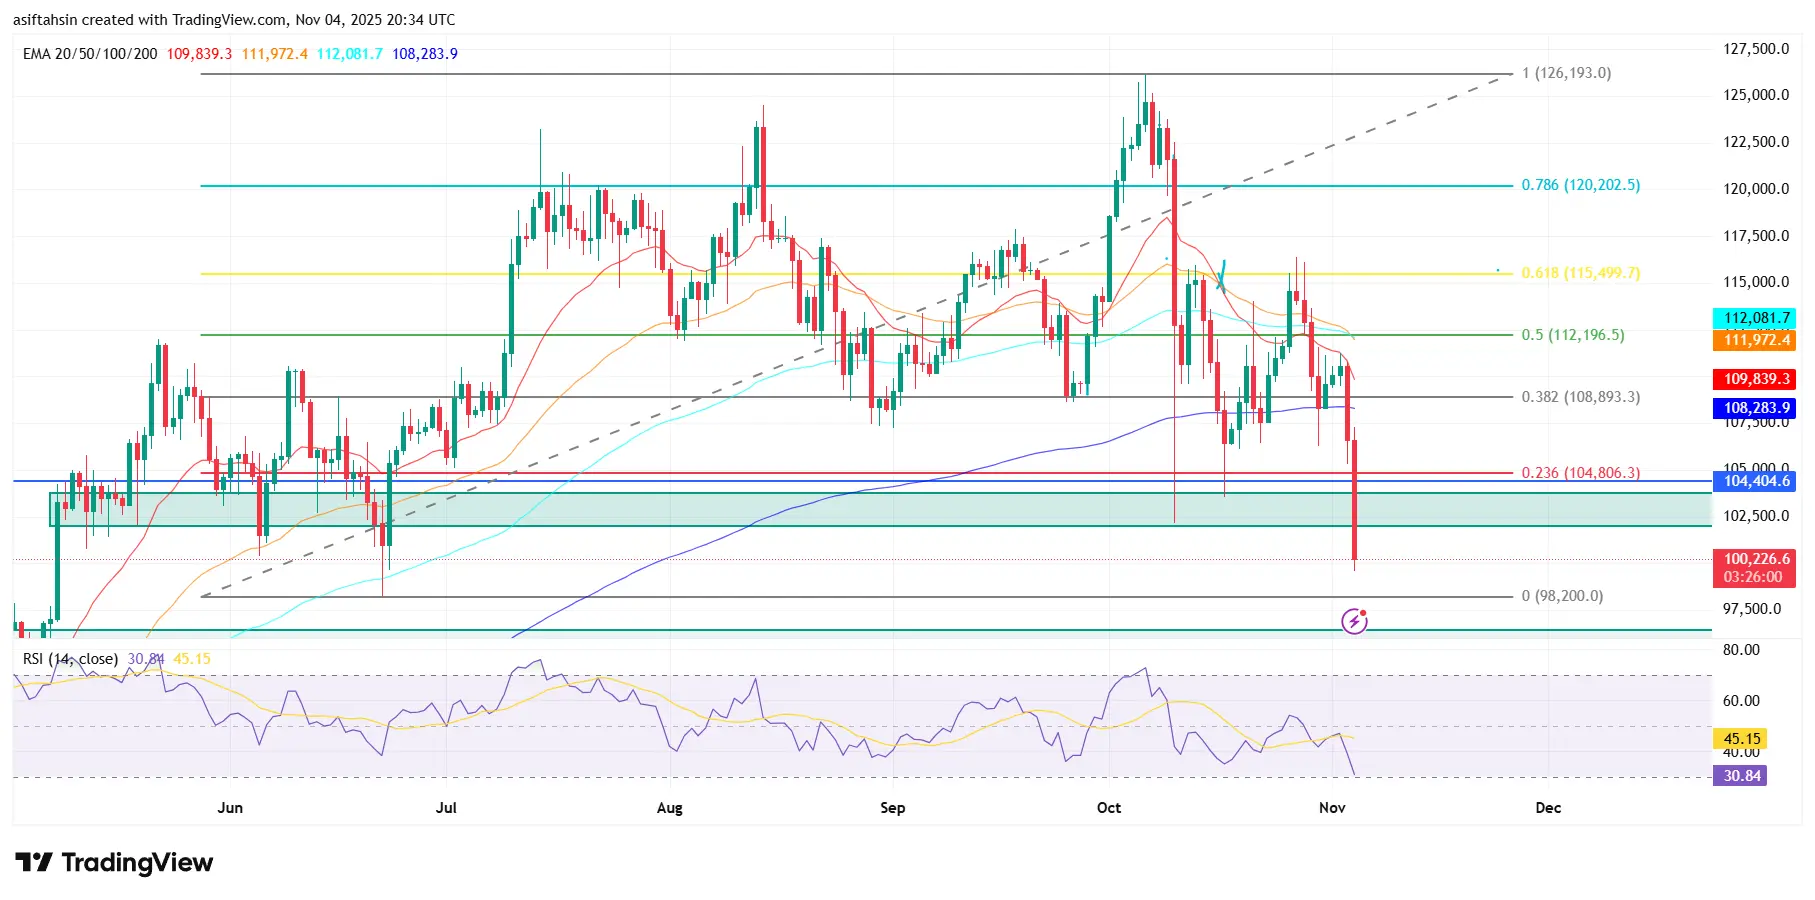
Bitcoin Technical Outlook: BTC Dips Toward $100K Support as Selling Pressure Intensifies
Bitcoin (BTC) has extended its downside correction, dropping sharply below $105,000, testing the 0.236 Fibonacci support at $104,806. The breakdown below key EMAs — 20 EMA ($109,839), 50 EMA ($111,972), and 100 EMA ($112,081) — confirms sustained bearish momentum in the short term.
BTC is now hovering above the major demand zone between $104,000–$102,000, where the 200 EMA ($108,283) previously provided strong support but has now turned into resistance. A decisive daily close below $104,000 could open the
BTC4.39%
- Reward
- 6
- 8
- Repost
- Share
LittleGodOfWealthPlutus :
:
Unforgettable big dump😂View More
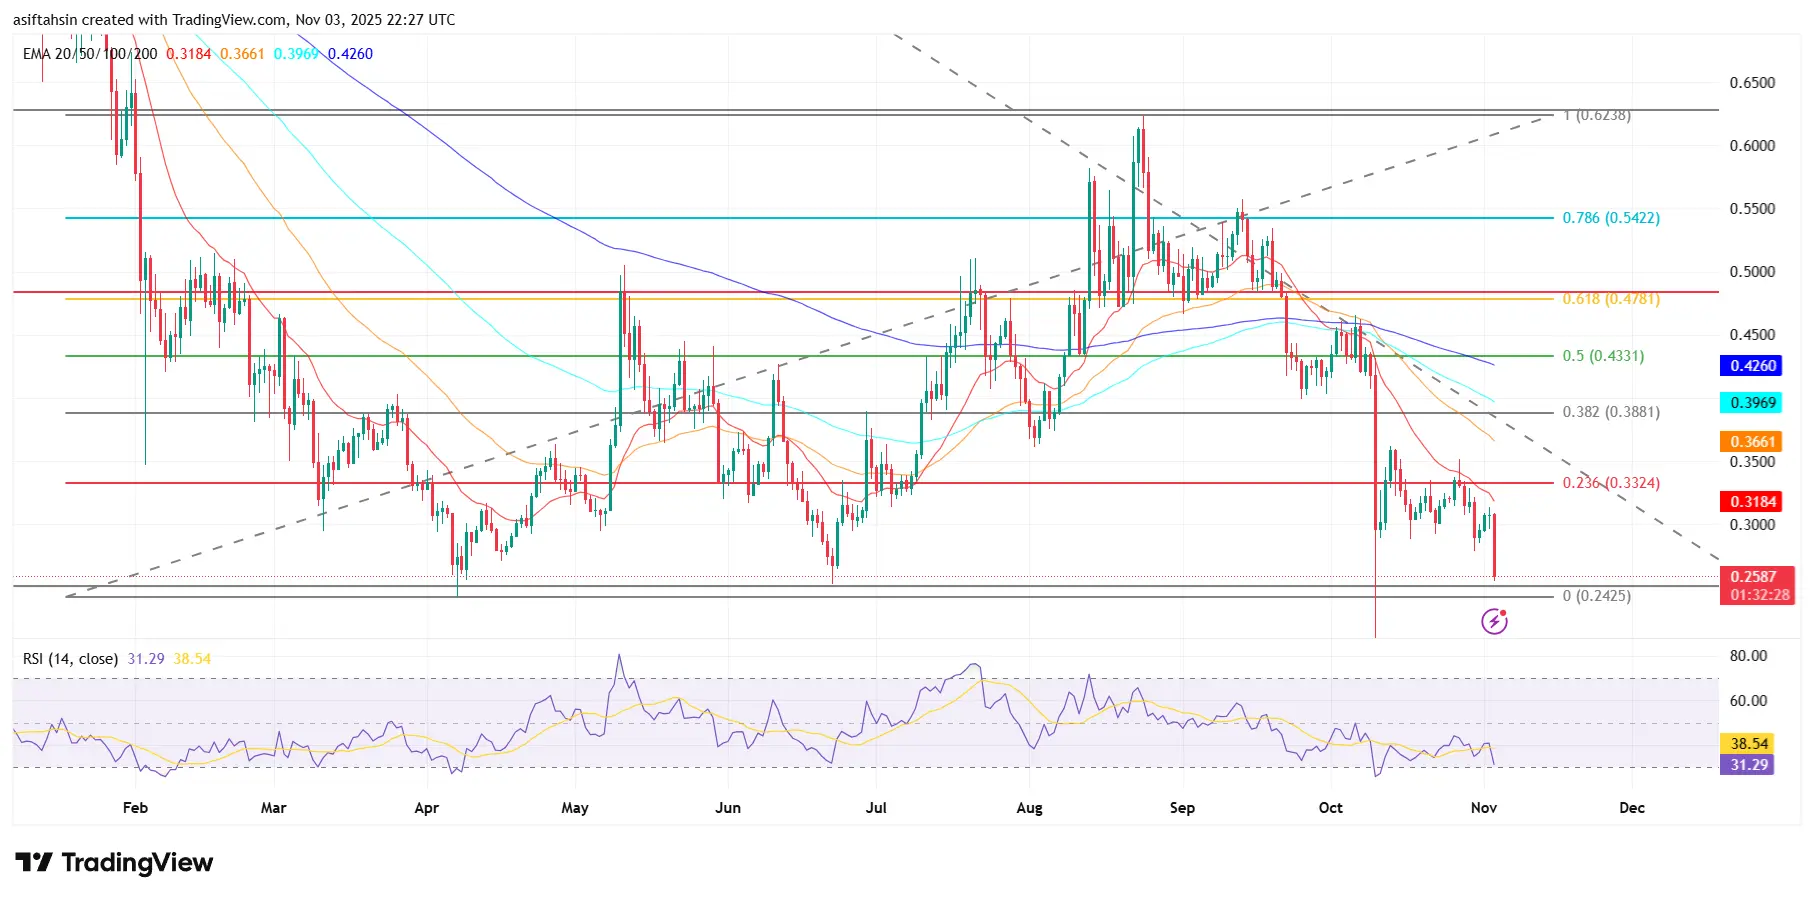
Arbitrum (ARB/USDT) Technical Outlook: Testing Key Support at $0.25
Arbitrum continues to trade under selling pressure, currently hovering around $0.258, as it retests the major support zone near $0.242–$0.25. This region has previously acted as a strong demand area, making it a crucial level for bulls to defend to prevent further downside.
The price remains below the 20 EMA ($0.318), signaling continued short-term weakness, while the broader trend stays bearish beneath the descending resistance line. A sustained close below $0.25 could trigger a deeper decline toward $0.21–$0.20, marking a po
ARB4.67%
- Reward
- 11
- 14
- 1
- Share
CryptoKINGJ:
1000x Vibes 🤑View More
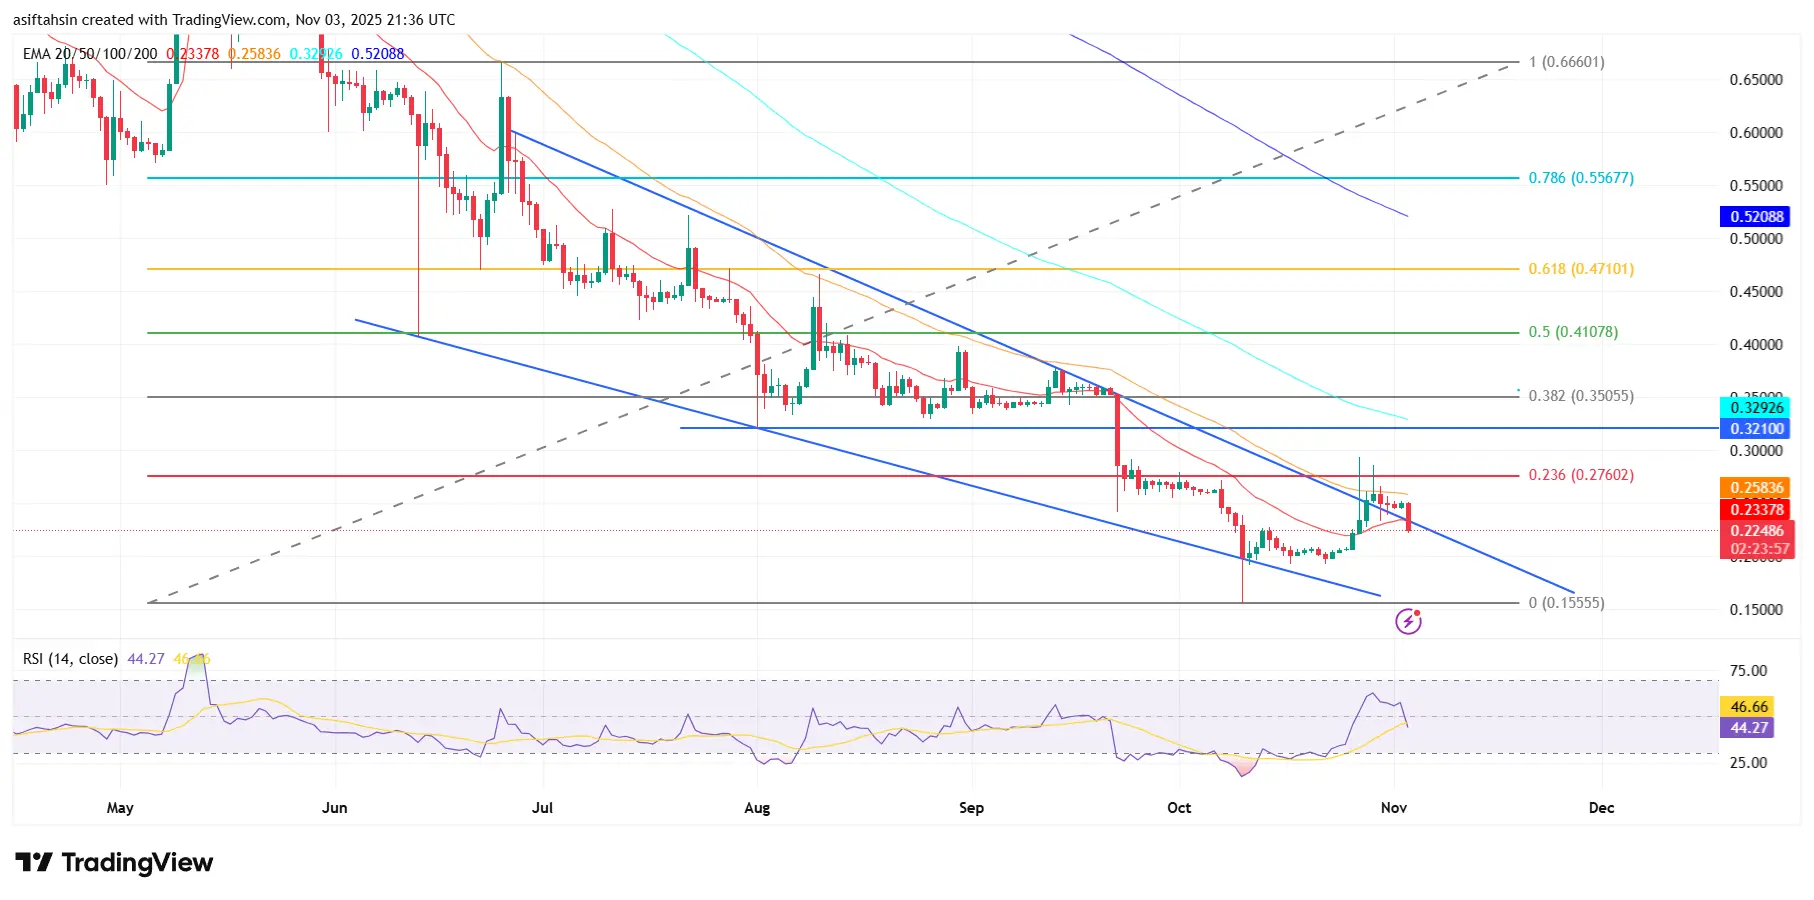
Pi Network (PI/USDT) Technical Outlook: Bulls Defend $0.225 Support
Pi Network is consolidating above the $0.225 zone, showing resilience after a period of bearish pressure. The pair is attempting to build a base above the 20 EMA ($0.23), suggesting that buyers are slowly regaining control near the lower boundary of the descending channel.
The immediate resistance remains at $0.276 (0.236 Fibonacci level). A decisive daily close above this level would confirm a bullish breakout, potentially triggering upside targets toward $0.32 (R1) and $0.35 (0.382 Fib). Continued strength above those zones
PI3.68%
- Reward
- 7
- 16
- Repost
- Share
Ybaser:
1000x Vibes 🤑View More
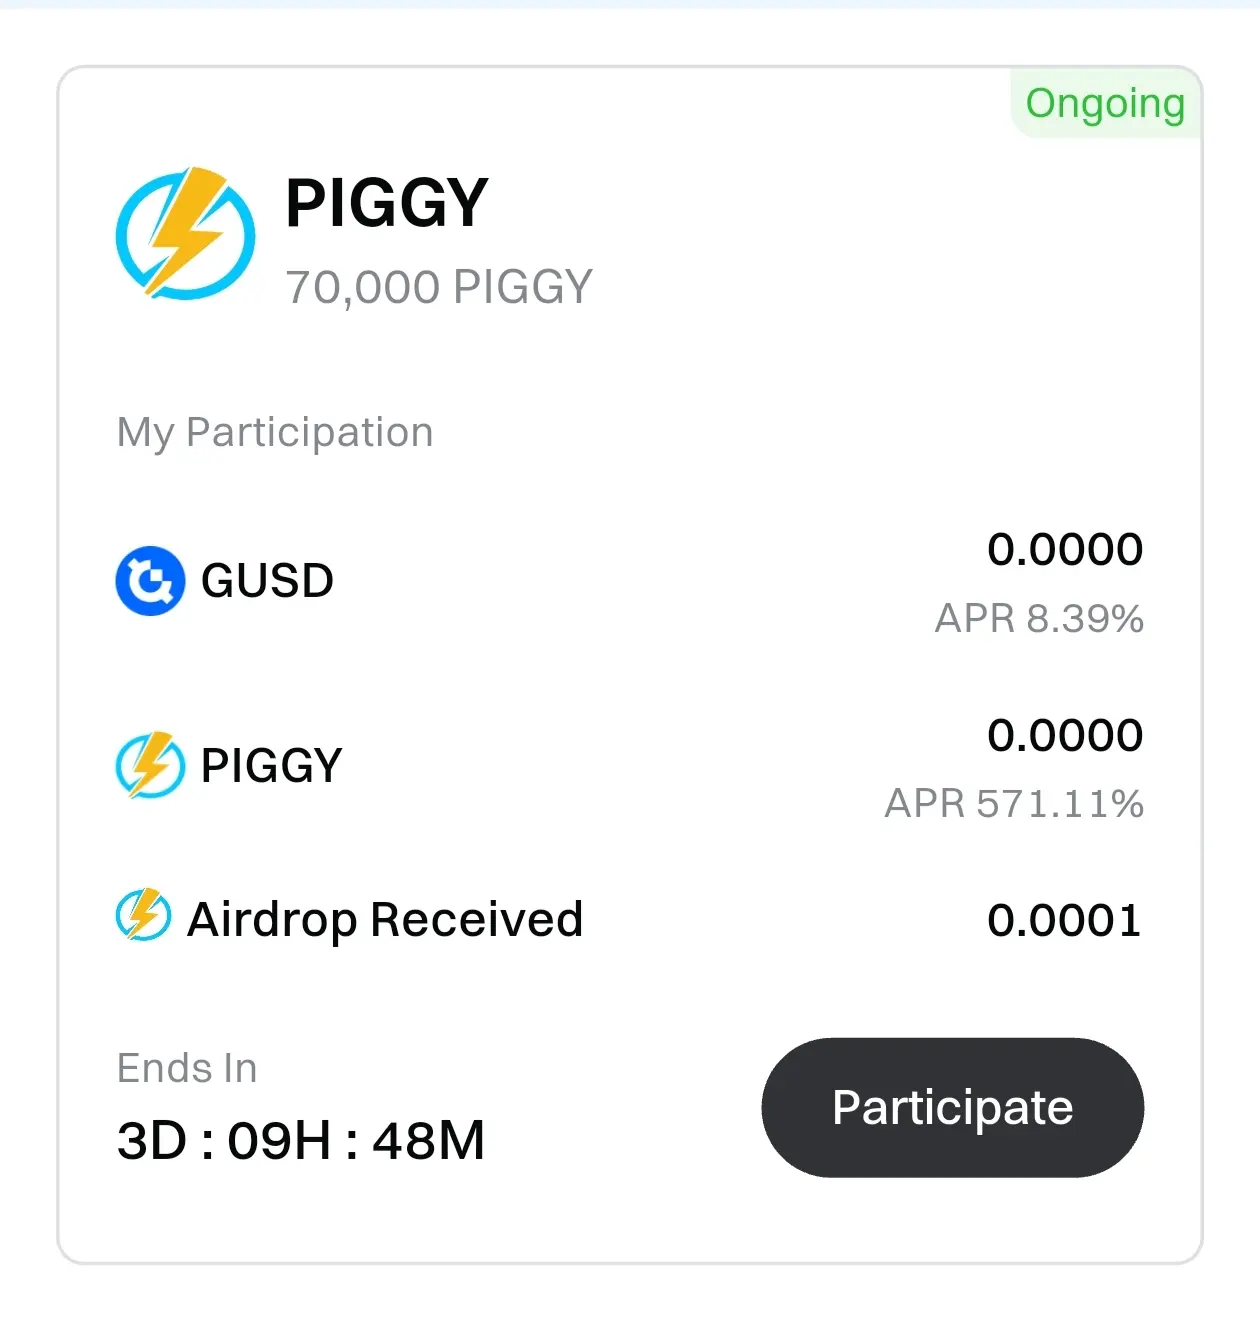
#PostToWinPIGGY
Hey everyone 👋 Hope you’re doing great!
Today I’m talking about Gate Launchpool’s latest project — Piggycell (PIGGY)! 🔥
💡 What is Gate Launchpool?
Gate Launchpool lets you stake GT, BTC, ETH, USDT, GUSD, or other tokens to earn hourly airdrops of new trending projects.
✅ Low entry
💰 High APR
💎 Your gateway to passive crypto income!
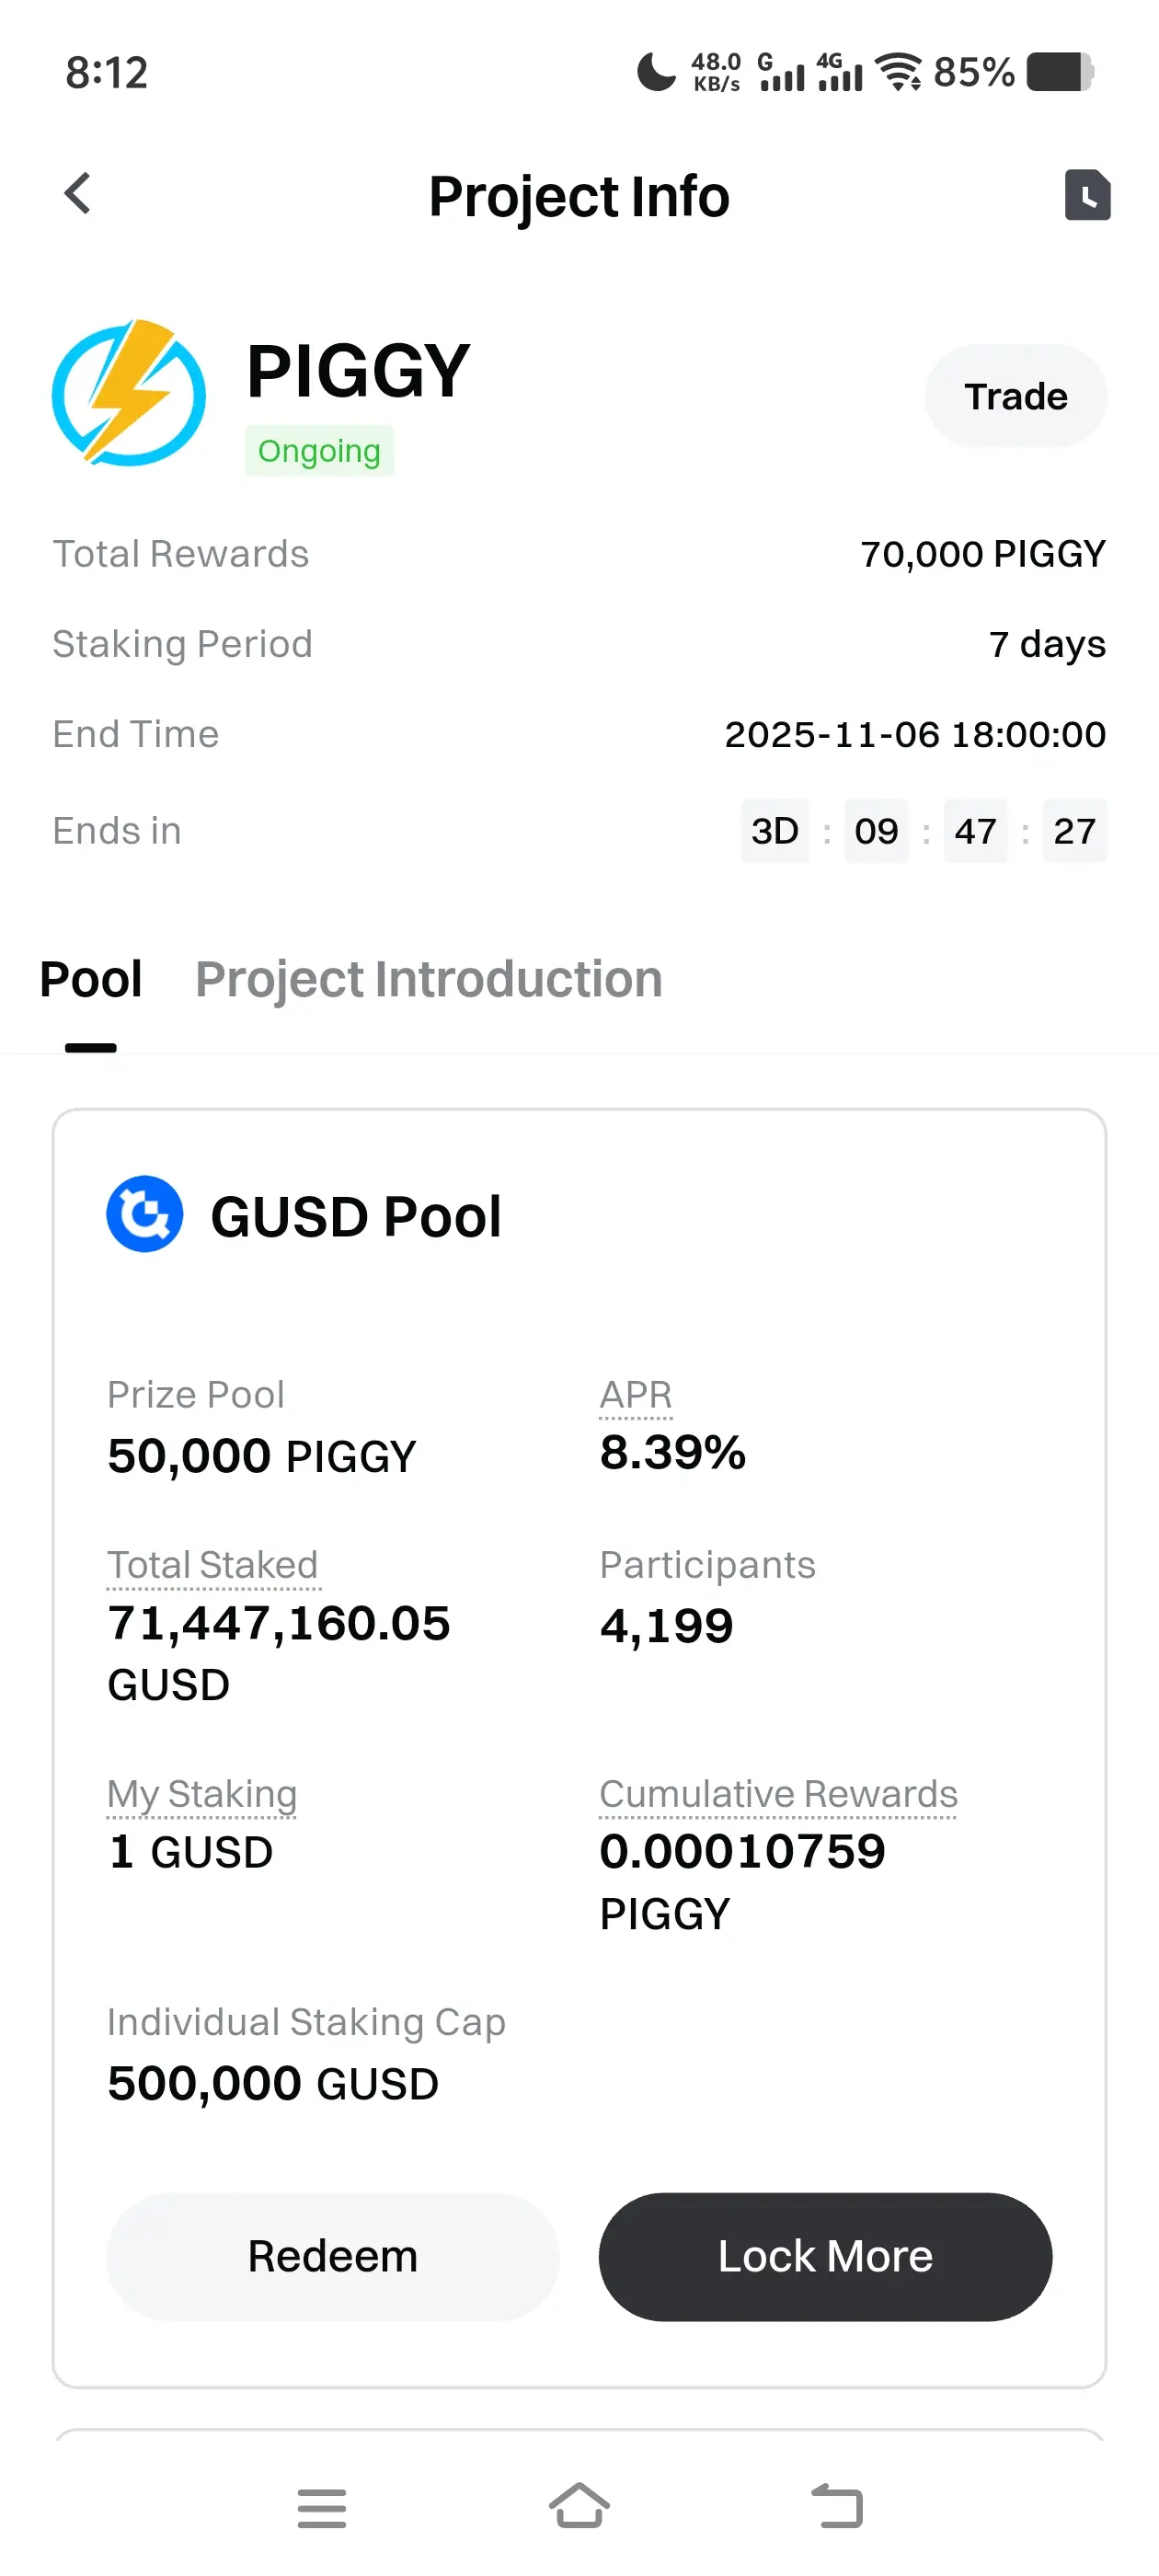
🚀 Gate Launchpool Project #335: Piggycell (PIGGY)
Stake GUSD or PIGGY to share 70,000 PIGGY tokens — completely free!
📅 Staking Period:
🕛 October 30, 2025, 12:00 (UTC) → November 6, 2025, 12:00 (UTC)
🎯 Total Rewards: 70,000 PIGGY
💰 GUSD Po
Hey everyone 👋 Hope you’re doing great!
Today I’m talking about Gate Launchpool’s latest project — Piggycell (PIGGY)! 🔥
💡 What is Gate Launchpool?
Gate Launchpool lets you stake GT, BTC, ETH, USDT, GUSD, or other tokens to earn hourly airdrops of new trending projects.
✅ Low entry
💰 High APR
💎 Your gateway to passive crypto income!
🚀 Gate Launchpool Project #335: Piggycell (PIGGY)
Stake GUSD or PIGGY to share 70,000 PIGGY tokens — completely free!
📅 Staking Period:
🕛 October 30, 2025, 12:00 (UTC) → November 6, 2025, 12:00 (UTC)
🎯 Total Rewards: 70,000 PIGGY
💰 GUSD Po


- Reward
- 12
- 30
- Repost
- Share
LittleGodOfWealthPlutus:
Get rich, get rich! 👍👍View More
Bitcoin (BTC) Technical Outlook – Bulls Eye Reversal Above $112K Resistance
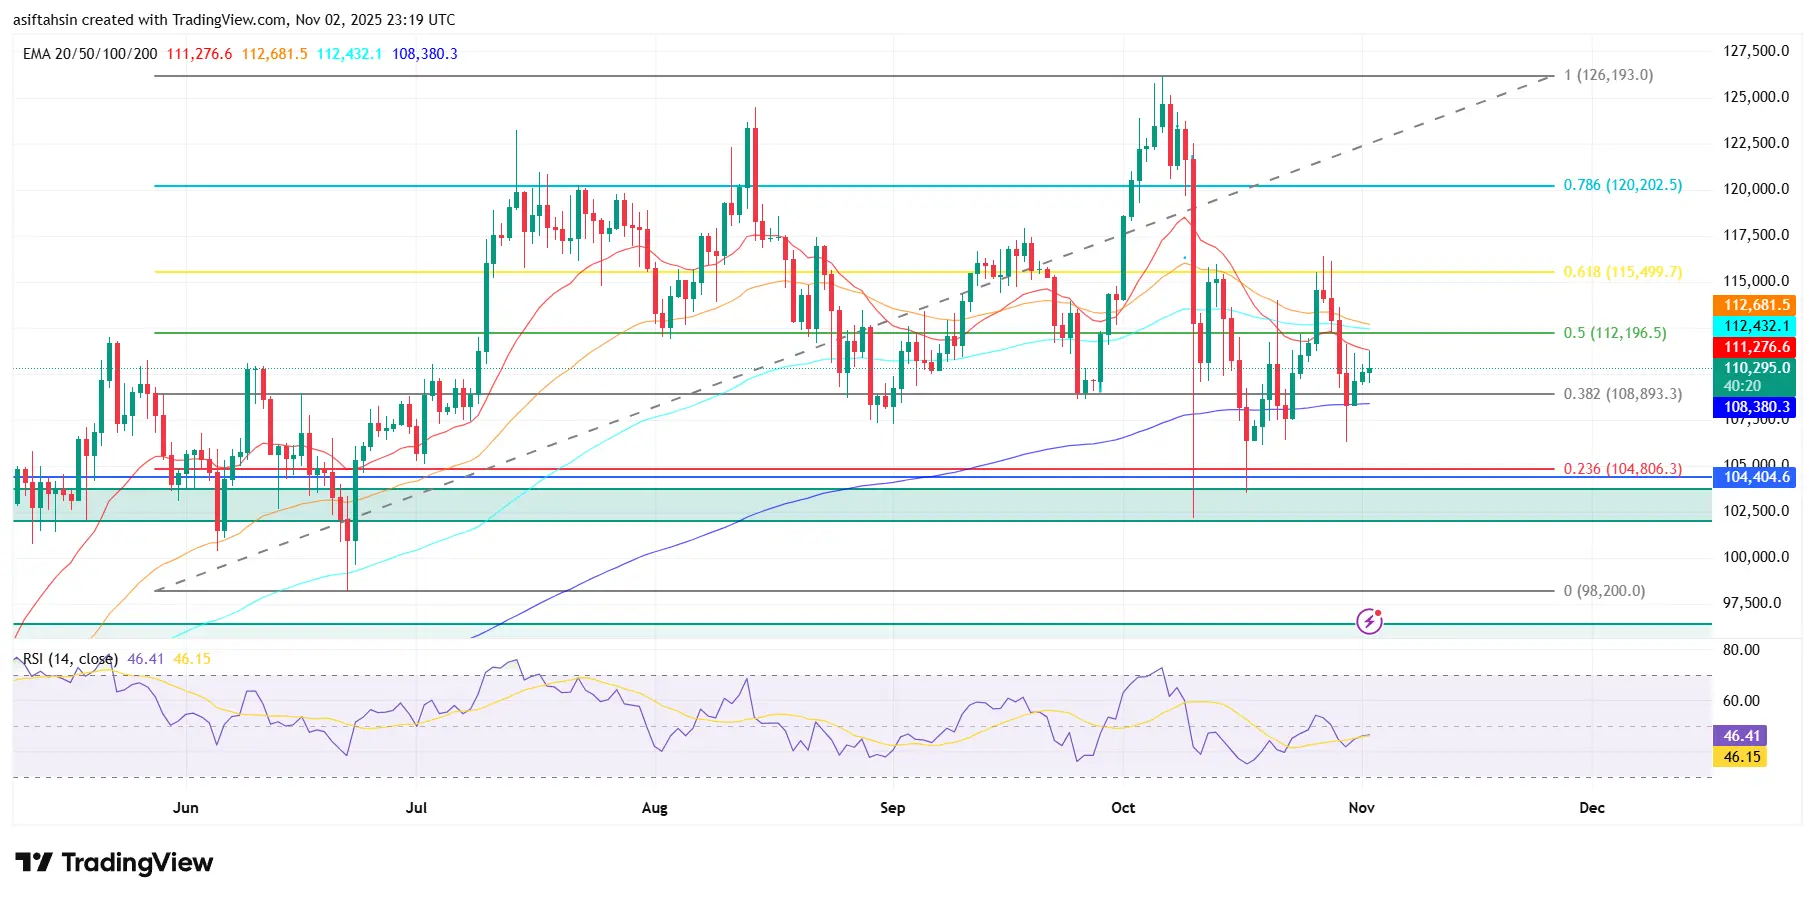
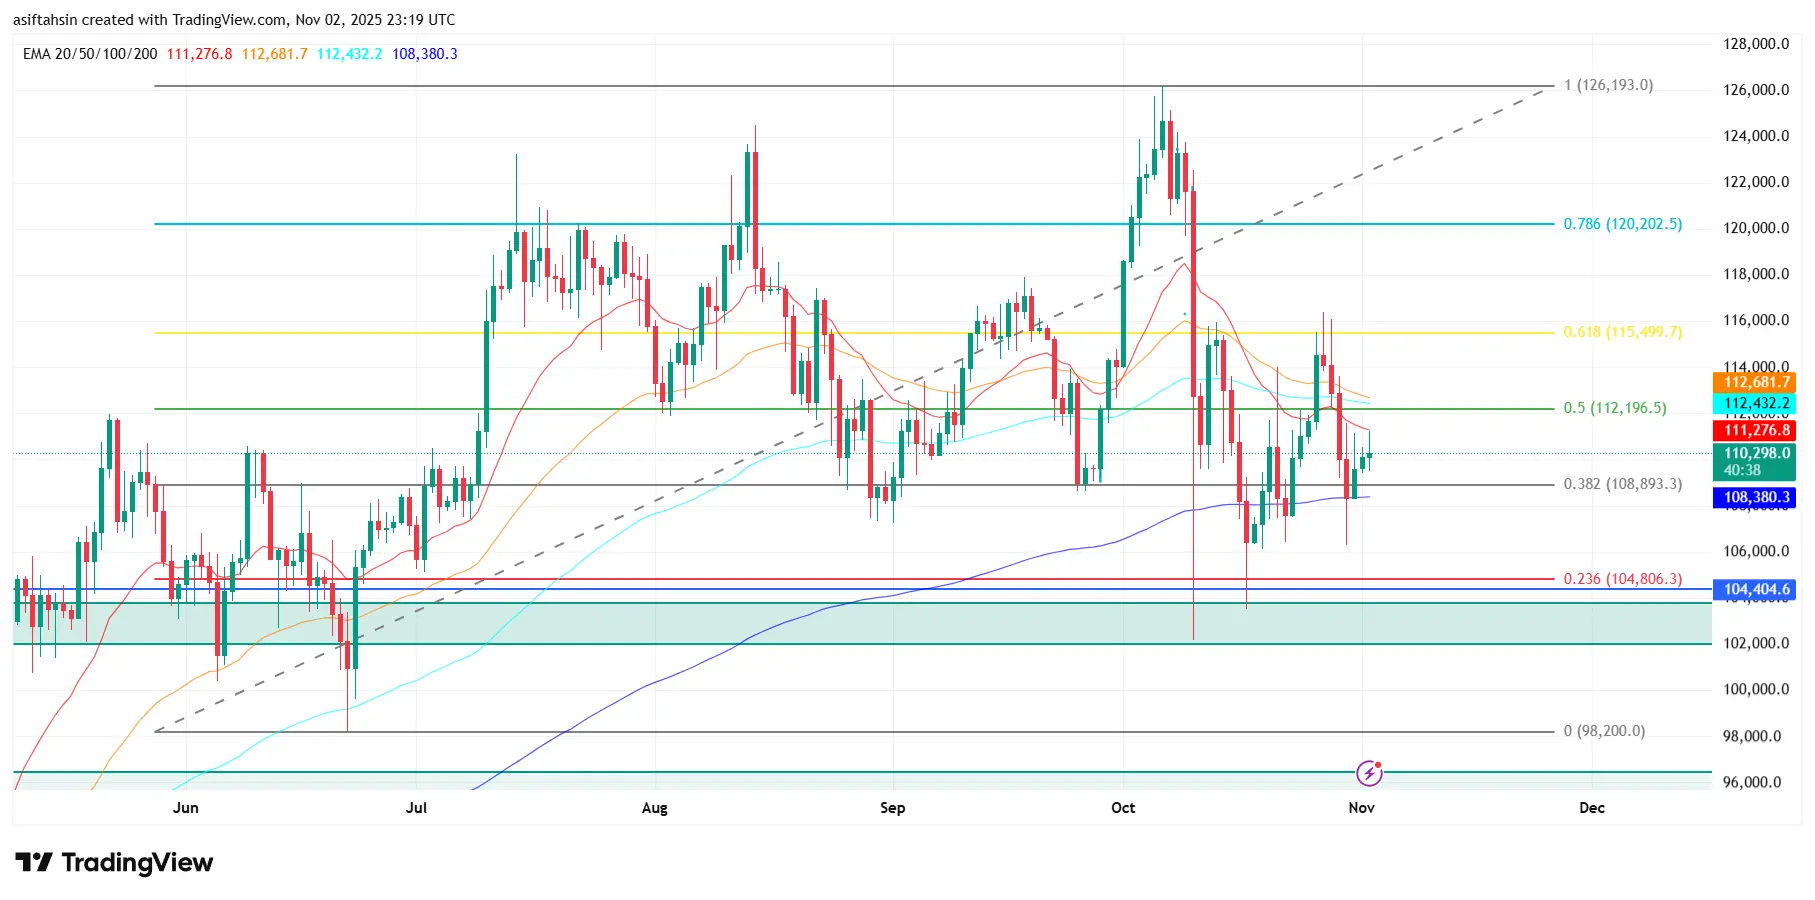
Bitcoin (BTC) is showing signs of recovery after rebounding from the $104,400 support zone (0.236 Fibonacci). The price is currently hovering around $111,000–$112,000, attempting to reclaim the 0.5 Fib level ($112,196) — a key area that could determine the next trend direction.
A successful breakout and daily close above $112,500 would likely trigger bullish continuation toward $115,500 (0.618 Fib) and $120,200 (0.786 Fib). On the downside, immediate support lies at $108,800 (0.382 Fib), followed by the crucial $104,80
BTC4.39%
- Reward
- 7
- 6
- Repost
- Share
Ybaser:
HODL Tight 💪View More
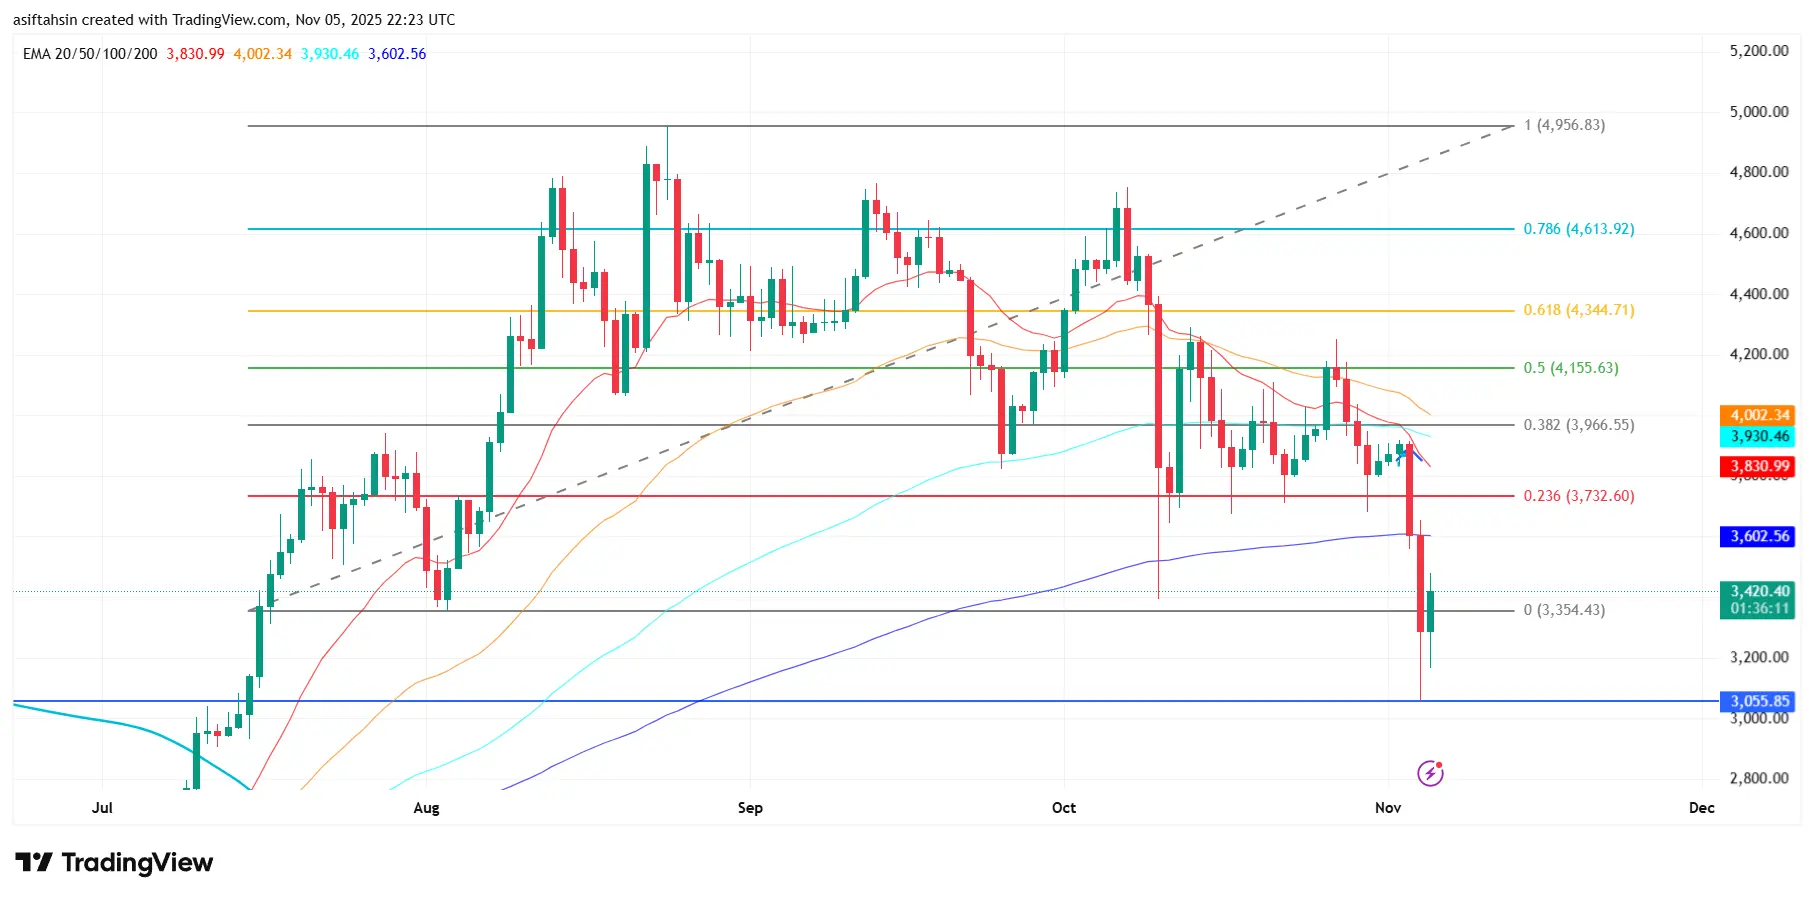
Ethereum (ETH) Technical Outlook – Bulls Defend Key $3,730 Support Zone
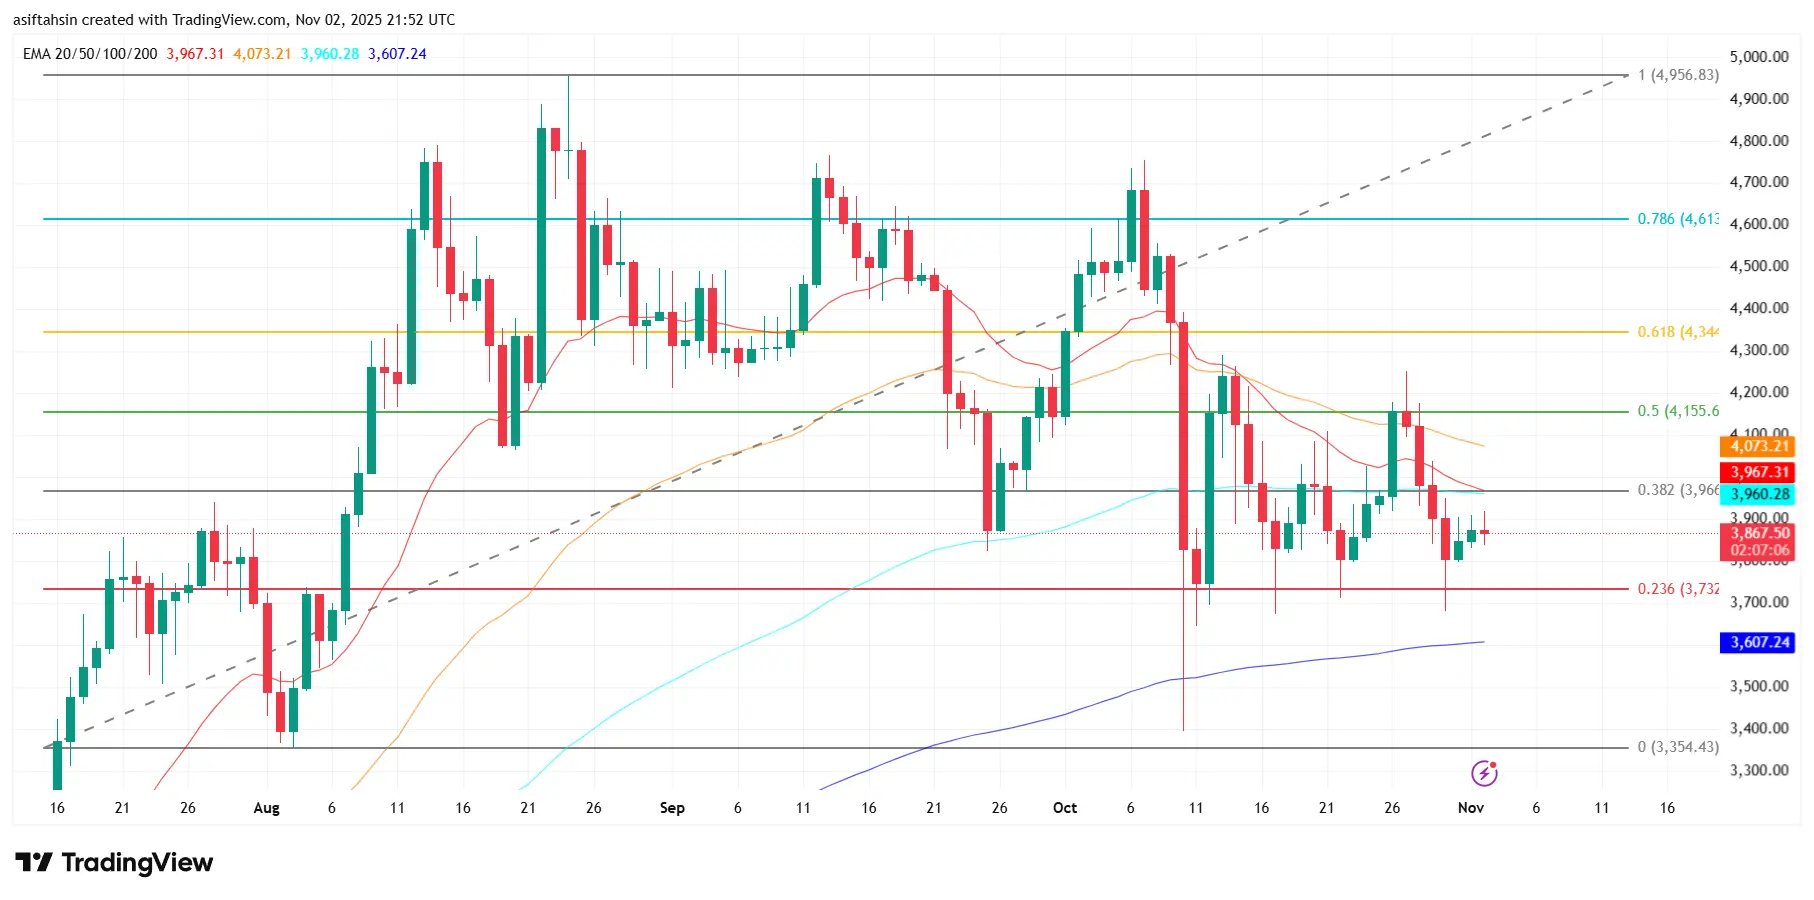
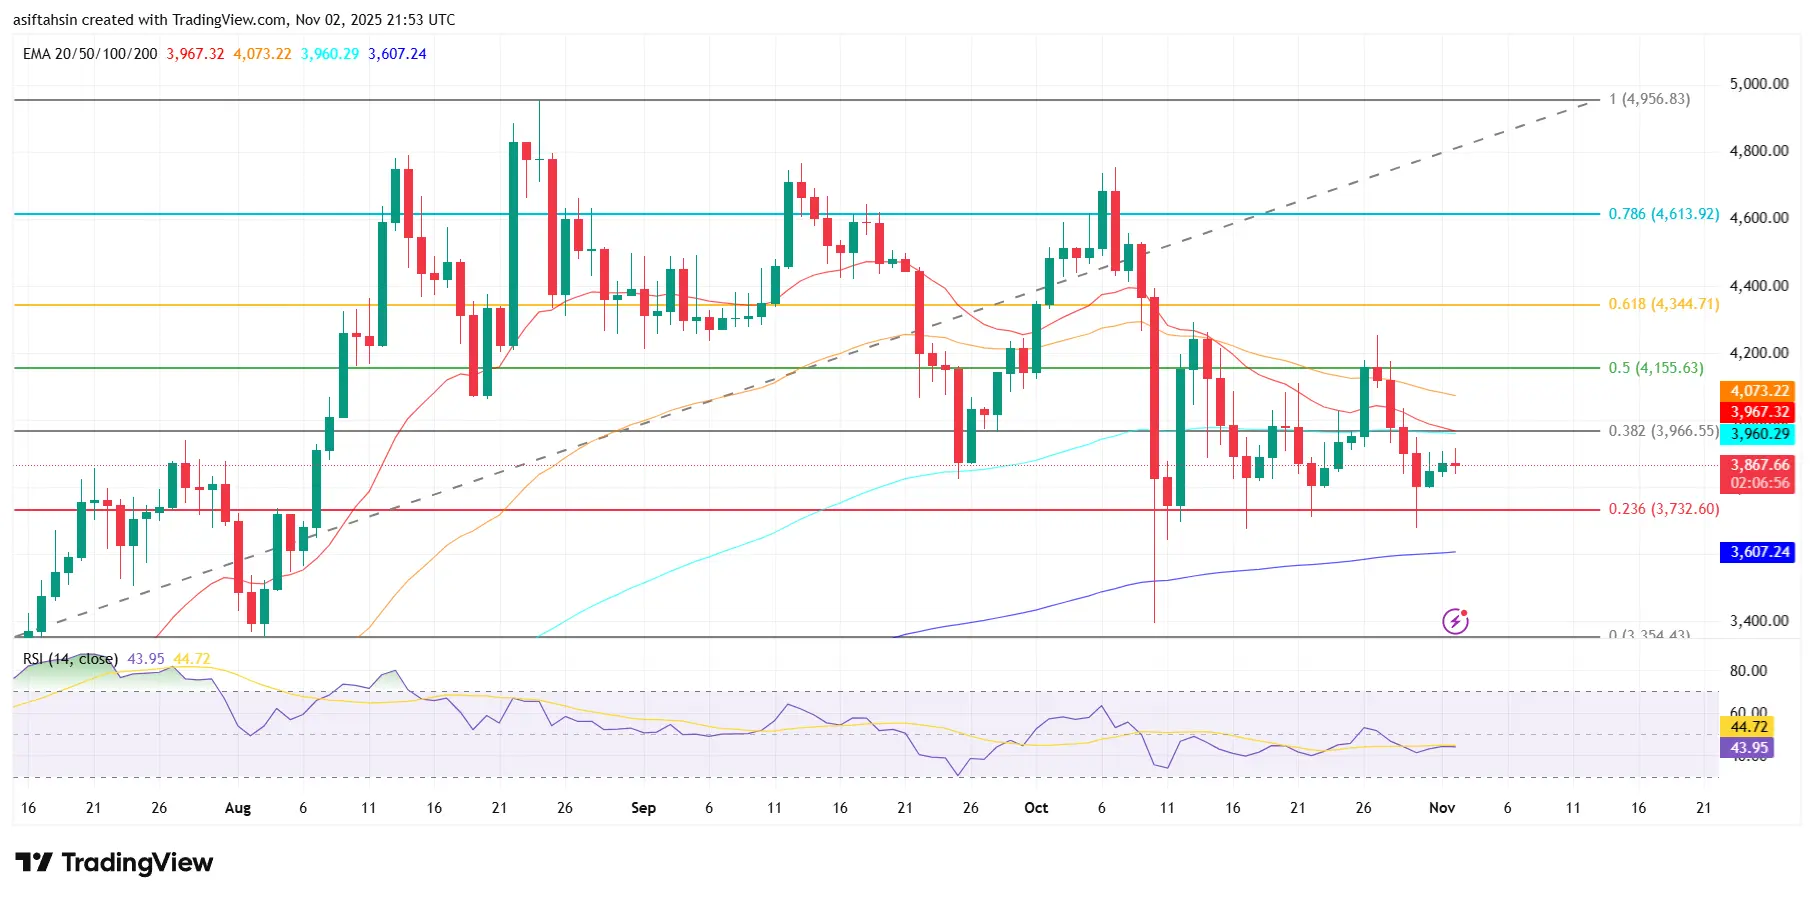
Ethereum (ETH) is consolidating near the $3,900 level, showing early signs of stabilization after multiple tests of the 0.236 Fibonacci support ($3,732). Buyers are trying to defend this area as ETH trades slightly above its 200 EMA ($3,607) — a crucial long-term support line that has held firm so far.
On the upside, ETH faces resistance near the 0.382 Fibonacci level ($3,966), aligning closely with the 20 EMA ($3,967). A breakout and close above this zone could open the door for a move toward $4,155 (0.5 Fib) and $4,344 (
ETH7.93%
- Reward
- 6
- 8
- Repost
- Share
Ybaser:
HODL Tight 💪View More
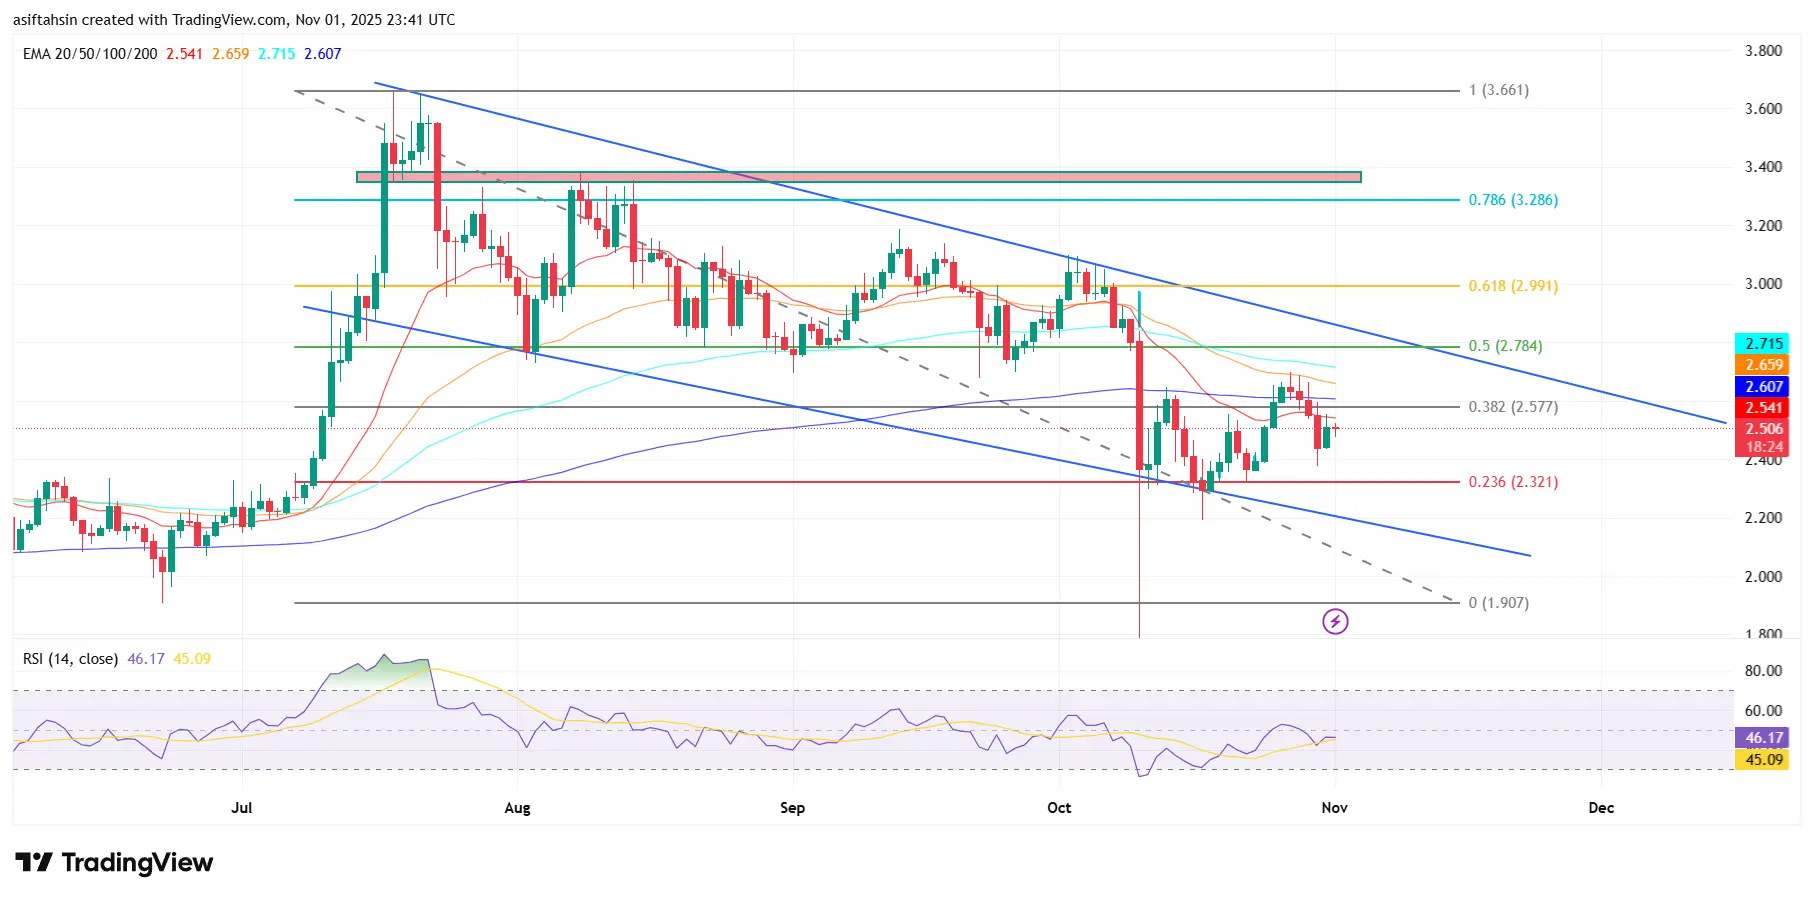
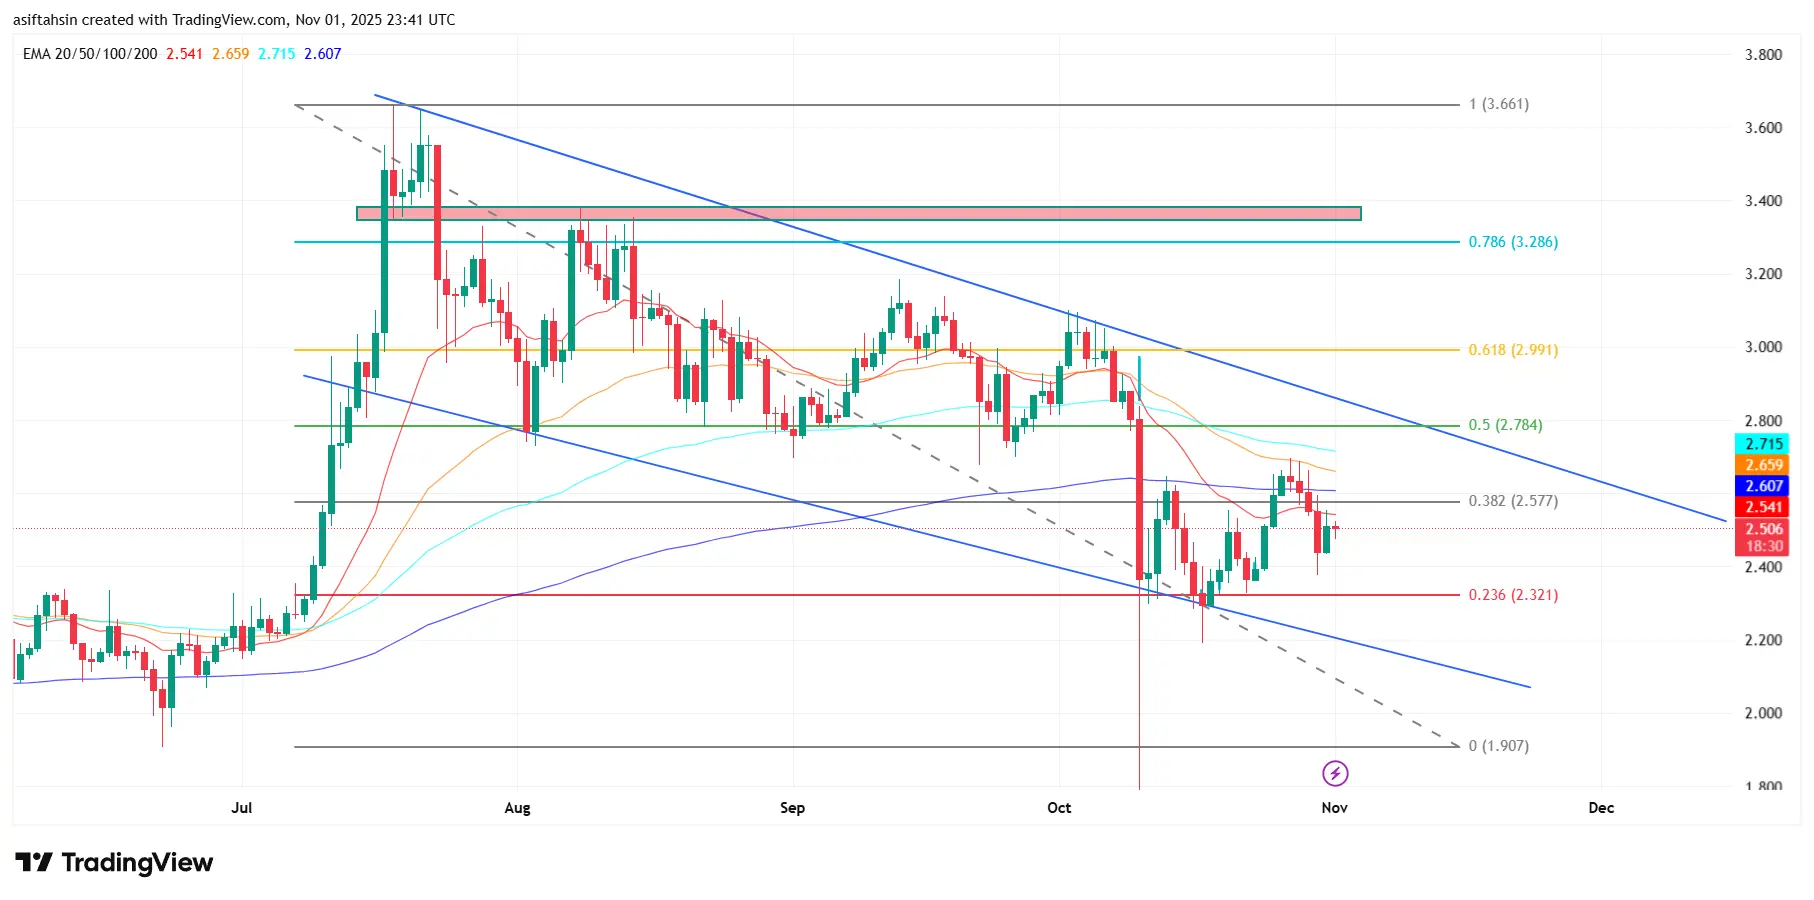
XRP (XRP/USDT) Technical Outlook – Bulls Aim to Hold Above Key Support
XRP trades around $2.50, consolidating after a recent pullback from $2.78 (Fib 0.5). The price currently hovers above $2.46–$2.40, a key support zone aligned with the 20 EMA ($2.54) and Fib 0.382 ($2.57). Holding above this area is crucial for bulls to maintain momentum and avoid a deeper decline.
On the upside, immediate resistance lies at $2.57 (Fib 0.382) and $2.78 (Fib 0.5), while stronger resistance is seen near $2.99 (0.618 Fib). A daily close above $2.78 could reignite bullish sentiment and pave the way for a test of
XRP7.29%
- Reward
- 8
- 6
- Repost
- Share
Szero:
HODL Tight 💪View More
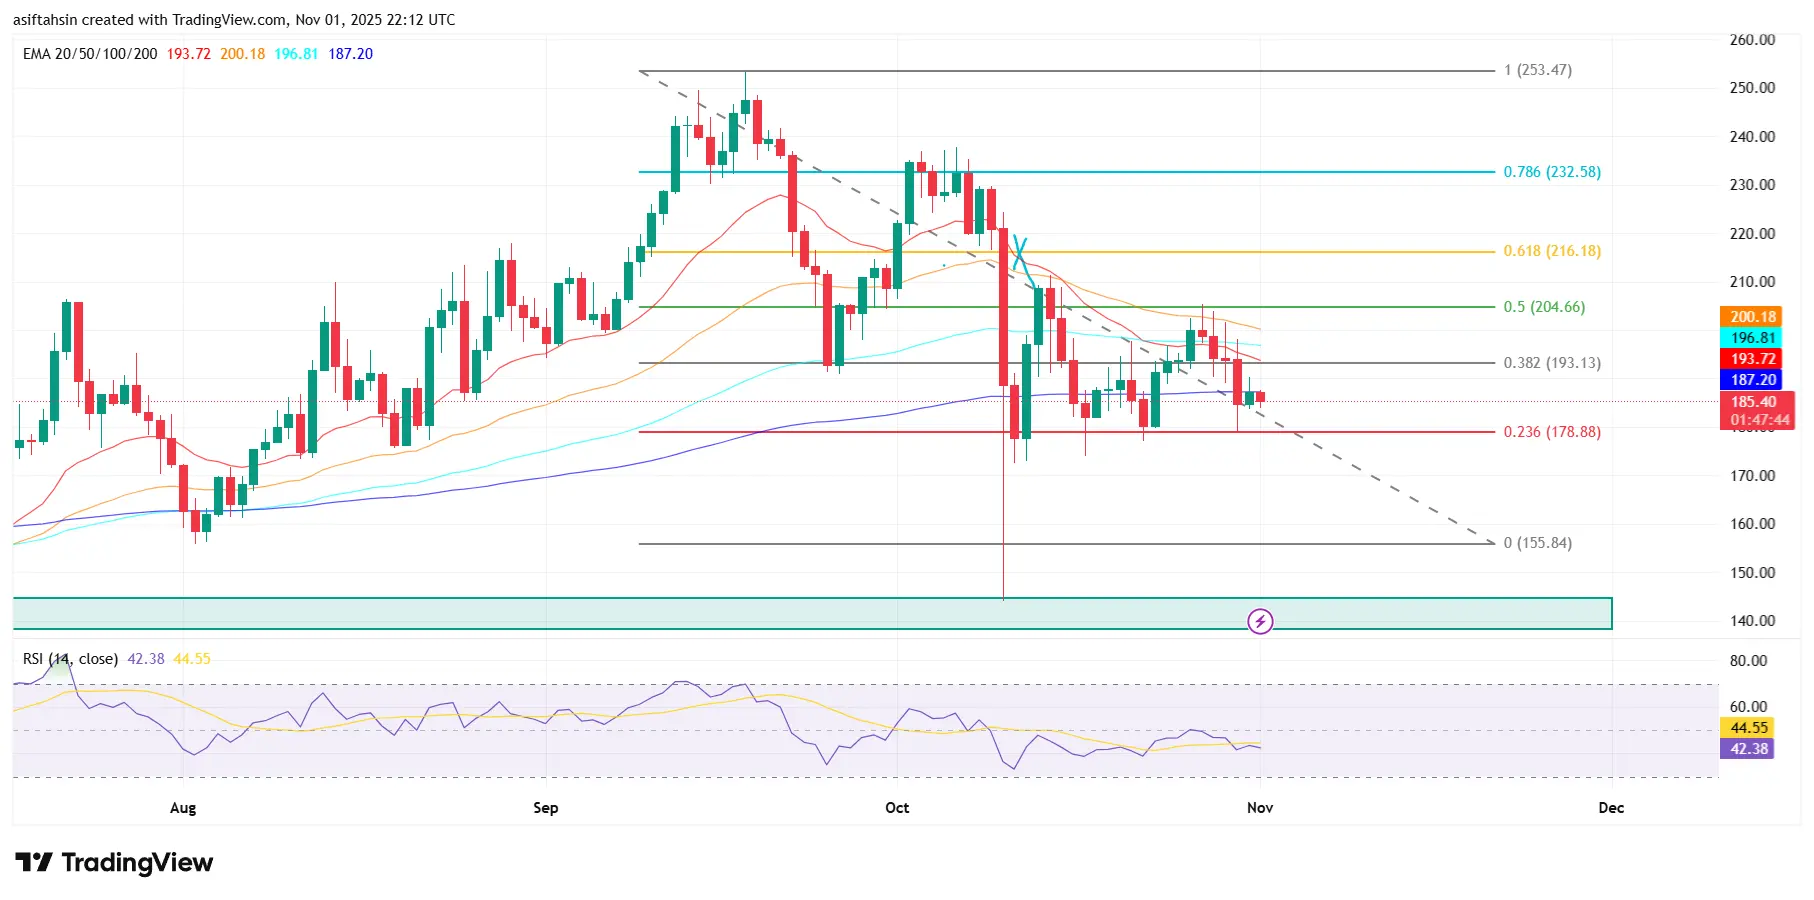
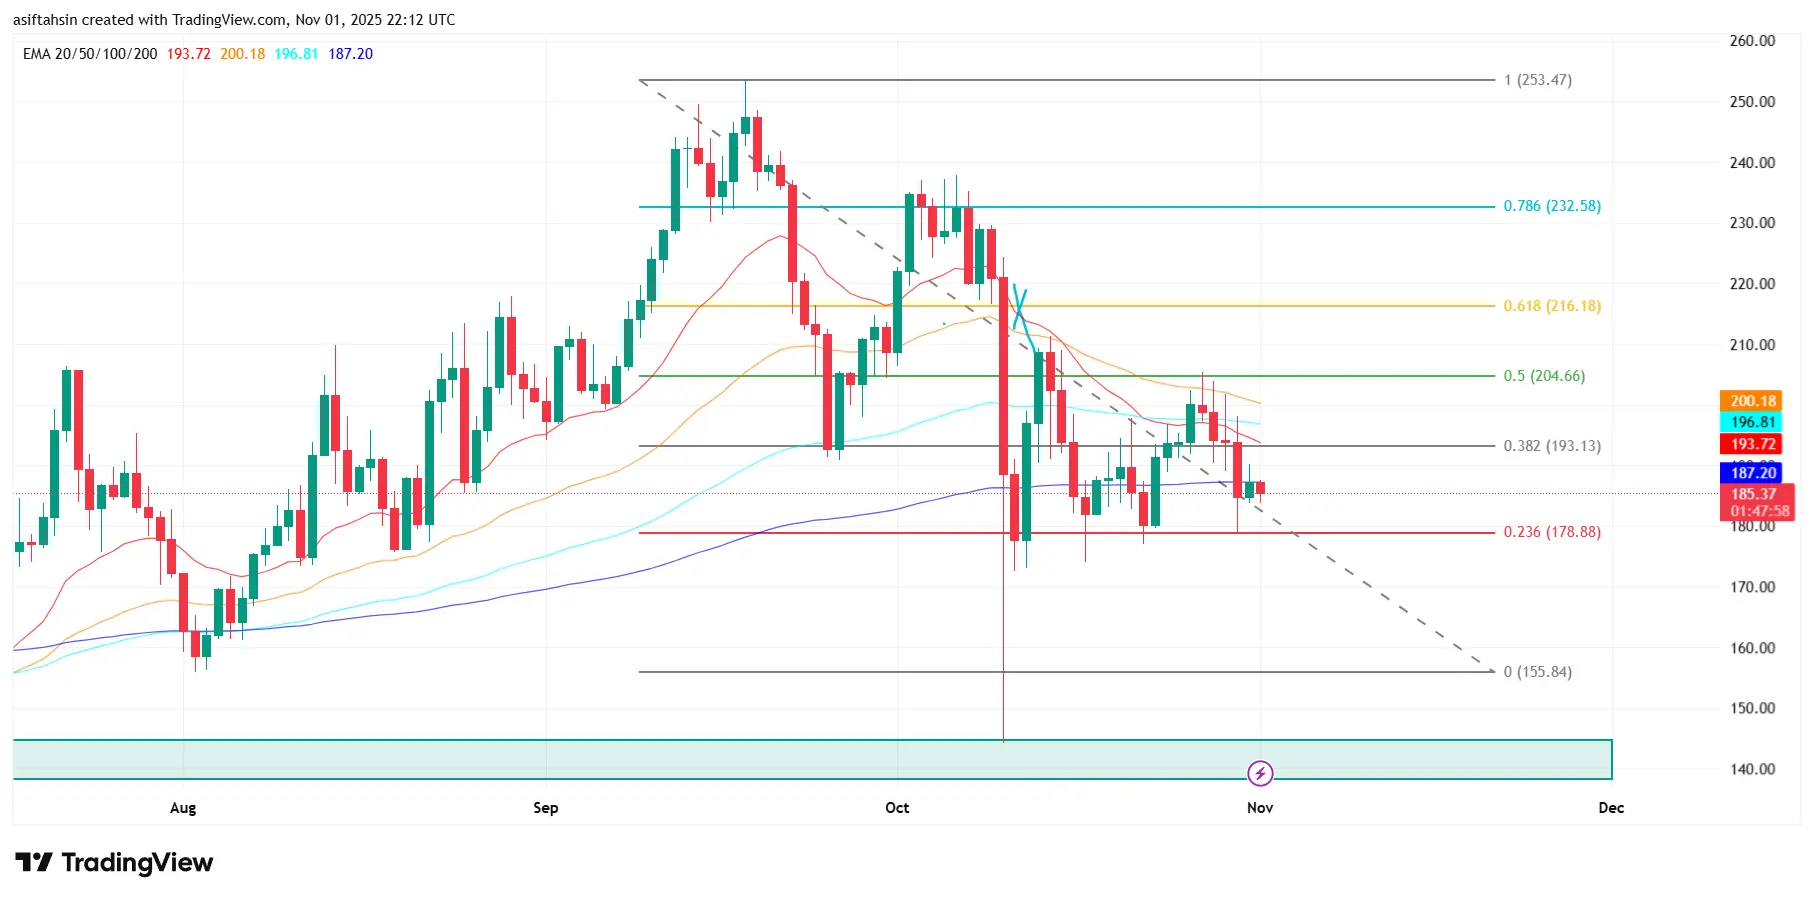
Solana (SOL) Technical Outlook – Bears Test Key Support Near $185
Solana (SOL) continues to face downside pressure, currently trading around $186, hovering just above the 0.236 Fibonacci level ($178.88). This zone remains a critical support area, as a decisive break below could trigger a deeper correction toward $155–$160, where the next major support zone lies.
On the upside, SOL faces immediate resistance at $193 (0.382 Fib) and stronger barriers near $204 (0.5 Fib) and $216 (0.618 Fib). A daily close above $200 (50 EMA) would signal renewed bullish strength and potentially set the stage for
SOL7.68%
- Reward
- 8
- 10
- Repost
- Share
Ybaser:
Hold on tight, we're taking off to da moon 🛫View More
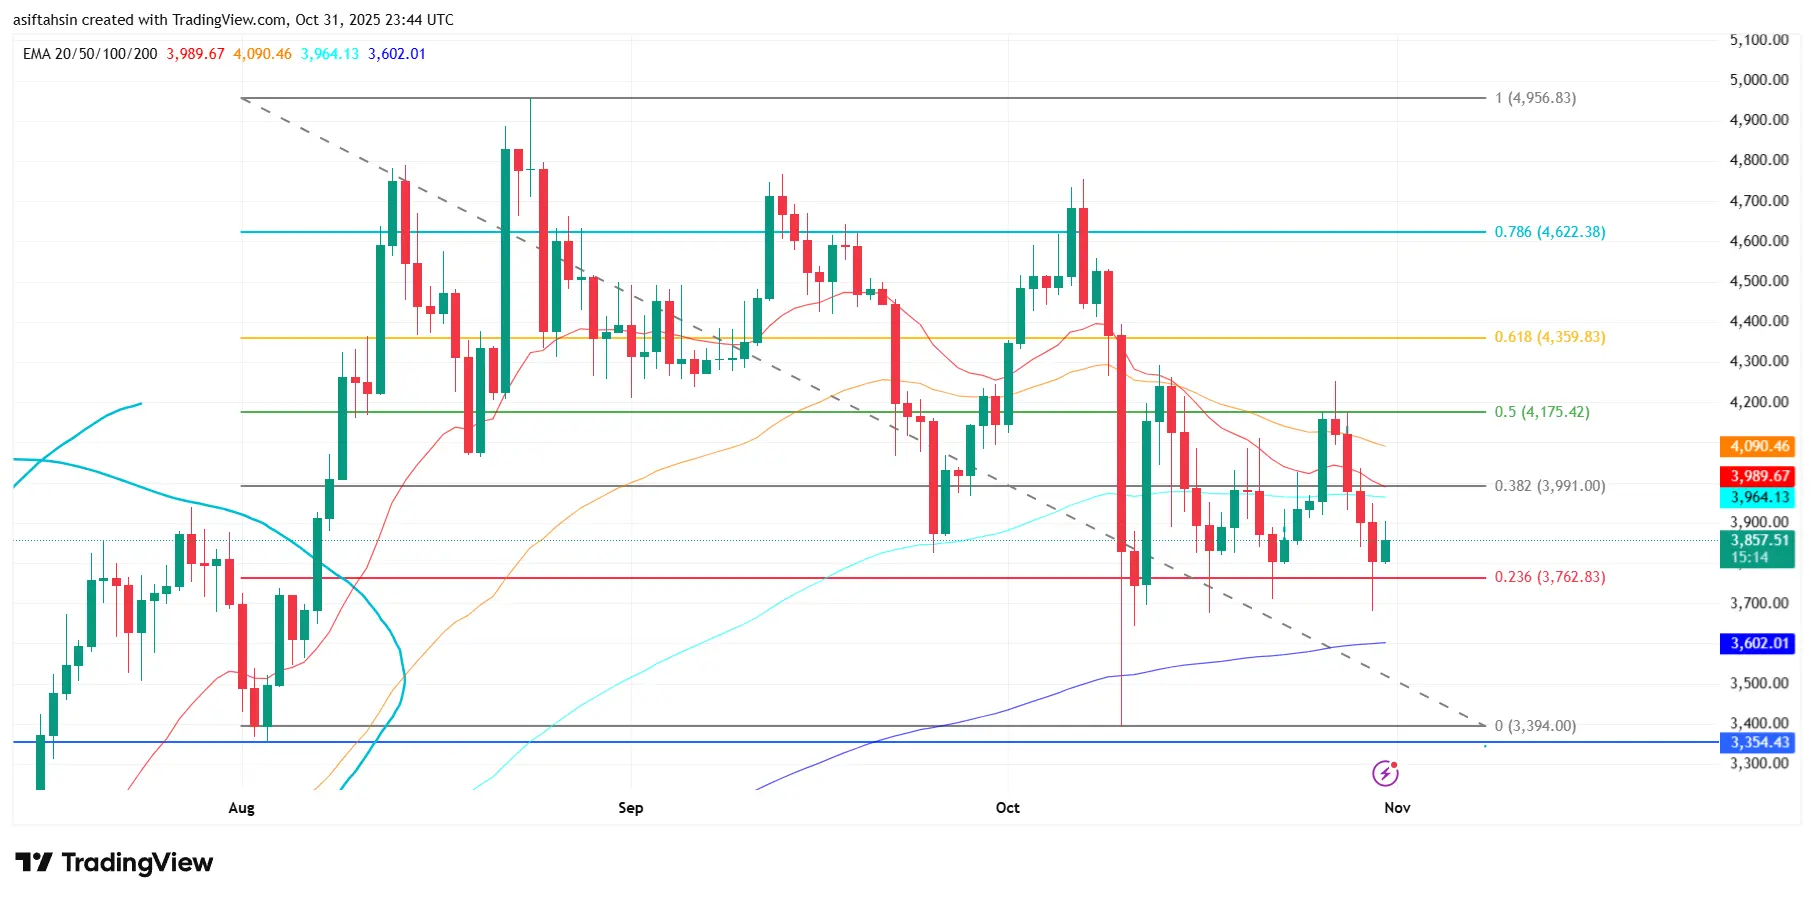
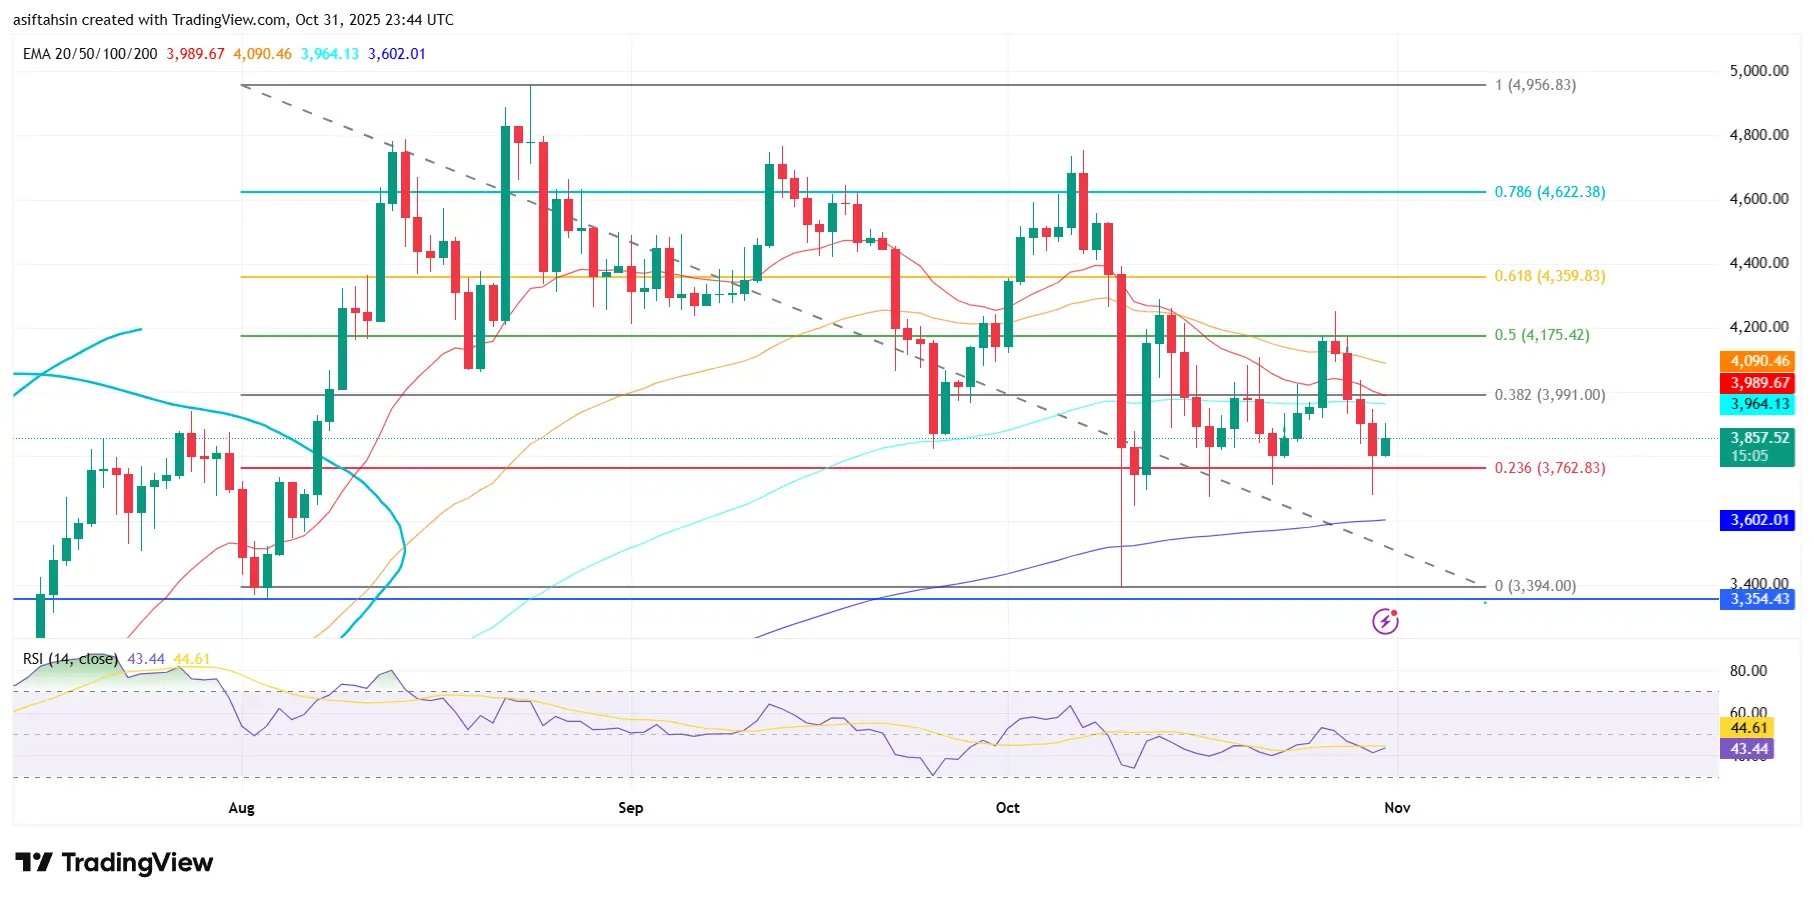
ETH (Ethereum) Technical Outlook: Holding Above Key Support, Bulls Eye Rebound Toward $4,000+
Ethereum is currently consolidating near $3,850, showing signs of stabilization after a recent pullback. The price is testing support at $3,760 (Fib 0.236) — a critical zone that has previously acted as a pivot for short-term trend shifts. Holding above this level could pave the way for a recovery toward the upper range.
The 20 EMA ($3,989) and 50 EMA ($4,090) remain immediate resistance barriers. A breakout above $3,990 (Fib 0.382) would indicate growing bullish momentum, potentially targeting $4,175
ETH7.93%
- Reward
- 14
- 13
- Repost
- Share
NewName:
Thank you for information! View More