2025 C Price Prediction: Analyzing Market Trends and Factors Shaping the Future Value
Introduction: C's Market Position and Investment Value
Chainbase (C), as a foundational layer for the DataFi era, has made significant strides since its inception. As of 2025, Chainbase's market capitalization stands at $14,520,000, with a circulating supply of approximately 160,000,000 tokens, and a price hovering around $0.09075. This asset, often referred to as the "AI-ready data enabler," is playing an increasingly crucial role in transforming fragmented onchain signals into structured, verifiable data for AI applications.
This article will provide a comprehensive analysis of Chainbase's price trends from 2025 to 2030, combining historical patterns, market supply and demand, ecosystem development, and macroeconomic factors to offer professional price predictions and practical investment strategies for investors.
I. C Price History Review and Current Market Status
C Historical Price Evolution
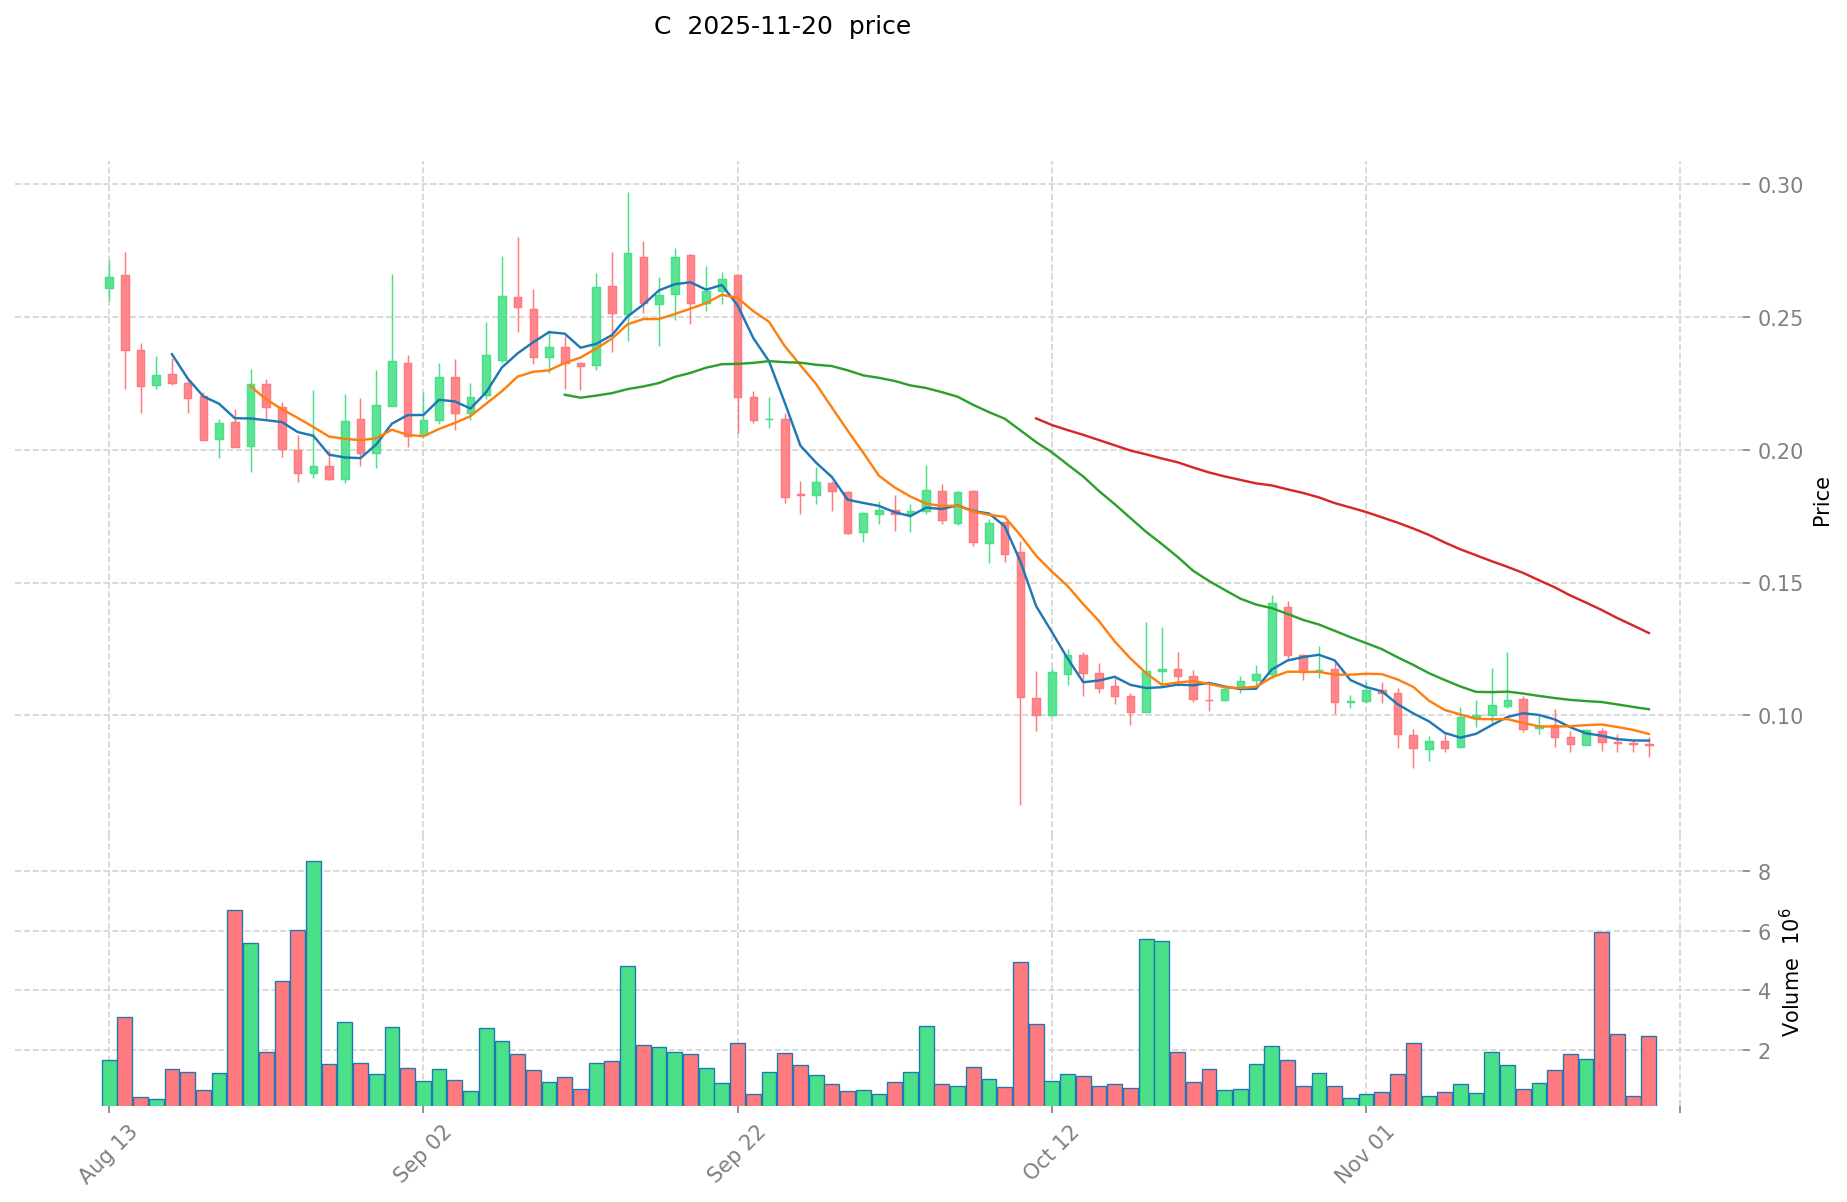
- July 2025: C reached its all-time high of $0.5396, marking a significant milestone for the project.
- October 2025: The token experienced a sharp decline, hitting its all-time low of $0.0661, indicating high market volatility.
- November 2025: C has shown signs of recovery, with the current price at $0.09075, representing a 37.29% increase from its all-time low.
C Current Market Situation
As of November 20, 2025, C is trading at $0.09075, with a 24-hour trading volume of $413,882.24. The token has seen a 2.35% increase in the last 24 hours, suggesting a short-term positive momentum. However, looking at longer timeframes, C has experienced a 8.02% decrease over the past week and a 16.36% decline in the last 30 days. Despite these recent downtrends, C has shown impressive growth over the past year, with a 65.90% increase.
The current market capitalization of C stands at $14,520,000, ranking it at 1061 in the global cryptocurrency market. With a circulating supply of 160,000,000 C tokens and a total supply of 1,000,000,000, the project has a circulating ratio of 16%. The fully diluted market cap is $90,750,000.
Click to view the current C market price
C Market Sentiment Indicator
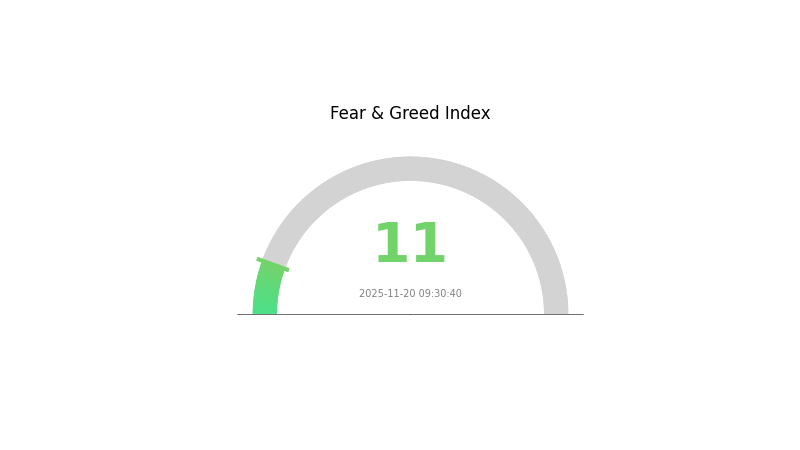
2025-11-20 Fear and Greed Index: 11 (Extreme Fear)
Click to view the current Fear & Greed Index
The crypto market is gripped by extreme fear, with the index plummeting to 11. This level of pessimism often presents opportunities for contrarian investors. While caution is warranted, historical data suggests that extreme fear can precede market rebounds. Savvy traders might consider dollar-cost averaging or exploring oversold assets. However, it's crucial to conduct thorough research and manage risks carefully in such volatile conditions. Remember, market sentiment can shift rapidly, and patience is key in navigating these turbulent waters.
C Holdings Distribution
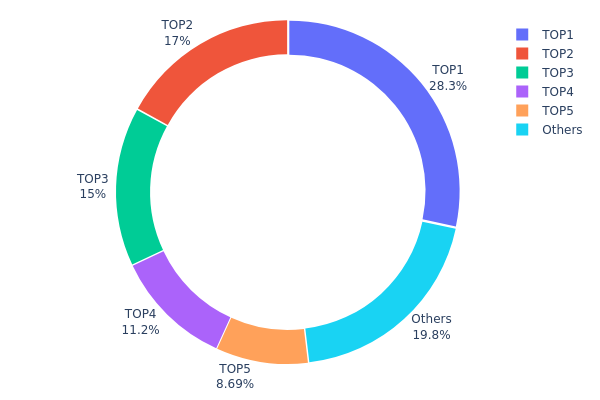
The address holdings distribution chart provides insight into the concentration of C tokens among various wallet addresses. Analysis of the current data reveals a highly concentrated distribution pattern, with the top 5 addresses collectively holding 80.23% of the total supply.
The largest holder possesses 28.34% of all tokens, followed by two addresses with 17% and 15% respectively. This high concentration raises concerns about potential market manipulation and price volatility. With such a significant portion of tokens in few hands, large-scale transactions by these major holders could dramatically impact market dynamics and liquidity.
This concentration level suggests a relatively low degree of decentralization for C, which may affect its resilience and stability in the long term. While a certain level of concentration is not uncommon in the crypto space, the current distribution indicates a need for increased diversification to enhance market stability and reduce manipulation risks.
Click to view the current C Holdings Distribution
| Top | Address | Holding Qty | Holding (%) |
|---|---|---|---|
| 1 | 0x81e7...fdb2b2 | 283428.57K | 28.34% |
| 2 | 0x2219...4fb170 | 170000.00K | 17.00% |
| 3 | 0xee91...a6504b | 150000.00K | 15.00% |
| 4 | 0xff5a...931888 | 112000.00K | 11.20% |
| 5 | 0x2d49...950ccd | 86939.01K | 8.69% |
| - | Others | 197632.42K | 19.77% |
II. Key Factors Affecting C's Future Price
Supply Mechanism
- Halving: Periodic reduction in mining rewards, reducing new supply
- Historical Pattern: Previous halvings have led to price increases
- Current Impact: Next halving expected to reduce inflation rate, potentially supporting price
Institutional and Whale Dynamics
- Institutional Holdings: Growing interest from institutional investors
- Corporate Adoption: Some companies adding C to balance sheets as reserve asset
- Government Policies: Varied regulatory approaches globally, with increasing clarity in some jurisdictions
Macroeconomic Environment
- Monetary Policy Impact: Central bank policies influencing risk asset demand
- Inflation Hedging Properties: Often viewed as potential hedge against inflation
- Geopolitical Factors: Global economic uncertainties may increase demand for alternative assets
Technical Development and Ecosystem Building
- Scalability Improvements: Ongoing work to increase transaction throughput
- Privacy Enhancements: Development of privacy-focused features
- Ecosystem Applications: Growing DeFi and NFT sectors building on C's network
III. C Price Prediction for 2025-2030
2025 Outlook
- Conservative forecast: $0.079 - $0.09081
- Neutral forecast: $0.09081 - $0.11
- Optimistic forecast: $0.11 - $0.12078 (requires favorable market conditions)
2027-2028 Outlook
- Market phase expectation: Potential growth phase
- Price range forecast:
- 2027: $0.09206 - $0.17322
- 2028: $0.08095 - $0.18103
- Key catalysts: Market adoption, technological advancements
2030 Long-term Outlook
- Base scenario: $0.17477 - $0.20 (assuming steady market growth)
- Optimistic scenario: $0.20 - $0.24118 (assuming strong market performance)
- Transformative scenario: $0.24118 - $0.28 (assuming breakthrough innovations)
- 2030-12-31: C $0.24118 (potential peak price)
| 年份 | 预测最高价 | 预测平均价格 | 预测最低价 | 涨跌幅 |
|---|---|---|---|---|
| 2025 | 0.12078 | 0.09081 | 0.079 | 0 |
| 2026 | 0.13647 | 0.10579 | 0.09839 | 16 |
| 2027 | 0.17322 | 0.12113 | 0.09206 | 33 |
| 2028 | 0.18103 | 0.14718 | 0.08095 | 62 |
| 2029 | 0.18544 | 0.1641 | 0.09682 | 80 |
| 2030 | 0.24118 | 0.17477 | 0.11185 | 92 |
IV. Professional Investment Strategies and Risk Management for C
C Investment Methodology
(1) Long-term Holding Strategy
- Suitable for: Long-term investors with high risk tolerance
- Operational suggestions:
- Accumulate C tokens during market dips
- Set price targets and regularly rebalance portfolio
- Store tokens in secure hardware wallets
(2) Active Trading Strategy
- Technical analysis tools:
- Moving Averages: Use to identify trends and potential reversal points
- RSI (Relative Strength Index): Measure overbought/oversold conditions
- Key points for swing trading:
- Monitor trading volume for trend confirmation
- Set stop-loss orders to limit potential losses
C Risk Management Framework
(1) Asset Allocation Principles
- Conservative investors: 1-3% of crypto portfolio
- Aggressive investors: 5-10% of crypto portfolio
- Professional investors: Up to 15% of crypto portfolio
(2) Risk Hedging Solutions
- Diversification: Spread investments across multiple cryptocurrencies
- Options contracts: Use to protect against downside risk
(3) Secure Storage Solutions
- Hot wallet recommendation: Gate Web3 Wallet
- Cold storage solution: Hardware wallets for long-term holdings
- Security precautions: Enable two-factor authentication, use strong passwords
V. Potential Risks and Challenges for C
C Market Risks
- High volatility: C price may experience significant fluctuations
- Liquidity risk: Limited trading volume may affect ability to exit positions
- Market sentiment: Susceptible to broader crypto market trends
C Regulatory Risks
- Uncertain regulatory environment: Potential for unfavorable regulations
- Compliance challenges: Changing legal landscape may impact C's operations
- Cross-border restrictions: International regulations may limit adoption
C Technical Risks
- Smart contract vulnerabilities: Potential for exploits or bugs
- Scalability issues: Network congestion during high demand periods
- Technological obsolescence: Rapid advancements may outpace C's development
VI. Conclusion and Action Recommendations
C Investment Value Assessment
C presents a high-risk, high-reward opportunity in the emerging DataFi sector. Long-term potential is significant, but short-term volatility and regulatory uncertainties pose substantial risks.
C Investment Recommendations
✅ Beginners: Start with small positions, focus on education and risk management ✅ Experienced investors: Consider allocating a portion of crypto portfolio, employ dollar-cost averaging ✅ Institutional investors: Conduct thorough due diligence, potentially explore strategic partnerships
C Trading Participation Methods
- Spot trading: Purchase C tokens on Gate.com
- Staking: Participate in staking programs if available
- DeFi integration: Explore decentralized finance opportunities involving C tokens
Cryptocurrency investments carry extremely high risks, and this article does not constitute investment advice. Investors should make decisions cautiously based on their own risk tolerance and are advised to consult professional financial advisors. Never invest more than you can afford to lose.
FAQ
What is the price target for C in 2025?
Based on current market trends and expert analysis, the price target for C in 2025 is projected to reach $150-$200, reflecting significant growth potential in the crypto market.
Is C stock a buy, sell, or hold?
Based on current market trends and analysis, C stock appears to be a buy. The cryptocurrency has shown strong potential for growth in the Web3 ecosystem.
How much will Costco stock be worth in 2030?
Based on current growth trends, Costco stock could potentially reach $800-$1000 per share by 2030, driven by continued expansion and strong consumer loyalty.
Is Celestica a good buy now?
Yes, Celestica looks promising. Its strong financials and growing market share in the electronics manufacturing sector make it an attractive investment option in 2025.
Share
Content
Introduction: C's Market Position and Investment Value
I. C Price History Review and Current Market Status
II. Key Factors Affecting C's Future Price
III. C Price Prediction for 2025-2030
IV. Professional Investment Strategies and Risk Management for C
V. Potential Risks and Challenges for C
VI. Conclusion and Action Recommendations
FAQ

