2025 ENJ Price Prediction: Analyzing Market Trends and Potential Growth for Enjin Coin
Introduction: ENJ's Market Position and Investment Value
Enjin Coin (ENJ), as a leading platform in the gaming and virtual goods sector, has made significant strides since its inception in 2017. As of 2025, Enjin Coin's market capitalization has reached $69,633,480, with a circulating supply of approximately 1,903,074,071 coins, and a price hovering around $0.03659. This asset, often referred to as the "gaming ecosystem token," is playing an increasingly crucial role in the fields of online gaming communities and virtual asset management.
This article will provide a comprehensive analysis of Enjin Coin's price trends from 2025 to 2030, considering historical patterns, market supply and demand, ecosystem development, and macroeconomic factors to offer professional price predictions and practical investment strategies for investors.
I. ENJ Price History Review and Current Market Status
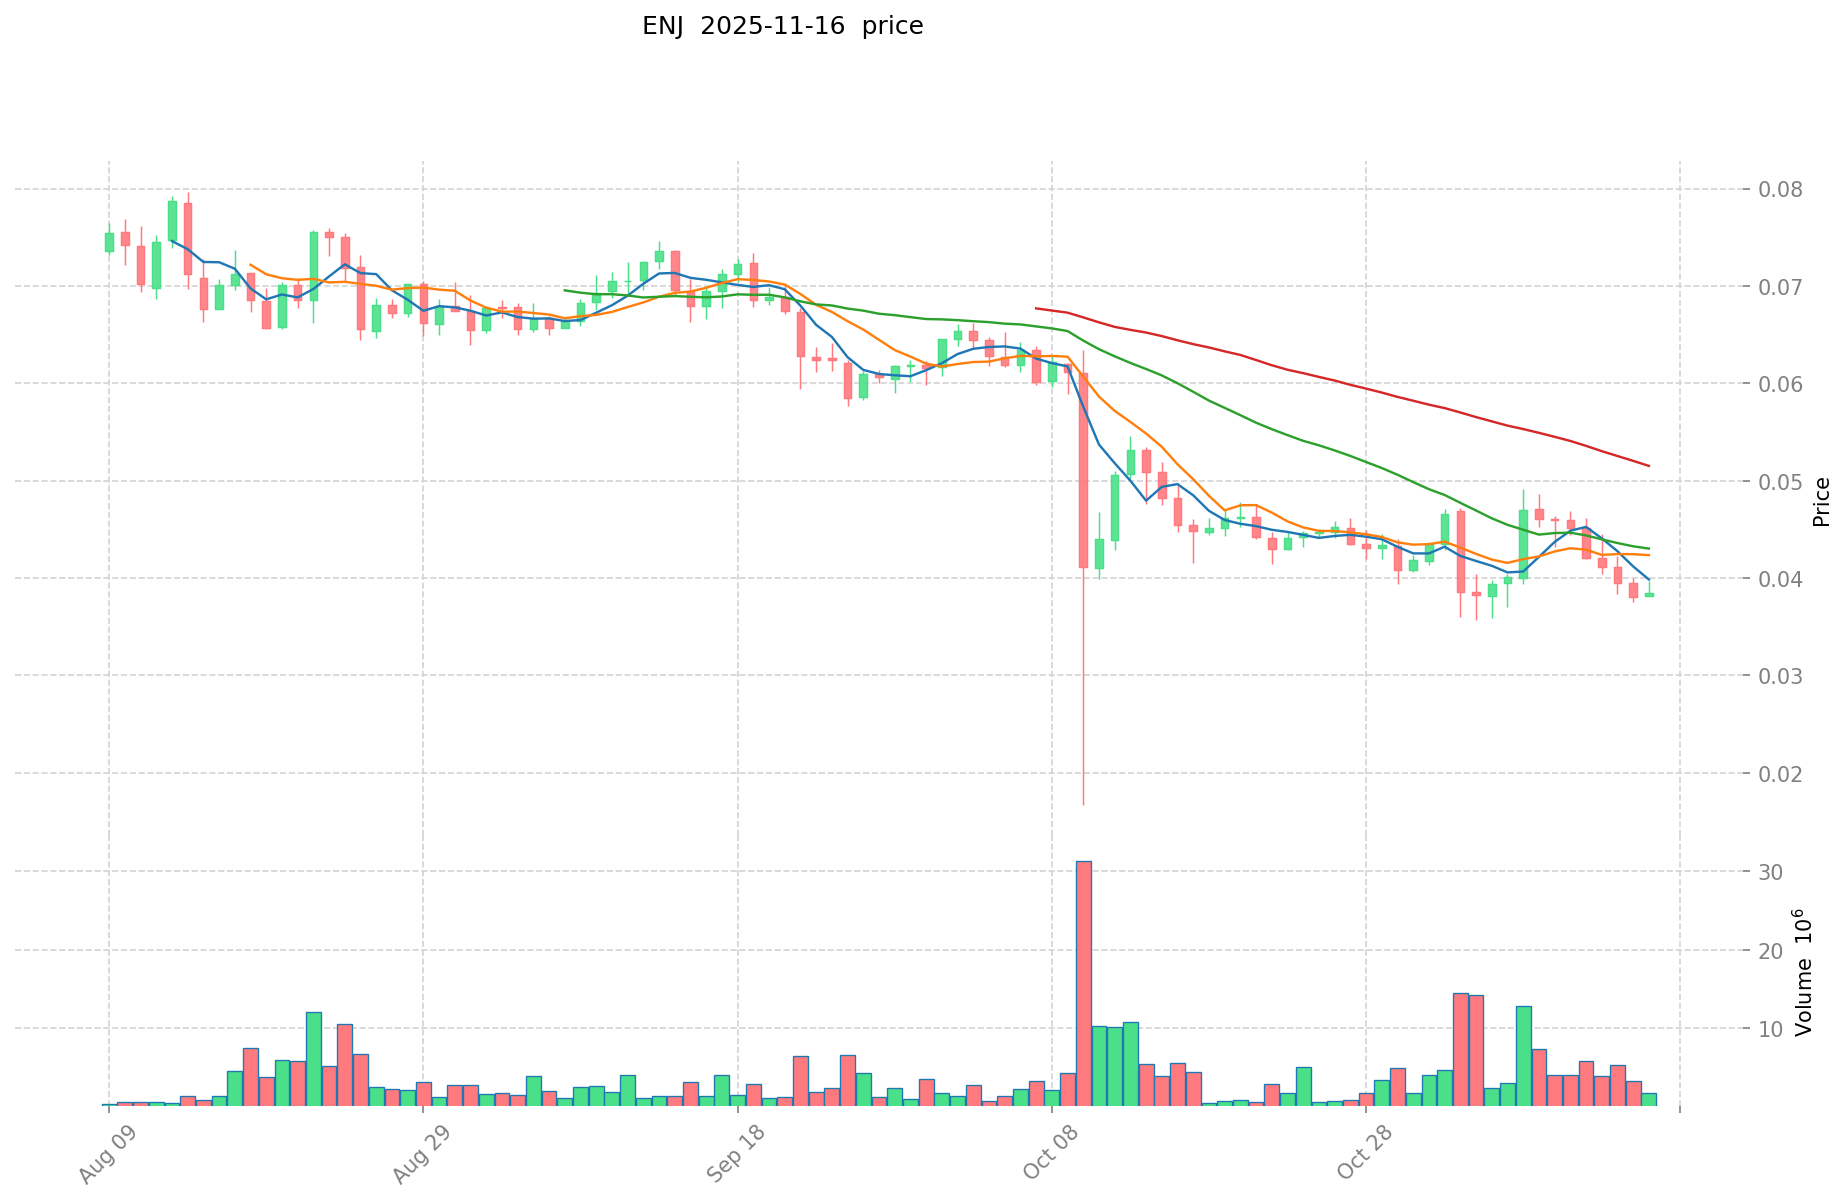
ENJ Historical Price Evolution
- 2017: ENJ launched, price reached an all-time low of $0.01865964 on November 12
- 2021: Bull market peak, ENJ hit an all-time high of $4.82 on November 25
- 2022-2025: Prolonged bear market, price declined from the peak to current levels
ENJ Current Market Situation
As of November 17, 2025, ENJ is trading at $0.03659, ranking 454th in the crypto market. The token has experienced significant volatility in the past 24 hours, with a 4.97% decrease. ENJ's market capitalization stands at $69,633,480, with a circulating supply of 1,903,074,071 tokens. The current price represents a 99.24% decline from its all-time high and a 96.04% increase from its all-time low. The 24-hour trading volume is $144,123, indicating moderate market activity. Short-term price trends show a 0.33% increase in the last hour, but significant declines of 20.91% and 19.32% over the past 7 and 30 days, respectively. The long-term performance is notably bearish, with a 77.44% decrease over the past year.
Click to view the current ENJ market price
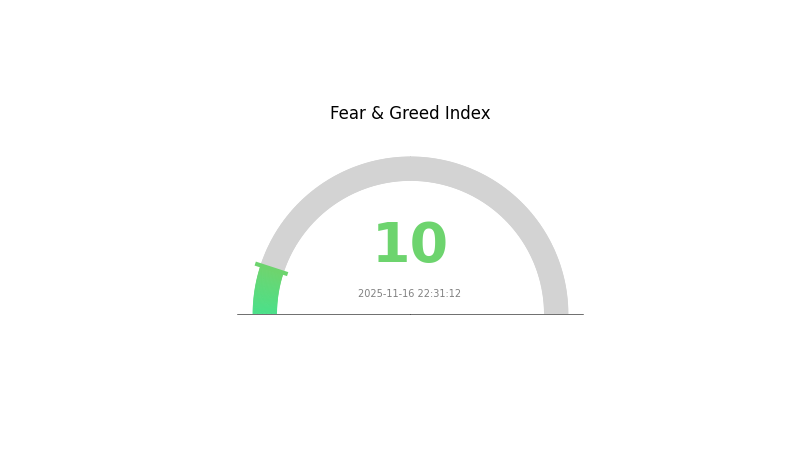
ENJ Market Sentiment Indicator
2025-11-16 Fear and Greed Index: 10 (Extreme Fear)
Click to view the current Fear & Greed Index
The cryptocurrency market is currently experiencing extreme fear, with the Fear and Greed Index plummeting to 10. This indicates a high level of pessimism among investors, potentially creating opportunities for contrarian traders. During such periods of extreme fear, assets may be undervalued, presenting potential buying opportunities for those with a long-term perspective. However, caution is advised as market volatility may persist. Traders should consider diversifying their portfolios and implementing risk management strategies to navigate these uncertain times.
ENJ Holdings Distribution
The address holdings distribution data for ENJ reveals a significant concentration of tokens in a few key addresses. The top address, likely a burn address given its "dead" suffix, holds 43.10% of the total supply, effectively removing a large portion from circulation. The second-largest holder possesses 10.58%, while the remaining top addresses hold between 1.63% and 4.39% each.
This distribution pattern indicates a high level of centralization, with the top five addresses controlling approximately 62.18% of the total ENJ supply. Such concentration could potentially impact market dynamics, as large holders have the capacity to influence price movements through significant buy or sell orders. The presence of a substantial burn address may contribute to scarcity, potentially supporting token value, but also raises questions about the actual circulating supply.
The current distribution structure suggests a relatively low level of decentralization for ENJ. While this concentration may provide some stability by limiting the number of large players who can impact the market, it also introduces risks of market manipulation and volatility if any of the major holders decide to liquidate their positions. Investors and market participants should be aware of this concentration when considering ENJ's market behavior and potential future developments.
Click to view the current ENJ Holdings Distribution
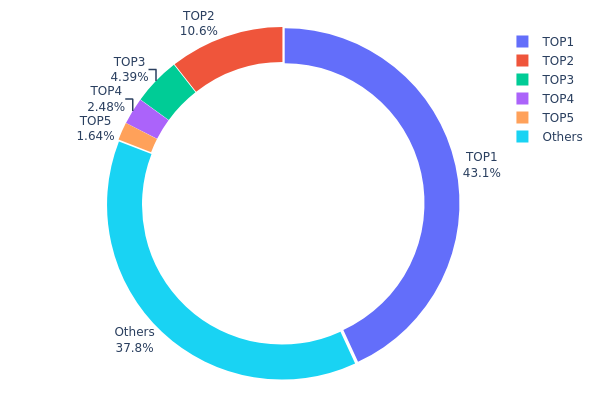
| Top | Address | Holding Qty | Holding (%) |
|---|---|---|---|
| 1 | 0x0000...00dead | 431095.30K | 43.10% |
| 2 | 0xf977...41acec | 105873.12K | 10.58% |
| 3 | 0xd4e6...888127 | 43928.55K | 4.39% |
| 4 | 0x3727...866be8 | 24828.55K | 2.48% |
| 5 | 0xf30b...0f0eb0 | 16360.78K | 1.63% |
| - | Others | 377913.70K | 37.82% |
II. Key Factors Affecting ENJ's Future Price
Supply Mechanism
- Maximum Supply: ENJ has a maximum supply of 1 billion tokens.
- Deflationary Mechanism: ENJ tokens are burned when used to mint NFTs, creating a deflationary effect.
- Current Impact: The ongoing token burning process may contribute to a gradual reduction in circulating supply, potentially supporting price stability or appreciation over time.
Institutional and Whale Dynamics
- Enterprise Adoption: Companies like Microsoft and Samsung have shown interest in Enjin's technology for gaming and digital collectibles.
Technical Development and Ecosystem Building
- Efinity: Enjin's scalable blockchain for NFTs on Polkadot, enhancing cross-chain capabilities and transaction speeds.
- JumpNet: A high-speed bridge network enabling free, instant on-chain transactions for Enjin-powered assets.
- Ecosystem Applications: Various gaming projects and NFT platforms utilize Enjin's technology for in-game assets and digital collectibles.
III. ENJ Price Prediction for 2025-2030
2025 Outlook
- Conservative prediction: $0.02606 - $0.03671
- Neutral prediction: $0.03671 - $0.04148
- Optimistic prediction: $0.04148 - $0.04625 (requires positive market sentiment)
2027-2028 Outlook
- Market stage expectation: Potential growth phase
- Price range forecast:
- 2027: $0.04006 - $0.06166
- 2028: $0.03893 - $0.0656
- Key catalysts: Increased adoption of ENJ in gaming and NFT ecosystems
2029-2030 Long-term Outlook
- Base scenario: $0.05590 - $0.06096 (assuming steady market growth)
- Optimistic scenario: $0.06096 - $0.07558 (assuming strong market performance)
- Transformative scenario: $0.07558+ (extremely favorable market conditions)
- 2030-12-31: ENJ $0.06096 (potential 66% increase from 2025)
| 年份 | 预测最高价 | 预测平均价格 | 预测最低价 | 涨跌幅 |
|---|---|---|---|---|
| 2025 | 0.04625 | 0.03671 | 0.02606 | 0 |
| 2026 | 0.04853 | 0.04148 | 0.03733 | 13 |
| 2027 | 0.06166 | 0.04501 | 0.04006 | 23 |
| 2028 | 0.0656 | 0.05333 | 0.03893 | 45 |
| 2029 | 0.06244 | 0.05947 | 0.0559 | 62 |
| 2030 | 0.07558 | 0.06096 | 0.03718 | 66 |
IV. ENJ Professional Investment Strategies and Risk Management
ENJ Investment Methodology
(1) Long-term Holding Strategy
- Suitable for: Investors with a high risk tolerance and belief in the gaming industry's blockchain integration
- Operation suggestions:
- Accumulate ENJ during market dips
- Stay informed about Enjin's ecosystem developments and partnerships
- Store ENJ in a secure hardware wallet for long-term holding
(2) Active Trading Strategy
- Technical analysis tools:
- Moving Averages: Use to identify trends and potential entry/exit points
- Relative Strength Index (RSI): Monitor overbought/oversold conditions
- Key points for swing trading:
- Monitor gaming industry news and Enjin's project updates
- Set stop-loss orders to manage risk
ENJ Risk Management Framework
(1) Asset Allocation Principles
- Conservative investors: 1-3% of crypto portfolio
- Aggressive investors: 5-10% of crypto portfolio
- Professional investors: Up to 15% of crypto portfolio
(2) Risk Hedging Solutions
- Diversification: Spread investments across various gaming-related tokens
- Stop-loss orders: Implement to limit potential losses
(3) Secure Storage Solutions
- Hot wallet recommendation: Gate web3 wallet
- Cold storage solution: Hardware wallet for long-term storage
- Security precautions: Enable two-factor authentication, use strong passwords, and keep private keys offline
V. ENJ Potential Risks and Challenges
ENJ Market Risks
- High volatility: ENJ price can experience significant fluctuations
- Gaming industry dependency: Performance tied to adoption of blockchain in gaming
- Competition: Other gaming-focused cryptocurrencies may gain market share
ENJ Regulatory Risks
- Uncertain regulatory environment: Potential for increased scrutiny of gaming tokens
- Cross-border restrictions: Varying regulations may limit global adoption
- Tax implications: Unclear tax treatment of gaming-related cryptocurrencies
ENJ Technical Risks
- Smart contract vulnerabilities: Potential for exploits in the Enjin ecosystem
- Scalability challenges: May face issues with increased adoption
- Interoperability concerns: Integration with various gaming platforms may be complex
VI. Conclusion and Action Recommendations
ENJ Investment Value Assessment
ENJ offers potential long-term value in the growing blockchain gaming sector but faces short-term volatility and adoption challenges.
ENJ Investment Recommendations
✅ Beginners: Start with small positions and focus on learning about the gaming industry and blockchain technology ✅ Experienced investors: Consider ENJ as part of a diversified crypto portfolio, focusing on gaming-related assets ✅ Institutional investors: Conduct thorough due diligence on Enjin's technology and partnerships before significant investment
ENJ Trading Participation Methods
- Spot trading: Buy and sell ENJ on Gate.com
- Staking: Participate in staking programs if available on supported platforms
- DeFi integration: Explore decentralized finance opportunities involving ENJ tokens
Cryptocurrency investments carry extremely high risks, and this article does not constitute investment advice. Investors should make decisions cautiously based on their own risk tolerance and are advised to consult professional financial advisors. Never invest more than you can afford to lose.
FAQ
What will Enjin be worth in 2025?
Based on market trends and adoption of NFT gaming, Enjin (ENJ) could potentially reach $5-$7 by 2025. However, cryptocurrency prices are highly volatile and unpredictable.
How high will an ENJ go?
ENJ could potentially reach $5-$7 by 2025, driven by gaming industry growth and increased blockchain adoption.
What is the price prediction for ENJ in 2030?
Based on market trends and potential growth, ENJ could reach $5 to $7 by 2030, driven by increased adoption of blockchain gaming and NFTs.
What is the all time high for ENJ?
The all-time high for ENJ was $4.85, reached on November 25, 2021.
Share
Content
Introduction: ENJ's Market Position and Investment Value
I. ENJ Price History Review and Current Market Status
II. Key Factors Affecting ENJ's Future Price
III. ENJ Price Prediction for 2025-2030
IV. ENJ Professional Investment Strategies and Risk Management
V. ENJ Potential Risks and Challenges
VI. Conclusion and Action Recommendations
FAQ

