2025 FORT Price Prediction: Will This Gaming Token Reach New All-Time Highs in the Next Bull Market?
Introduction: FORT's Market Position and Investment Value
Forta (FORT), as a decentralized monitoring network for blockchain security, has been detecting threats and anomalies in DeFi, NFT, governance, bridges, and other Web3 systems in real-time since its inception. As of 2025, Forta's market capitalization has reached $32,331,289, with a circulating supply of approximately 625,484,416 tokens, and a price hovering around $0.05169. This asset, known as the "real-time blockchain watchdog," is playing an increasingly crucial role in ensuring the security and operational integrity of blockchain activities.
This article will provide a comprehensive analysis of Forta's price trends from 2025 to 2030, combining historical patterns, market supply and demand, ecosystem development, and macroeconomic factors to offer professional price predictions and practical investment strategies for investors.
I. FORT Price History Review and Current Market Status
FORT Historical Price Evolution
- 2022: Reached all-time high of $0.964645 on June 16, marking peak of early growth phase
- 2023-2024: Extended downtrend as broader crypto market declined
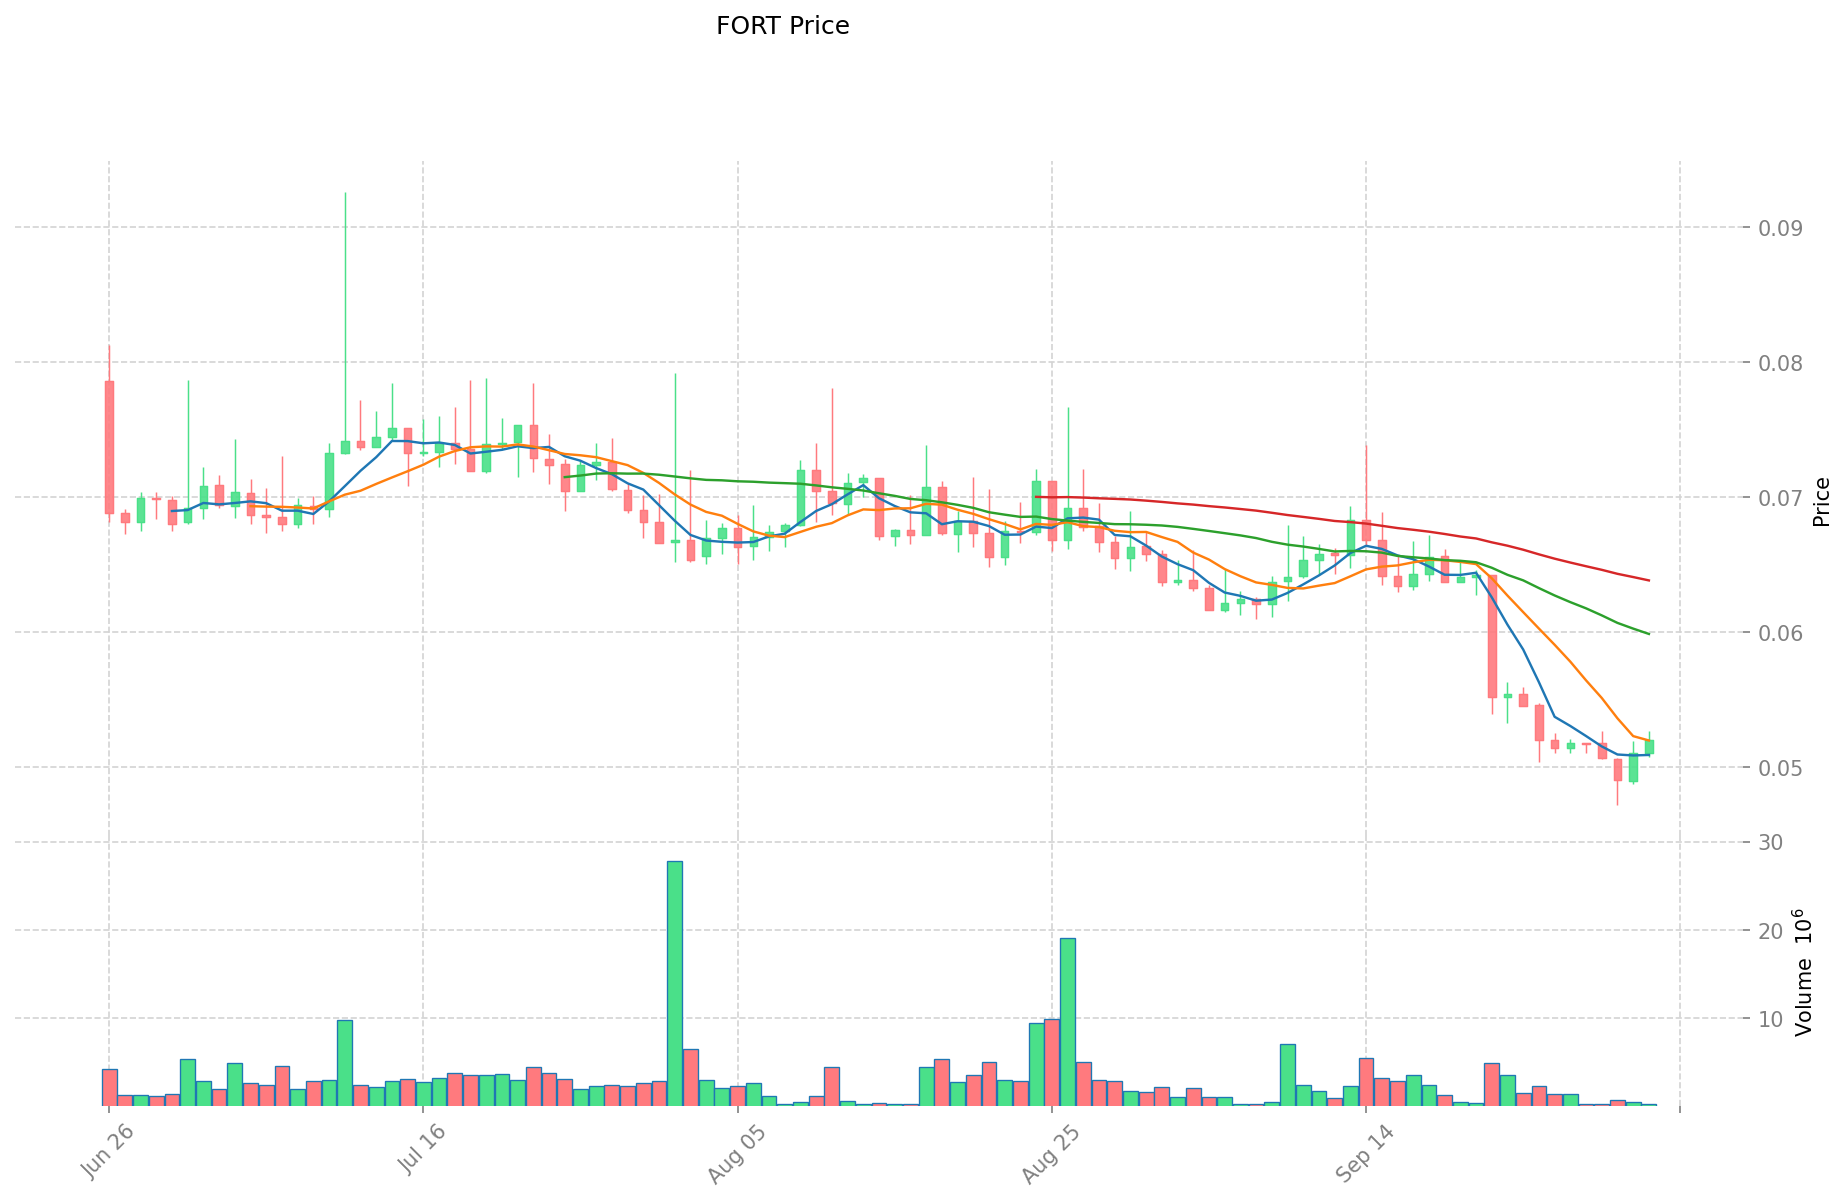
- 2025: Hit all-time low of $0.04734884 on October 1, signaling potential bottom of bear cycle
FORT Current Market Situation
As of October 3, 2025, FORT is trading at $0.05169, up 1.73% in the last 24 hours. The token has shown some signs of stabilization after reaching its all-time low just two days ago. However, FORT remains down 19.06% over the past 30 days and 54.22% over the past year, indicating persistent bearish pressure.
The current market capitalization stands at $32,331,289, ranking FORT at 883rd among all cryptocurrencies. With a circulating supply of 625,484,416 FORT tokens, representing 62.55% of the total supply, there is still significant room for supply expansion.
Trading volume in the last 24 hours reached $16,398, suggesting relatively low liquidity compared to its market cap. The token's price is currently 94.64% below its all-time high, potentially presenting an opportunity for investors who believe in the project's long-term potential.
Click to view the current FORT market price
FORT Market Sentiment Indicator
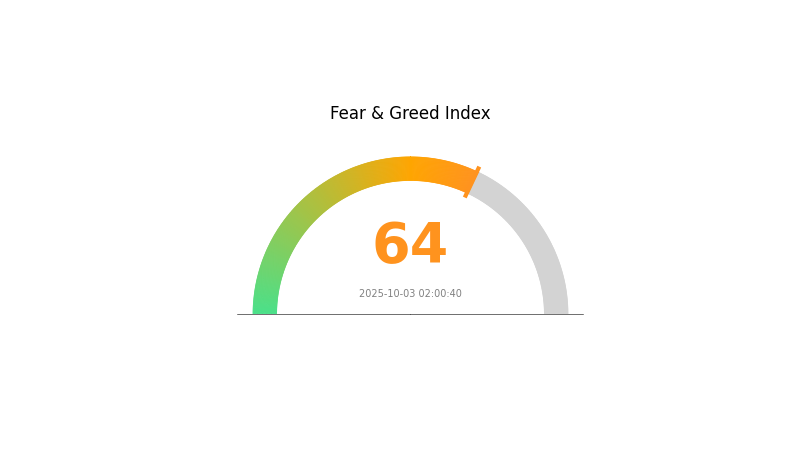
2025-10-03 Fear and Greed Index: 64 (Greed)
Click to view the current Fear & Greed Index
The crypto market is showing signs of greed today, with the Fear and Greed Index at 64. This indicates growing optimism among investors, potentially driven by positive market trends or favorable news. However, it's crucial to remain cautious, as excessive greed can lead to overvaluation and increased volatility. Traders should consider diversifying their portfolios and setting stop-loss orders to protect against sudden market shifts. As always, thorough research and risk management are essential in navigating the dynamic crypto landscape.
FORT Holdings Distribution
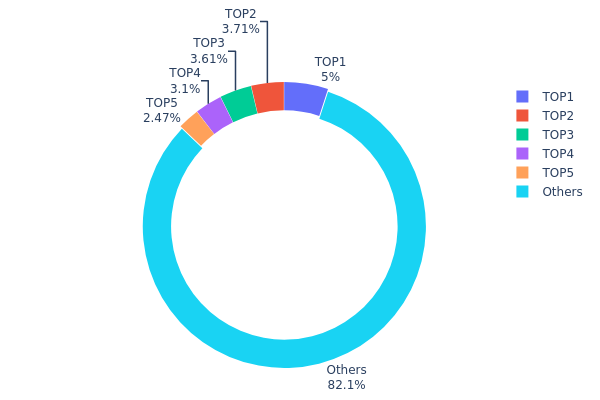
The address holdings distribution chart provides insights into the concentration of FORT tokens among different wallet addresses. Based on the data, the top 5 addresses collectively hold 17.86% of the total FORT supply, with the largest single address owning 5% of tokens. This distribution pattern suggests a moderate level of concentration, as no single address holds an overwhelming majority of tokens.
While there is some concentration among the top holders, it's notable that 82.14% of FORT tokens are distributed among other addresses. This relatively wide distribution indicates a fair degree of decentralization in token ownership. The current distribution structure may contribute to market stability, as no single entity has excessive control over the token supply. However, coordinated actions by the top holders could still potentially impact price movements.
Overall, the FORT token distribution reflects a balance between having prominent stakeholders and maintaining a dispersed ownership base. This structure suggests a moderate level of decentralization and could contribute to a more resilient on-chain ecosystem, potentially reducing the risk of market manipulation by any single entity.
Click to view the current FORT Holdings Distribution
| Top | Address | Holding Qty | Holding (%) |
|---|---|---|---|
| 1 | 0xfd15...5045f0 | 50004.90K | 5.00% |
| 2 | 0xc2c8...359564 | 37081.14K | 3.70% |
| 3 | 0x61d0...192762 | 36146.35K | 3.61% |
| 4 | 0x40ec...5bbbdf | 30960.14K | 3.09% |
| 5 | 0xf6af...f2c7af | 24663.32K | 2.46% |
| - | Others | 821144.15K | 82.14% |
II. Key Factors Influencing FORT's Future Price
Supply Mechanism
- Historical patterns: Past supply changes have impacted FORT's price, with increased supply typically leading to downward pressure.
- Current impact: The expected supply changes may affect FORT's price in the short to medium term.
Institutional and Whale Dynamics
- Institutional holdings: Major institutions' FORT holdings can significantly influence price movements.
- Corporate adoption: Companies adopting FORT for various use cases may drive demand and price appreciation.
Macroeconomic Environment
- Monetary policy impact: Central bank policies, particularly those of major economies, can affect FORT's value as an alternative asset.
- Inflation hedge properties: FORT's performance in inflationary environments may impact its appeal as a store of value.
- Geopolitical factors: International tensions and conflicts can drive demand for FORT as a potential safe-haven asset.
Technological Development and Ecosystem Building
- DeFi integration: Advancements in FORT's integration with decentralized finance platforms could expand its utility and demand.
- Ecosystem applications: The development of major DApps and ecosystem projects built on FORT can drive adoption and value.
III. FORT Price Prediction for 2025-2030
2025 Outlook
- Conservative estimate: $0.03725 - $0.05173
- Neutral estimate: $0.05173 - $0.06363
- Optimistic estimate: $0.06363 - $0.07553 (requires strong market recovery and increased adoption)
2027-2028 Outlook
- Market phase expectation: Potential growth phase with increasing adoption
- Price range forecast:
- 2027: $0.05488 - $0.09073
- 2028: $0.0754 - $0.08687
- Key catalysts: Technological advancements, expanding use cases, and overall crypto market growth
2029-2030 Long-term Outlook
- Base scenario: $0.08441 - $0.09581 (assuming steady market growth and adoption)
- Optimistic scenario: $0.10720 - $0.13892 (assuming accelerated adoption and favorable market conditions)
- Transformative scenario: $0.13892+ (given breakthrough applications and mainstream integration)
- 2030-12-31: FORT $0.09581 (84% increase from 2025 levels)
| 年份 | 预测最高价 | 预测平均价格 | 预测最低价 | 涨跌幅 |
|---|---|---|---|---|
| 2025 | 0.07553 | 0.05173 | 0.03725 | 0 |
| 2026 | 0.08272 | 0.06363 | 0.04327 | 22 |
| 2027 | 0.09073 | 0.07317 | 0.05488 | 41 |
| 2028 | 0.08687 | 0.08195 | 0.0754 | 58 |
| 2029 | 0.1072 | 0.08441 | 0.05993 | 62 |
| 2030 | 0.13892 | 0.09581 | 0.06802 | 84 |
IV. FORT Professional Investment Strategies and Risk Management
FORT Investment Methodology
(1) Long-term Holding Strategy
- Suitable for: Long-term investors and blockchain security enthusiasts
- Operation suggestions:
- Accumulate FORT tokens during market dips
- Participate in network security activities to earn rewards
- Store tokens in secure wallets with multi-factor authentication
(2) Active Trading Strategy
- Technical analysis tools:
- Moving Averages: Use to identify trend directions and potential reversals
- Relative Strength Index (RSI): Monitor overbought and oversold conditions
- Key points for swing trading:
- Monitor blockchain security events that may impact FORT's value
- Pay attention to network upgrades and partnerships announcements
FORT Risk Management Framework
(1) Asset Allocation Principles
- Conservative investors: 1-3%
- Aggressive investors: 5-10%
- Professional investors: Up to 15%
(2) Risk Hedging Solutions
- Diversification: Balance FORT with other crypto assets and traditional investments
- Stop-loss orders: Set appropriate stop-loss levels to limit potential losses
(3) Secure Storage Solutions
- Hot wallet recommendation: Gate Web3 Wallet
- Cold storage solution: Hardware wallets for long-term holdings
- Security precautions: Enable two-factor authentication, use strong passwords, and regularly update software
V. Potential Risks and Challenges for FORT
FORT Market Risks
- Volatility: High price fluctuations common in the crypto market
- Liquidity: Potential challenges in large volume trades
- Competition: Emergence of new blockchain security solutions
FORT Regulatory Risks
- Regulatory uncertainty: Evolving global regulations on cryptocurrencies
- Compliance requirements: Potential impact on FORT's network operations
- Jurisdictional differences: Varying legal status across different countries
FORT Technical Risks
- Smart contract vulnerabilities: Potential security breaches in the network
- Scalability challenges: Ability to handle increased network activity
- Technological obsolescence: Risk of newer, more efficient security solutions
VI. Conclusion and Action Recommendations
FORT Investment Value Assessment
FORT presents a unique value proposition in the blockchain security sector, with potential for long-term growth. However, short-term volatility and regulatory uncertainties pose significant risks.
FORT Investment Recommendations
✅ Beginners: Start with small, regular investments to understand the market dynamics ✅ Experienced investors: Consider a moderate allocation with active monitoring of network developments ✅ Institutional investors: Explore strategic partnerships and large-scale participation in the Forta network
FORT Trading Participation Methods
- Spot trading: Buy and sell FORT tokens on Gate.com
- Staking: Participate in network security to earn rewards
- DeFi integration: Explore decentralized finance opportunities involving FORT tokens
Cryptocurrency investments carry extremely high risks, and this article does not constitute investment advice. Investors should make decisions carefully based on their own risk tolerance and are advised to consult professional financial advisors. Never invest more than you can afford to lose.
FAQ
Will Forta Crypto go up?
Yes, Forta is expected to rise significantly. Predictions suggest it could reach $0.207663 by 2030, representing a substantial gain from current levels.
What is Fortinet's stock price prediction?
Fortinet's stock price is predicted to reach $103-$160 by 2030. The short-term forecast suggests $103.11 for tomorrow, with a slight decrease expected.
What is the XRP price prediction in 2025?
Based on current analysis, XRP price is predicted to decrease by 5.67% by October 3, 2025, indicating a bearish trend in the short term.
What price will Shiba Inu reach in 2030?
Shiba Inu is projected to reach around $0.000120 by 2030, with potential fluctuations between $0.000116 and $0.000120, based on current market trends.
Share
Content
Introduction: FORT's Market Position and Investment Value
I. FORT Price History Review and Current Market Status
II. Key Factors Influencing FORT's Future Price
III. FORT Price Prediction for 2025-2030
IV. FORT Professional Investment Strategies and Risk Management
V. Potential Risks and Challenges for FORT
VI. Conclusion and Action Recommendations
FAQ

