2025 GNS Price Prediction: Analyzing Market Trends and Potential Growth Factors for GNS Tokens
Introduction: GNS's Market Position and Investment Value
Gains Network (GNS), as a fair and advanced decentralized leverage trading protocol, has made significant strides since its inception. As of 2025, Gains Network's market capitalization has reached $39,011,484, with a circulating supply of approximately 27,181,915 tokens, and a price hovering around $1.4352. This asset, often referred to as a "decentralized leverage trading innovator," is playing an increasingly crucial role in the fields of cryptocurrency and stock trading with leveraged positions.
This article will provide a comprehensive analysis of Gains Network's price trends from 2025 to 2030, combining historical patterns, market supply and demand, ecosystem development, and macroeconomic factors to offer professional price predictions and practical investment strategies for investors.
I. GNS Price History Review and Current Market Status
GNS Historical Price Evolution Trajectory
- 2021: Project launched, price reached a low of $0.265841 on November 29
- 2023: Market peak, price hit an all-time high of $12.48 on February 17
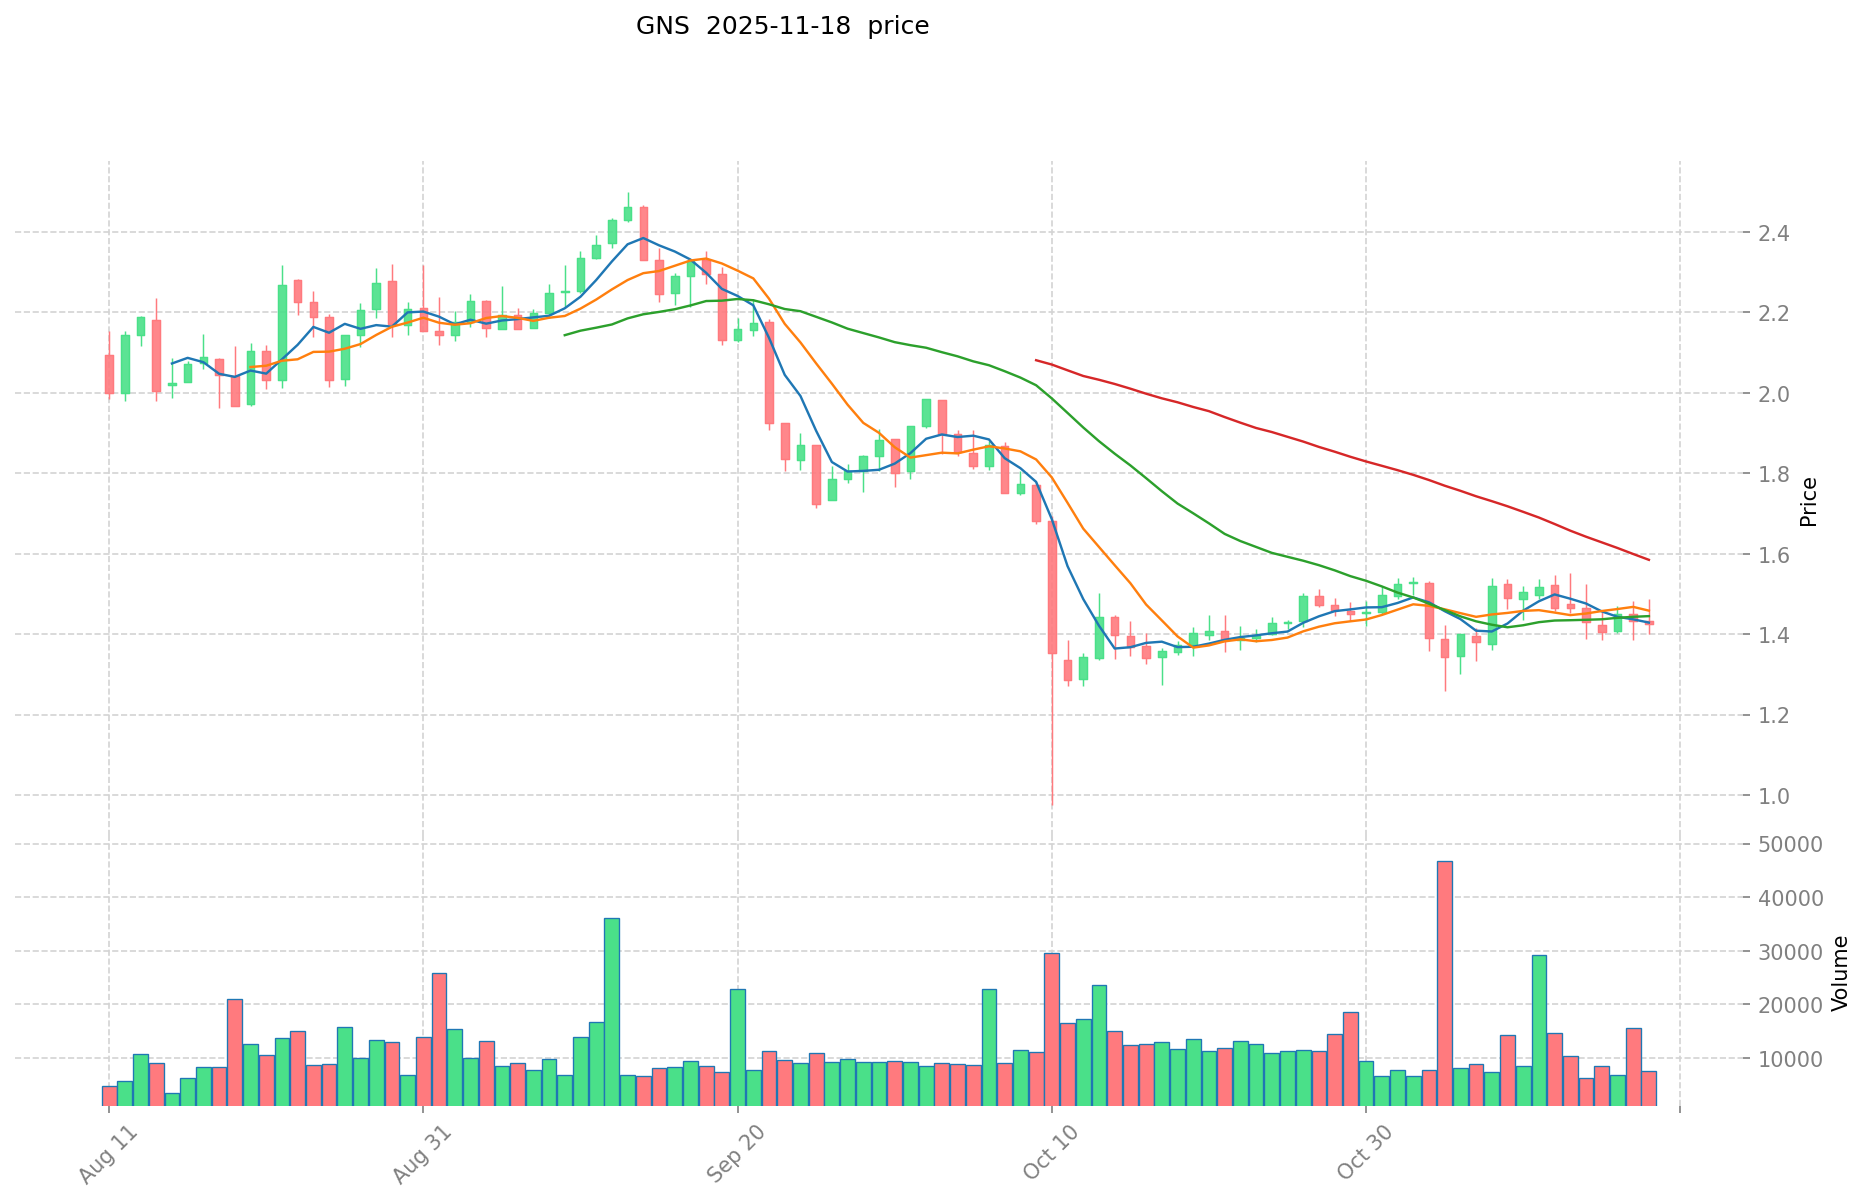
- 2025: Current market cycle, price declined from the high to $1.4352
GNS Current Market Situation
As of November 18, 2025, GNS is trading at $1.4352. Over the past 24 hours, the price has experienced a slight decrease of 0.42%. The 7-day trend shows a more significant decline of 5.48%, while the 30-day performance indicates a positive growth of 5.29%. However, looking at the yearly performance, GNS has seen a substantial decrease of 31.2%.
The current market capitalization of GNS stands at $39,011,484.408, ranking it at 644th position in the global cryptocurrency market. With a circulating supply of 27,181,915 GNS tokens, the project has a market dominance of 0.0011%.
Click to view the current GNS market price
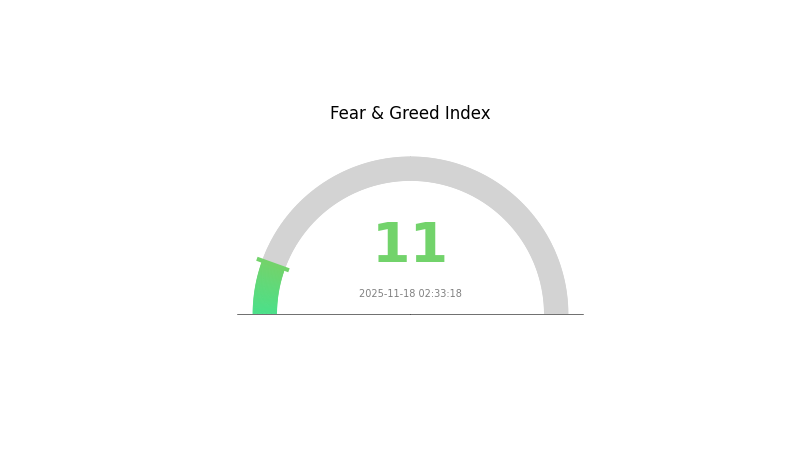
GNS Market Sentiment Indicator
2025-11-18 Fear and Greed Index: 11 (Extreme Fear)
Click to view the current Fear & Greed Index
The crypto market is currently gripped by extreme fear, with the Fear and Greed Index plummeting to 11. This indicates a significant level of pessimism among investors, potentially signaling oversold conditions. Historically, such extreme fear has often preceded market bottoms, presenting potential buying opportunities for contrarian investors. However, caution is advised as market sentiment can remain negative for extended periods. Traders should closely monitor market developments and consider dollar-cost averaging strategies in this uncertain environment.
GNS Holdings Distribution
The address holdings distribution chart for GNS reveals a relatively concentrated ownership structure. The top five addresses collectively hold 65.43% of the total supply, with the largest holder commanding 22.82%. This concentration level raises concerns about potential market manipulation and price volatility.
The second and third largest holders possess 20.60% and 11.21% respectively, further emphasizing the centralized nature of GNS token distribution. Such a concentrated holding pattern could lead to increased market instability, as large-scale transactions by these major holders might significantly impact token price and liquidity.
While 34.57% of the supply is distributed among other addresses, the current structure suggests a limited degree of decentralization. This concentration may pose challenges for GNS in terms of market resilience and could potentially deter some investors concerned about fair market dynamics and long-term stability.
Click to view the current GNS Holdings Distribution

| Top | Address | Holding Qty | Holding (%) |
|---|---|---|---|
| 1 | 0xf977...41acec | 1200.00K | 22.82% |
| 2 | 0x5a52...70efcb | 1083.36K | 20.60% |
| 3 | 0x8c74...e2beca | 589.74K | 11.21% |
| 4 | 0xe780...b6e245 | 335.12K | 6.37% |
| 5 | 0x98ad...8bba9d | 233.26K | 4.43% |
| - | Others | 1815.93K | 34.57% |
II. Key Factors Affecting GNS's Future Price
Macroeconomic Environment
- Monetary Policy Impact: Major central banks' policy expectations may influence GNS price movements.
- Inflation Hedging Properties: GNS's performance in inflationary environments could affect its value.
- Geopolitical Factors: International political situations may impact GNS price trends.
Technological Development and Ecosystem Building
- Ecosystem Applications: Key DApps and ecosystem projects within the Gains Network may drive GNS adoption and value.
III. GNS Price Prediction for 2025-2030
2025 Outlook
- Conservative prediction: $0.80909 - $1.4448
- Neutral prediction: $1.4448 - $1.67597
- Optimistic prediction: $1.67597 and above (requires positive market sentiment and project developments)
2027-2028 Outlook
- Market phase expectation: Potential growth phase with increasing adoption
- Price range forecast:
- 2027: $1.37407 - $2.20966
- 2028: $1.64694 - $2.09426
- Key catalysts: Project milestones, market trends, and technological advancements
2029-2030 Long-term Outlook
- Base scenario: $2.06376 - $2.42491 (assuming steady market growth)
- Optimistic scenario: $2.78607 - $3.56462 (assuming strong project performance and market conditions)
- Transformative scenario: Above $3.56462 (extreme favorable conditions and widespread adoption)
- 2030-12-31: GNS $3.56462 (potential peak based on optimistic projections)
| 年份 | 预测最高价 | 预测平均价格 | 预测最低价 | 涨跌幅 |
|---|---|---|---|---|
| 2025 | 1.67597 | 1.4448 | 0.80909 | 0 |
| 2026 | 2.15333 | 1.56038 | 1.15468 | 8 |
| 2027 | 2.20966 | 1.85686 | 1.37407 | 29 |
| 2028 | 2.09426 | 2.03326 | 1.64694 | 42 |
| 2029 | 2.78607 | 2.06376 | 1.23825 | 44 |
| 2030 | 3.56462 | 2.42491 | 1.3337 | 69 |
IV. GNS Professional Investment Strategies and Risk Management
GNS Investment Methodology
(1) Long-term Holding Strategy
- Suitable for: Risk-tolerant investors with a long-term perspective
- Operation suggestions:
- Accumulate GNS tokens during market dips
- Set price targets and rebalance portfolio periodically
- Store tokens in a secure non-custodial wallet
(2) Active Trading Strategy
- Technical analysis tools:
- Moving Averages: Use to identify trends and potential entry/exit points
- Relative Strength Index (RSI): Monitor overbought/oversold conditions
- Swing trading key points:
- Monitor market sentiment and trading volume
- Set stop-loss orders to manage downside risk
GNS Risk Management Framework
(1) Asset Allocation Principles
- Conservative investors: 1-3% of crypto portfolio
- Aggressive investors: 5-10% of crypto portfolio
- Professional investors: 10-15% of crypto portfolio
(2) Risk Hedging Solutions
- Diversification: Spread investments across multiple crypto assets
- Stop-loss orders: Implement to limit potential losses
(3) Secure Storage Solutions
- Hot wallet recommendation: Gate Web3 Wallet
- Cold storage solution: Hardware wallet for long-term holdings
- Security precautions: Enable two-factor authentication, use strong passwords
V. Potential Risks and Challenges for GNS
GNS Market Risks
- Volatility: Cryptocurrency markets are highly volatile
- Competition: Emerging DeFi protocols may impact GNS market share
- Liquidity: Potential for reduced liquidity during market stress
GNS Regulatory Risks
- Regulatory uncertainty: Changing regulations may impact DeFi protocols
- Cross-border compliance: Varying international regulations may affect adoption
- Tax implications: Evolving tax laws for crypto trading and DeFi
GNS Technical Risks
- Smart contract vulnerabilities: Potential for exploits or bugs
- Scalability challenges: Network congestion may impact performance
- Oracle dependence: Reliance on external data sources for pricing
VI. Conclusion and Action Recommendations
GNS Investment Value Assessment
GNS offers potential long-term value as a decentralized leverage trading protocol, but faces short-term risks due to market volatility and regulatory uncertainties.
GNS Investment Recommendations
✅ Beginners: Start with small positions and focus on education ✅ Experienced investors: Consider dollar-cost averaging and set clear profit targets ✅ Institutional investors: Conduct thorough due diligence and implement risk management strategies
GNS Trading Participation Methods
- Spot trading: Buy and hold GNS tokens on Gate.com
- Yield farming: Participate in liquidity pools or staking programs
- DeFi integration: Use GNS within the Gains Network ecosystem for leverage trading
Cryptocurrency investments carry extremely high risks, and this article does not constitute investment advice. Investors should make decisions carefully based on their own risk tolerance and are advised to consult professional financial advisors. Never invest more than you can afford to lose.
FAQ
Is GNS a good stock to buy?
GNS shows potential with a 52.63% chance of outperforming the market. Its 5/10 rating suggests a balanced outlook, making it worth considering for your portfolio.
What will NVDA be worth in 2025?
NVDA is projected to reach $200 by the end of 2025, based on current market analysis and growth trends.
Should I invest in Genius Group?
Investing in Genius Group could be risky. While educational content is growing, monetization is challenging and competition is fierce. Consider the company's potential carefully before investing.
Is GenM a good investment?
Based on current market trends, GenM may not be a good investment. Its price and market performance suggest limited growth potential in the near future.
Share
Content
Introduction: GNS's Market Position and Investment Value
I. GNS Price History Review and Current Market Status
II. Key Factors Affecting GNS's Future Price
III. GNS Price Prediction for 2025-2030
IV. GNS Professional Investment Strategies and Risk Management
V. Potential Risks and Challenges for GNS
VI. Conclusion and Action Recommendations
FAQ

