2025 RAD Price Prediction: Market Analysis and Future Outlook for Radicle Token
Introduction: RAD's Market Position and Investment Value
Radicle (RAD), as a governance token for the Web3 native network for software collaboration, has made significant strides since its inception in 2021. As of 2025, Radicle's market capitalization has reached $32,000,254, with a circulating supply of approximately 49,829,110 tokens, and a price hovering around $0.6422. This asset, often referred to as the "GitHub of Web3," is playing an increasingly crucial role in decentralized software development and collaboration.
This article will comprehensively analyze Radicle's price trends from 2025 to 2030, considering historical patterns, market supply and demand, ecosystem development, and macroeconomic factors to provide investors with professional price predictions and practical investment strategies.
I. RAD Price History Review and Current Market Status
RAD Historical Price Evolution Trajectory
- 2021: Initial launch, price reached all-time high of $27.61 on April 16
- 2023: Market downturn, price declined significantly
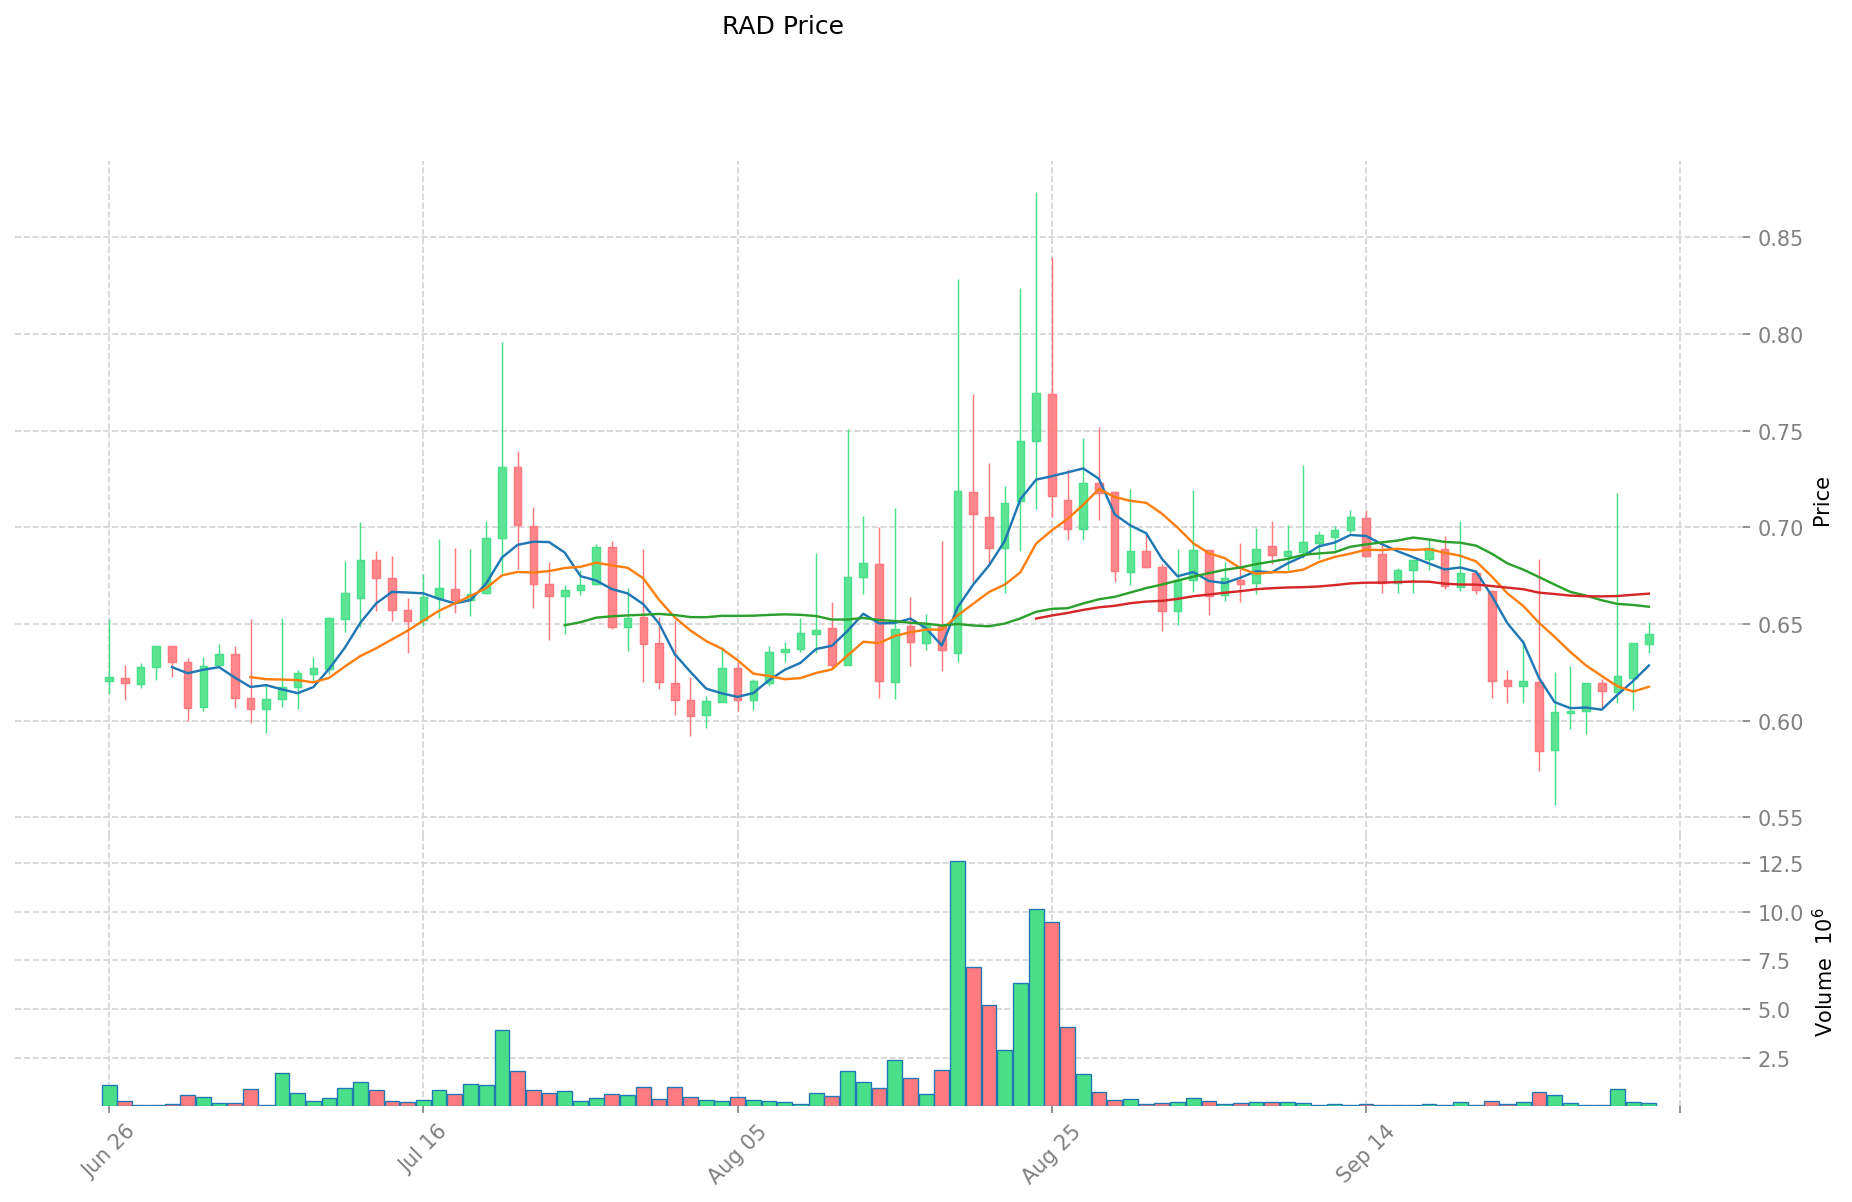
- 2025: Gradual recovery, price fluctuating between $0.56 and $0.65
RAD Current Market Situation
As of October 3, 2025, RAD is trading at $0.6422. The 24-hour trading volume stands at $92,903.50. RAD has seen a slight increase of 0.15% in the past 24 hours. The current market cap is $32,000,254.81, ranking RAD at 889th position in the crypto market.
The circulating supply of RAD is 49,829,110.57 tokens, which is 49.83% of the total supply of 99,998,580 RAD. The fully diluted market cap is $64,220,000.00.
Over the past week, RAD has shown a strong performance with an 8.5% increase. However, the 30-day and 1-year perspectives show declines of 4.56% and 37.36% respectively, indicating longer-term bearish trends.
The current price is significantly below the all-time high of $27.61 set on April 16, 2021, but above the all-time low of $0.565759 recorded on June 23, 2025.
Click to view the current RAD market price
RAD Market Sentiment Indicator
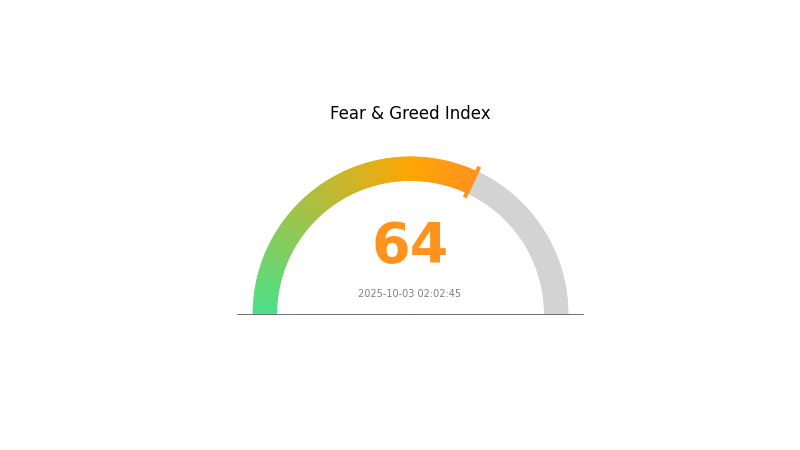
2025-10-03 Fear and Greed Index: 64 (Greed)
Click to view the current Fear & Greed Index
The crypto market is currently experiencing a wave of optimism, with the Fear and Greed Index standing at 64, indicating "Greed". This suggests investors are becoming increasingly confident and bullish. However, it's crucial to remain cautious as extreme greed can often precede market corrections. Traders should consider diversifying their portfolios and setting stop-loss orders to protect gains. As always, thorough research and risk management are essential in navigating these market conditions.
RAD Holdings Distribution
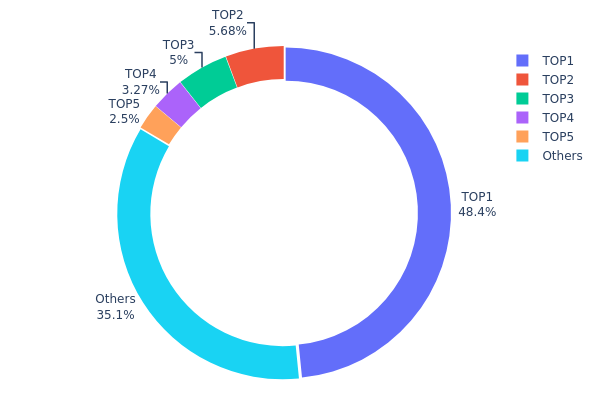
The address holdings distribution data for RAD reveals a highly concentrated ownership structure. The top address holds a substantial 48.42% of the total supply, indicating a significant concentration of tokens in a single wallet. This level of centralization is further emphasized by the fact that the top 5 addresses collectively control 64.86% of RAD tokens.
Such a concentrated distribution raises concerns about market stability and potential price manipulation. With nearly half of the tokens held by a single entity, there's a risk of large-scale sell-offs or buying pressure that could dramatically impact RAD's market price. The high concentration also suggests a lower level of decentralization, which may be at odds with the principles of many blockchain projects.
However, it's worth noting that 35.14% of tokens are distributed among other addresses, indicating some level of broader market participation. This distribution pattern reflects a market structure where a few large holders have significant influence, potentially affecting governance decisions and overall token utility within the RAD ecosystem.
Click to view the current RAD Holdings Distribution
| Top | Address | Holding Qty | Holding (%) |
|---|---|---|---|
| 1 | 0x8da8...6130ba | 48422.60K | 48.42% |
| 2 | 0xf977...41acec | 5678.43K | 5.67% |
| 3 | 0x5a52...70efcb | 5000.00K | 5.00% |
| 4 | 0x2887...cd1992 | 3274.37K | 3.27% |
| 5 | 0xdacf...eb32e7 | 2500.00K | 2.50% |
| - | Others | 35123.19K | 35.14% |
II. Key Factors Influencing RAD's Future Price
Supply Mechanism
- Circulation Supply: When RAD's circulation supply increases, it may create downward pressure on the price due to increased market supply. Conversely, if the circulation supply decreases or remains stable, it could potentially support price stability or growth.
Institutional and Whale Dynamics
- Corporate Adoption: The adoption of RAD by notable enterprises could significantly impact its price and market perception.
Macroeconomic Environment
- Inflation Hedging Properties: RAD's performance in inflationary environments may influence its attractiveness as a potential hedge against inflation.
- Geopolitical Factors: International geopolitical situations can affect RAD's price, as seen in other cryptocurrencies' responses to global events.
Technical Development and Ecosystem Building
- Blockchain Technology Advancements: Ongoing developments in blockchain technology provide a solid foundation for RAD's future growth and potential price appreciation.
- Ecosystem Applications: The development and success of major DApps and ecosystem projects built on or utilizing RAD could drive demand and influence its price.
III. RAD Price Prediction for 2025-2030
2025 Outlook
- Conservative prediction: $0.568 - $0.6382
- Neutral prediction: $0.6382 - $0.7244
- Optimistic prediction: $0.7244 - $0.81051 (requires strong market momentum and increased adoption)
2027-2028 Outlook
- Market stage expectation: Potential growth phase with increasing volatility
- Price range forecast:
- 2027: $0.82751 - $1.15506
- 2028: $0.6152 - $1.19006
- Key catalysts: Technological advancements, wider ecosystem integration, and potential partnerships
2029-2030 Long-term Outlook
- Base scenario: $0.70355 - $1.14326 (assuming steady market growth and adoption)
- Optimistic scenario: $1.14326 - $1.39038 (with accelerated adoption and favorable market conditions)
- Transformative scenario: Above $1.39038 (with groundbreaking developments and mainstream acceptance)
- 2030-12-31: RAD $1.12128 (potential equilibrium price based on average projections)
| 年份 | 预测最高价 | 预测平均价格 | 预测最低价 | 涨跌幅 |
|---|---|---|---|---|
| 2025 | 0.81051 | 0.6382 | 0.568 | 0 |
| 2026 | 0.99961 | 0.72436 | 0.66641 | 12 |
| 2027 | 1.15506 | 0.86198 | 0.82751 | 34 |
| 2028 | 1.19006 | 1.00852 | 0.6152 | 57 |
| 2029 | 1.14326 | 1.09929 | 0.70355 | 71 |
| 2030 | 1.39038 | 1.12128 | 0.60549 | 74 |
IV. Professional RAD Investment Strategies and Risk Management
RAD Investment Methodology
(1) Long-term Holding Strategy
- Suitable for: Long-term value investors
- Operation suggestions:
- Accumulate RAD tokens during market dips
- Hold for at least 1-2 years to ride out market volatility
- Store tokens in a secure hardware wallet
(2) Active Trading Strategy
- Technical analysis tools:
- Moving Averages: Use 50-day and 200-day MAs to identify trends
- RSI: Monitor overbought/oversold conditions
- Key points for swing trading:
- Set clear entry and exit points
- Use stop-loss orders to limit downside risk
RAD Risk Management Framework
(1) Asset Allocation Principles
- Conservative investors: 1-3% of portfolio
- Aggressive investors: 5-10% of portfolio
- Professional investors: Up to 15% of portfolio
(2) Risk Hedging Solutions
- Diversification: Spread investments across multiple cryptocurrencies
- Options strategies: Use put options for downside protection
(3) Secure Storage Solutions
- Hardware wallet recommendation: Gate Web3 Wallet
- Cold storage solution: Paper wallet for long-term holding
- Security precautions: Enable two-factor authentication, use strong passwords
V. Potential Risks and Challenges for RAD
RAD Market Risks
- High volatility: RAD price can experience significant fluctuations
- Limited liquidity: May face challenges in large-scale trading
- Competition: Other decentralized development platforms may emerge
RAD Regulatory Risks
- Uncertain regulatory environment: Potential for stricter crypto regulations
- Cross-border compliance: Challenges in adhering to diverse international laws
- Tax implications: Evolving tax treatment of cryptocurrencies
RAD Technical Risks
- Smart contract vulnerabilities: Potential for exploits or bugs
- Scalability challenges: May face issues as the network grows
- Adoption hurdles: Competing with established centralized platforms
VI. Conclusion and Action Recommendations
RAD Investment Value Assessment
RAD presents a unique value proposition in the decentralized software development space but faces significant short-term volatility and adoption challenges.
RAD Investment Recommendations
✅ Beginners: Allocate a small portion (1-2%) of portfolio, focus on learning
✅ Experienced investors: Consider 3-5% allocation, implement dollar-cost averaging
✅ Institutional investors: Explore strategic partnerships and larger positions (5-15%)
RAD Trading Participation Methods
- Spot trading: Buy and hold RAD tokens on Gate.com
- Staking: Participate in RAD staking programs for passive income
- Governance: Engage in Radicle's decentralized governance process
Cryptocurrency investments carry extremely high risks, and this article does not constitute investment advice. Investors should make decisions carefully based on their own risk tolerance and are advised to consult professional financial advisors. Never invest more than you can afford to lose.
FAQ
What is the price prediction for rad in 2025?
Based on current forecasts, RAD is predicted to reach an average price of $0.791846 by 2025. The sentiment is neutral, with mixed technical signals.
What is the price prediction for rad crypto in 2030?
Based on crypto analysts' forecasts, RAD price is expected to reach between $3.28 and $3.97 in 2030, with an average price around $3.62.
What is the XRP price prediction in 2025?
Based on current analysis, XRP price is predicted to decrease by about 5.67% by October 3, 2025, indicating a bearish trend for that period.
What is the price prediction for ripple in 2030?
Based on current trends, Ripple (XRP) could reach $5-$10 by 2030, driven by increased adoption and partnerships in the financial sector.
Share
Content
Introduction: RAD's Market Position and Investment Value
I. RAD Price History Review and Current Market Status
II. Key Factors Influencing RAD's Future Price
III. RAD Price Prediction for 2025-2030
IV. Professional RAD Investment Strategies and Risk Management
V. Potential Risks and Challenges for RAD
VI. Conclusion and Action Recommendations
FAQ

