2025 TTPrice Prediction: Analyzing Market Trends and Future Value Potential of TT Token
Introduction: TT's Market Position and Investment Value
ThunderCore (TT) has established itself as a high-performance, EVM-compatible public blockchain since its inception. As of 2025, ThunderCore's market capitalization has reached $27,927,652, with a circulating supply of approximately 12,705,938,366 tokens, and a price hovering around $0.002198. This asset, known for its "high-speed and low-cost" features, is playing an increasingly crucial role in decentralized applications and smart contract deployment.
This article will comprehensively analyze ThunderCore's price trends from 2025 to 2030, combining historical patterns, market supply and demand, ecosystem development, and macroeconomic conditions to provide investors with professional price predictions and practical investment strategies.
I. TT Price History Review and Current Market Status
TT Historical Price Evolution
- 2019: ThunderCore mainnet launched on March 11, price reached all-time high of $0.052424 on May 9
- 2021: Cryptocurrency bull market, TT price experienced significant volatility
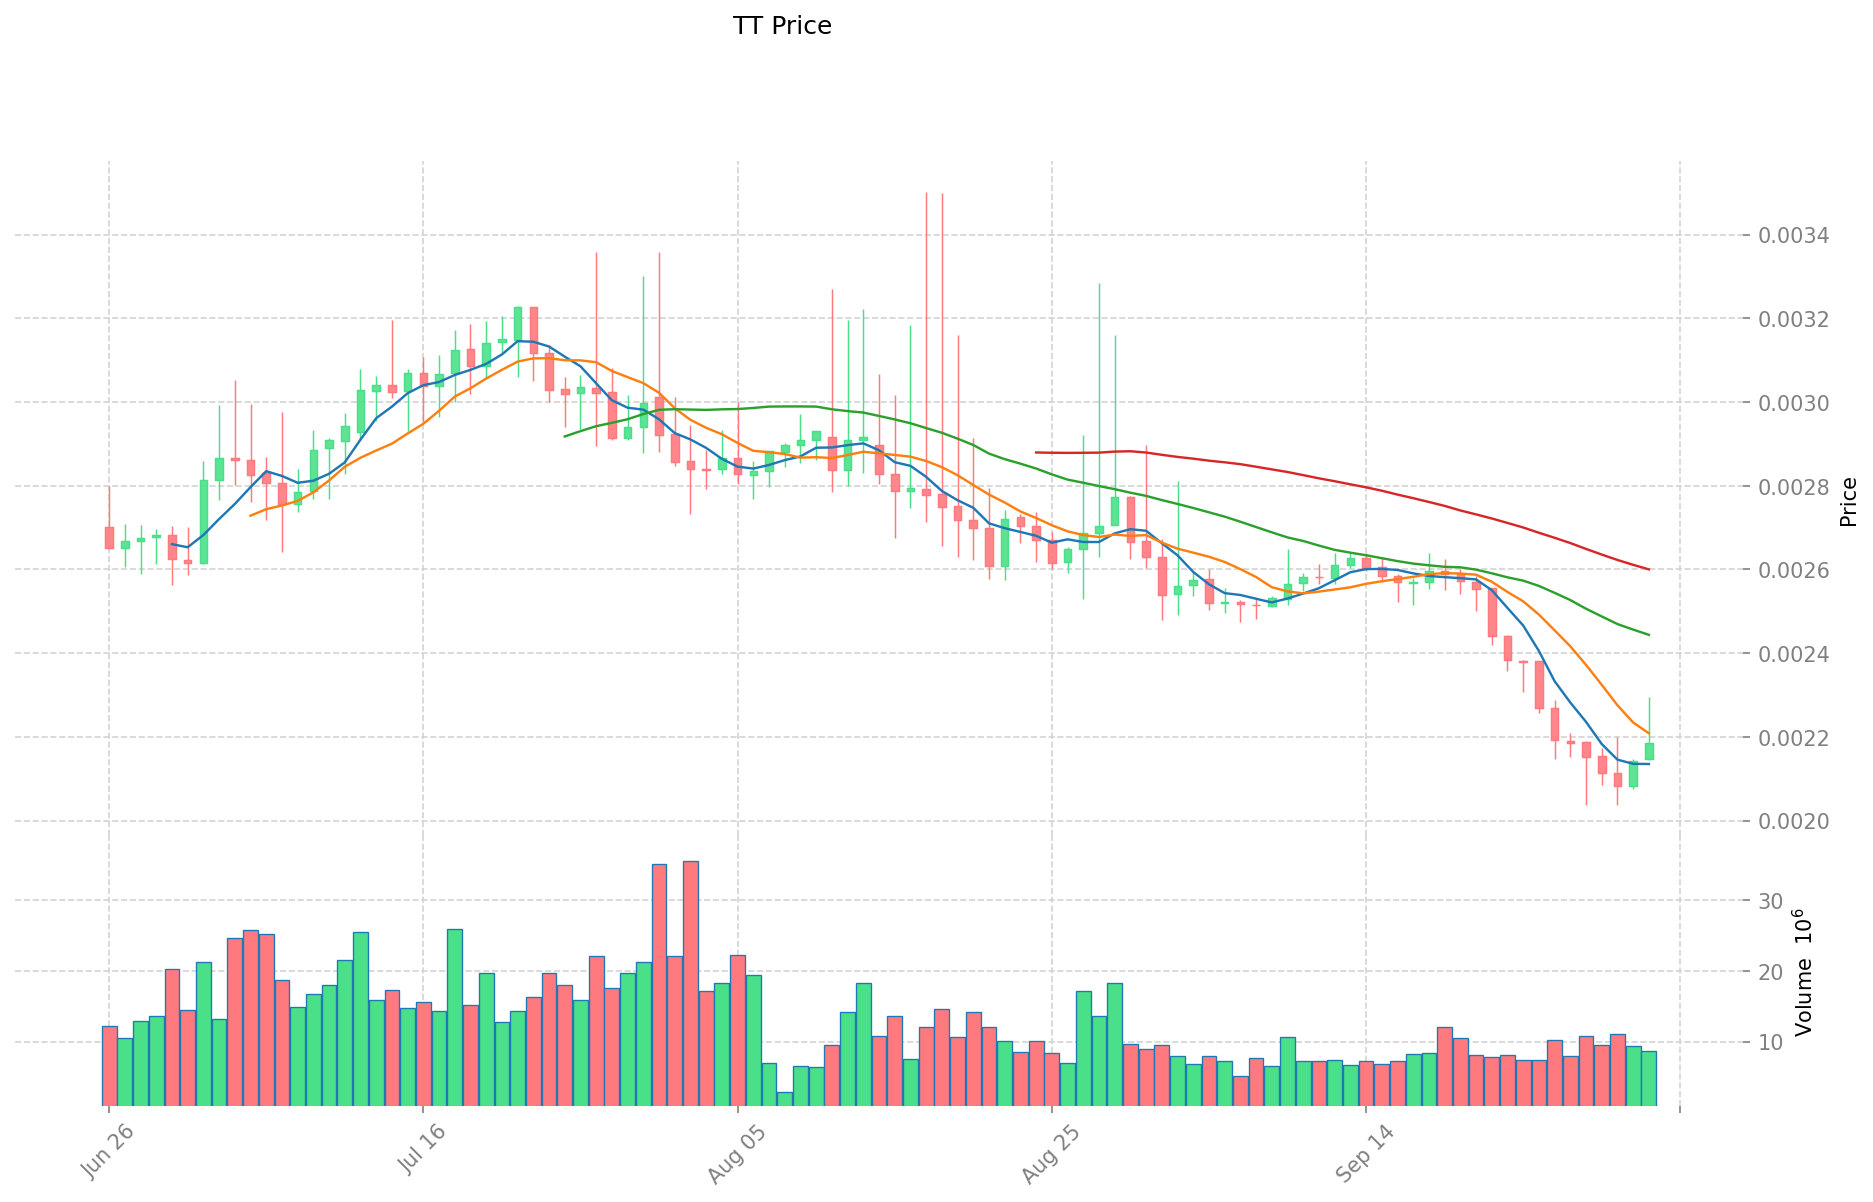
- 2025: Market cycle downturn, price dropped from previous highs to current level of $0.002198
TT Current Market Situation
As of October 3, 2025, TT is trading at $0.002198, with a 24-hour trading volume of $19,215.06. The token has seen a 1.71% increase in the last 24 hours. TT's market capitalization stands at $27,927,652, ranking it 949th in the cryptocurrency market. The circulating supply is 12,705,938,366 TT, which is also the total supply. TT is currently 95.81% below its all-time high of $0.052424, set on May 9, 2019. The token has experienced a significant decline over the past year, with a 32.32% decrease in value. However, it shows some signs of short-term recovery with a 1.71% increase in the last 24 hours and a 0.81% increase in the last hour.
Click to view the current TT market price
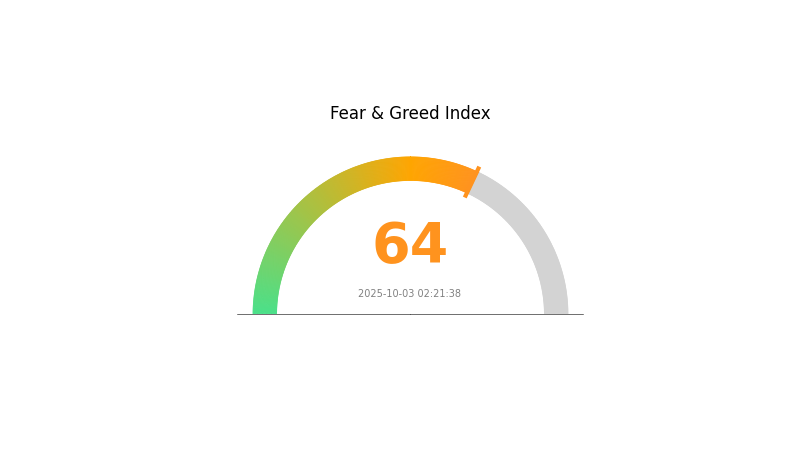
TT Market Sentiment Indicator
2025-10-03 Fear and Greed Index: 64 (Greed)
Click to view the current Fear & Greed Index
The crypto market is showing signs of greed, with the Fear and Greed Index at 64. This suggests investors are becoming overly optimistic, potentially driving prices higher. While bullish sentiment can fuel rallies, it's crucial to remain cautious. Experienced traders often view extreme greed as a contrarian indicator, signaling a possible market correction. Consider diversifying your portfolio and setting stop-loss orders to protect gains. As always, conduct thorough research and manage risk wisely in this volatile market environment.
TT Holdings Distribution
The address holdings distribution data for TT reveals a highly decentralized ownership structure. With no single address holding a significant percentage of the total supply, the risk of market manipulation or excessive concentration appears to be minimal. This distribution pattern suggests a healthy level of decentralization, which is generally considered positive for the overall stability and fairness of the token's ecosystem.
The absence of large individual holders reduces the potential for sudden price swings caused by the actions of a few major players. This balanced distribution may contribute to more organic price discovery and could potentially lead to lower volatility in the long term. Furthermore, the diverse ownership structure aligns well with the principles of decentralization often sought in blockchain projects, potentially enhancing TT's appeal to a broad base of users and investors.
Overall, the current address distribution of TT reflects a robust market structure with a high degree of decentralization. This characteristic may be interpreted as a positive indicator for the token's long-term stability and resistance to centralized control or manipulation.
Click to view the current TT Holdings Distribution

| Top | Address | Holding Qty | Holding (%) |
|---|
II. Key Factors Affecting TT's Future Price
Macroeconomic Environment
-
Impact of Monetary Policy: Major central banks' policy expectations are likely to influence TT's price. Interest rate and tariff policies are expected to have significant effects on financial markets, including cryptocurrencies, from Q4 2024 onwards.
-
Inflation Hedging Properties: As an asset, TT may be evaluated for its performance in inflationary environments. Economic activity variables such as industrial value added, investment, retail sales, and trade could impact its value as a potential hedge against inflation.
-
Geopolitical Factors: International political situations and policy changes, particularly those related to the U.S. economy and global trade, may affect TT's price movement.
Technical Development and Ecosystem Building
-
Market Dynamics: TT's price behavior may be influenced by factors such as order aggressiveness in limit order book markets and price dynamics specific to cryptocurrency exchanges like Gate.com.
-
Ecosystem Applications: While specific DApps or ecosystem projects for TT are not mentioned, the development of its ecosystem and adoption of blockchain technology in various sectors could impact its future value.
III. TT Price Prediction for 2025-2030
2025 Outlook
- Conservative forecast: $0.0015 - $0.0020
- Neutral forecast: $0.0020 - $0.0025
- Optimistic forecast: $0.0025 - $0.00302 (requires positive market sentiment and project developments)
2027-2028 Outlook
- Market phase expectation: Potential growth phase with increasing adoption
- Price range forecast:
- 2027: $0.00286 - $0.00428
- 2028: $0.00275 - $0.00388
- Key catalysts: Technological advancements, increased utility, and broader market trends
2029-2030 Long-term Outlook
- Base scenario: $0.00377 - $0.00437 (assuming steady market growth and project development)
- Optimistic scenario: $0.00498 - $0.00626 (assuming strong market performance and significant project milestones)
- Transformative scenario: $0.00626+ (under extremely favorable market conditions and breakthrough innovations)
- 2030-12-31: TT $0.00437 (potential average price based on projected growth)
| 年份 | 预测最高价 | 预测平均价格 | 预测最低价 | 涨跌幅 |
|---|---|---|---|---|
| 2025 | 0.00302 | 0.0022 | 0.0015 | 0 |
| 2026 | 0.00347 | 0.00261 | 0.00183 | 18 |
| 2027 | 0.00428 | 0.00304 | 0.00286 | 38 |
| 2028 | 0.00388 | 0.00366 | 0.00275 | 66 |
| 2029 | 0.00498 | 0.00377 | 0.00272 | 71 |
| 2030 | 0.00626 | 0.00437 | 0.00346 | 99 |
IV. Professional Investment Strategies and Risk Management for TT
TT Investment Methodology
(1) Long-term Holding Strategy
- Suitable for: Long-term investors with high risk tolerance
- Operation suggestions:
- Accumulate TT during market dips
- Set price targets for partial profit-taking
- Store TT in a secure hardware wallet
(2) Active Trading Strategy
- Technical analysis tools:
- Moving Averages: Use to identify trends and potential entry/exit points
- Relative Strength Index (RSI): Helps determine overbought/oversold conditions
- Key points for swing trading:
- Monitor trading volume for confirmation of price movements
- Use stop-loss orders to manage downside risk
TT Risk Management Framework
(1) Asset Allocation Principles
- Conservative investors: 1-3% of crypto portfolio
- Aggressive investors: 5-10% of crypto portfolio
- Professional investors: Up to 15% of crypto portfolio
(2) Risk Hedging Solutions
- Diversification: Spread investments across multiple cryptocurrencies
- Stop-loss orders: Implement to limit potential losses
(3) Secure Storage Solutions
- Hot wallet recommendation: Gate Web3 Wallet
- Cold storage solution: Hardware wallet for long-term holdings
- Security precautions: Enable two-factor authentication, use strong passwords
V. Potential Risks and Challenges for TT
TT Market Risks
- Price volatility: TT may experience significant price fluctuations
- Liquidity risk: Limited trading volume may impact ability to enter/exit positions
- Competition: Other blockchain platforms may outperform ThunderCore
TT Regulatory Risks
- Uncertain regulatory environment: Potential for unfavorable regulations
- Compliance challenges: Adapting to evolving regulatory requirements
- Cross-border restrictions: Limitations on TT usage in certain jurisdictions
TT Technical Risks
- Smart contract vulnerabilities: Potential for exploits or bugs in the protocol
- Network congestion: Possible performance issues during high-traffic periods
- Scalability challenges: Future growth may strain network capacity
VI. Conclusion and Action Recommendations
TT Investment Value Assessment
ThunderCore (TT) offers potential long-term value as a high-performance blockchain platform, but faces significant short-term risks due to market volatility and competition in the blockchain space.
TT Investment Recommendations
✅ Beginners: Consider small, exploratory investments to understand the ThunderCore ecosystem ✅ Experienced investors: Implement a dollar-cost averaging strategy with strict risk management ✅ Institutional investors: Conduct thorough due diligence and consider TT as part of a diversified crypto portfolio
TT Trading Participation Methods
- Spot trading: Buy and sell TT on Gate.com's spot market
- Staking: Participate in TT staking programs for potential passive income
- DApp interaction: Engage with ThunderCore's decentralized applications to gain practical experience with the ecosystem
Cryptocurrency investments carry extremely high risks, and this article does not constitute investment advice. Investors should make decisions carefully based on their own risk tolerance and are advised to consult professional financial advisors. Never invest more than you can afford to lose.
FAQ
Is Trane Technologies a good buy?
Yes, Trane Technologies looks promising. Strong financials, innovative products, and focus on sustainability make it a solid long-term investment choice.
What is the price prediction for TT stock?
Analysts predict TT stock may reach $250-$300 by 2026, based on strong HVAC demand and sustainability trends. However, market conditions can affect this forecast.
What is Tenaya Therapeutics stock price forecast for 2025?
Based on current trends, Tenaya Therapeutics stock is forecasted to be priced between $1.11 and $1.15 in 2025.
What is AT&T target price?
AT&T's average target price is $31.49, with forecasts ranging from $28.00 to $33.00, representing a potential 12.18% change.
Share
Content
Introduction: TT's Market Position and Investment Value
I. TT Price History Review and Current Market Status
II. Key Factors Affecting TT's Future Price
III. TT Price Prediction for 2025-2030
IV. Professional Investment Strategies and Risk Management for TT
V. Potential Risks and Challenges for TT
VI. Conclusion and Action Recommendations
FAQ

