2025 XAN Price Prediction: Navigating the Future of Cryptocurrency in a Volatile Market
Introduction: XAN's Market Position and Investment Value
Anoma (XAN), as a decentralized operating system powering a unified app layer for Web3, has made significant strides since its inception. As of 2025, Anoma's market capitalization has reached $65,550,000, with a circulating supply of approximately 2,500,000,000 tokens, and a price hovering around $0.02622. This asset, dubbed the "Web3 unifier," is playing an increasingly crucial role in app development and cross-chain operability.
This article will comprehensively analyze Anoma's price trends from 2025 to 2030, taking into account historical patterns, market supply and demand, ecosystem development, and the macroeconomic environment, to provide investors with professional price predictions and practical investment strategies.
I. XAN Price History Review and Current Market Status
XAN Historical Price Evolution
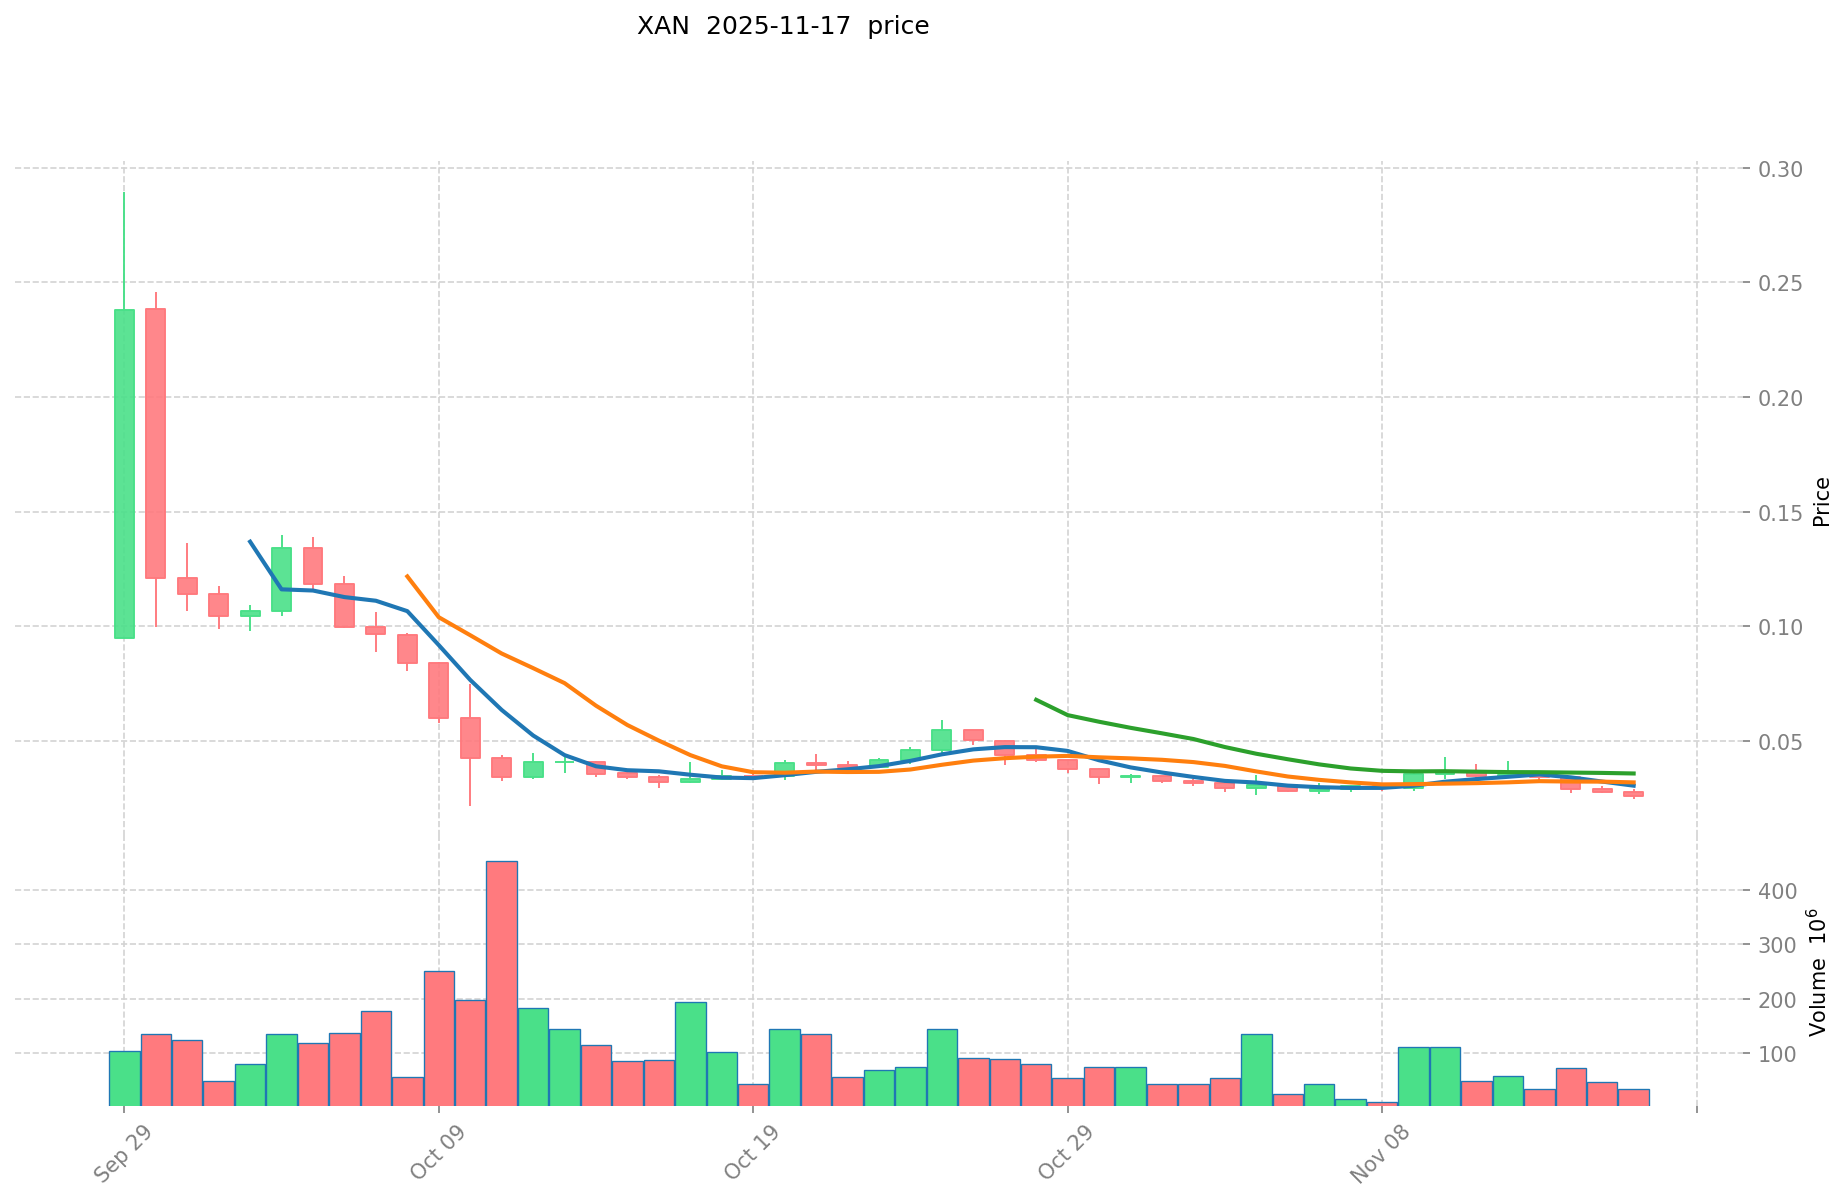
- 2025 September: XAN reached its all-time high of $0.28948
- 2025 October: XAN hit its all-time low of $0.02194
- 2025 November: XAN experienced significant volatility, with price fluctuations between $0.02475 and $0.02916 in the past 24 hours
XAN Current Market Situation
As of November 17, 2025, XAN is trading at $0.02622, with a 24-hour trading volume of $972,403. The token has seen a 5.58% decrease in the last 24 hours. XAN's market capitalization stands at $65,550,000, ranking it 473rd in the cryptocurrency market. The circulating supply is 2,500,000,000 XAN, which represents 25% of the total supply of 10,000,000,000 XAN. The token's price has experienced significant downward pressure, with a 25.36% decrease over the past week and a 24.77% decline in the last 30 days. The current price is 90.94% below its all-time high, indicating a bearish trend in the short to medium term.
Click to view the current XAN market price
XAN Market Sentiment Indicator
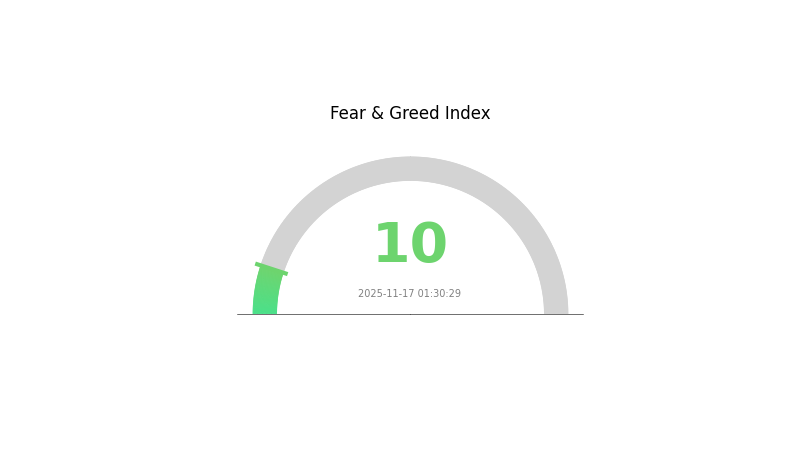
2025-11-17 Fear and Greed Index: 10 (Extreme Fear)
Click to view the current Fear & Greed Index
The crypto market is gripped by extreme fear, with the Fear and Greed Index plummeting to 10. This level of pessimism often signals a potential buying opportunity for contrarian investors. However, caution is advised as market sentiment can remain bearish for extended periods. Traders should consider dollar-cost averaging and thorough research before making investment decisions. Remember, market cycles are natural, and this extreme fear phase may precede a future recovery.
XAN Holdings Distribution
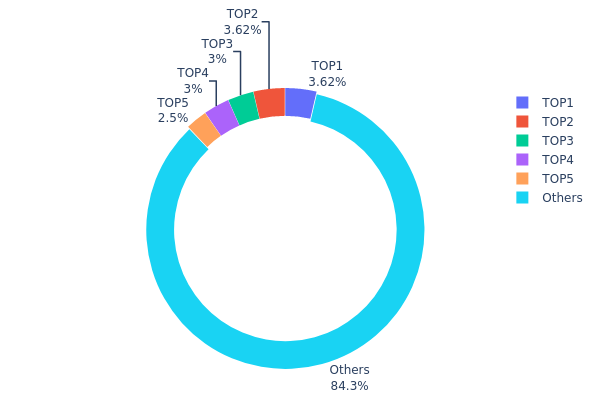
The address holdings distribution data provides insights into the concentration of XAN tokens among different wallet addresses. Analysis of this data reveals a relatively decentralized distribution pattern for XAN. The top 5 addresses collectively hold 15.74% of the total supply, with each holding between 2.50% to 3.62%. This indicates a moderate level of concentration at the top, but not to an extent that raises immediate concerns about excessive centralization.
The majority of XAN tokens (84.26%) are distributed among numerous other addresses, suggesting a broad base of holders. This distribution pattern is generally favorable for market stability and resistance to price manipulation. It reduces the risk of large-scale sell-offs by individual whales that could dramatically impact the token's value. However, it's worth noting that the top two addresses hold identical amounts, which may warrant further investigation to understand if they are related entities or part of a specific allocation strategy.
Overall, the current XAN holdings distribution reflects a relatively healthy balance between larger stakeholders and a diverse holder base, potentially contributing to a more robust and decentralized ecosystem.
Click to view the current XAN Holdings Distribution
| Top | Address | Holding Qty | Holding (%) |
|---|---|---|---|
| 1 | 0xd9a3...9ab6a8 | 362480.73K | 3.62% |
| 2 | 0xd0a9...458c7d | 362480.73K | 3.62% |
| 3 | 0x5df7...b10186 | 300000.00K | 3.00% |
| 4 | 0x8f82...7a6b91 | 300000.00K | 3.00% |
| 5 | 0xdcc0...32764d | 250000.00K | 2.50% |
| - | Others | 8425038.54K | 84.26% |
II. Key Factors Affecting XAN's Future Price
Supply Mechanism
- Deflationary Model: XAN implements a token burn mechanism to reduce overall supply over time.
- Historical Pattern: Previous token burns have generally led to short-term price increases.
- Current Impact: The ongoing burn rate is expected to create upward pressure on XAN's price, assuming demand remains stable or increases.
Macroeconomic Environment
- Inflation Hedging Properties: As a cryptocurrency, XAN may be viewed as a potential hedge against inflation, similar to other digital assets.
- Geopolitical Factors: Global economic uncertainties and geopolitical tensions could drive increased interest in cryptocurrencies like XAN as alternative investments.
Technical Development and Ecosystem Building
- Network Upgrades: Planned improvements to the XAN network aim to enhance transaction speed and scalability.
- Ecosystem Applications: The development of decentralized applications (DApps) on the XAN network is expanding its utility and potentially driving demand.
III. XAN Price Prediction for 2025-2030
2025 Outlook
- Conservative prediction: $0.02377 - $0.02612
- Neutral prediction: $0.02612 - $0.02834
- Optimistic prediction: $0.02834 - $0.03056 (requires favorable market conditions)
2027-2028 Outlook
- Market phase expectation: Potential growth phase
- Price range forecast:
- 2027: $0.02915 - $0.04972
- 2028: $0.03361 - $0.05083
- Key catalysts: Increasing adoption and technological advancements
2030 Long-term Outlook
- Base scenario: $0.04920 - $0.05199 (assuming steady market growth)
- Optimistic scenario: $0.05199 - $0.06396 (assuming strong market performance)
- Transformative scenario: Above $0.06396 (extreme favorable conditions)
- 2030-12-31: XAN $0.06396 (potential peak price)
| 年份 | 预测最高价 | 预测平均价格 | 预测最低价 | 涨跌幅 |
|---|---|---|---|---|
| 2025 | 0.03056 | 0.02612 | 0.02377 | 0 |
| 2026 | 0.04024 | 0.02834 | 0.01899 | 8 |
| 2027 | 0.04972 | 0.03429 | 0.02915 | 30 |
| 2028 | 0.05083 | 0.04201 | 0.03361 | 60 |
| 2029 | 0.05199 | 0.04642 | 0.02878 | 77 |
| 2030 | 0.06396 | 0.0492 | 0.04527 | 87 |
IV. XAN Professional Investment Strategies and Risk Management
XAN Investment Methodology
(1) Long-term Holding Strategy
- Suitable for: Long-term investors with high risk tolerance
- Operation suggestions:
- Accumulate XAN during market dips
- Set a target holding period of at least 2-3 years
- Store XAN in a secure hardware wallet
(2) Active Trading Strategy
- Technical analysis tools:
- Moving Averages: Use to identify trends and potential entry/exit points
- Relative Strength Index (RSI): Monitor overbought/oversold conditions
- Key points for swing trading:
- Set clear stop-loss and take-profit levels
- Monitor XAN's correlation with broader crypto market trends
XAN Risk Management Framework
(1) Asset Allocation Principles
- Conservative investors: 1-3% of crypto portfolio
- Aggressive investors: 5-10% of crypto portfolio
- Professional investors: Up to 15% of crypto portfolio
(2) Risk Hedging Solutions
- Diversification: Spread investments across multiple crypto assets
- Stop-loss orders: Implement to limit potential losses
(3) Secure Storage Solutions
- Hot wallet recommendation: Gate Web3 Wallet
- Cold storage solution: Use hardware wallets for long-term holdings
- Security precautions: Enable two-factor authentication, use strong passwords
V. XAN Potential Risks and Challenges
XAN Market Risks
- High volatility: XAN price may experience significant fluctuations
- Liquidity risk: Limited trading volume may impact entry/exit positions
- Market sentiment: XAN performance may be affected by overall crypto market trends
XAN Regulatory Risks
- Uncertain regulatory landscape: Potential for new regulations affecting XAN
- Compliance challenges: XAN may face scrutiny from financial authorities
- Cross-border restrictions: Varying regulations across jurisdictions may impact XAN's adoption
XAN Technical Risks
- Smart contract vulnerabilities: Potential for exploits in the underlying code
- Scalability challenges: XAN may face issues with network congestion as adoption grows
- Interoperability concerns: Challenges in integrating with other blockchain networks
VI. Conclusion and Action Recommendations
XAN Investment Value Assessment
XAN presents a high-risk, high-potential investment opportunity within the emerging Web3 ecosystem. While its innovative approach to decentralized operating systems offers long-term value, short-term price volatility and regulatory uncertainties pose significant risks.
XAN Investment Recommendations
✅ Beginners: Consider small, experimental positions with funds you can afford to lose ✅ Experienced investors: Implement dollar-cost averaging strategy with strict risk management ✅ Institutional investors: Conduct thorough due diligence and consider XAN as part of a diversified crypto portfolio
XAN Trading Participation Methods
- Spot trading: Buy and hold XAN on reputable exchanges like Gate.com
- Staking: Participate in XAN staking programs if available
- DeFi integration: Explore decentralized finance opportunities involving XAN tokens
Cryptocurrency investments carry extremely high risks, and this article does not constitute investment advice. Investors should make decisions carefully based on their own risk tolerance and are advised to consult professional financial advisors. Never invest more than you can afford to lose.
FAQ
What will Cardano be worth in 2025?
Based on market trends and expert predictions, Cardano (ADA) could potentially reach $5 to $7 by 2025, driven by increased adoption and technological advancements in its ecosystem.
Will Solana reach $1000 this year?
It's unlikely for Solana to reach $1000 this year. While Solana has shown strong growth, a 1000% increase from current levels is extremely ambitious in such a short timeframe.
What crypto has the highest price prediction?
Bitcoin (BTC) is often predicted to have the highest future price among cryptocurrencies, with some analysts forecasting it could reach $500,000 or more by 2030.
Does Ankr have a future?
Yes, Ankr has a promising future in Web3 infrastructure. Its innovative staking solutions and decentralized cloud computing platform position it well for growth in the evolving blockchain ecosystem.
Share
Content
Introduction: XAN's Market Position and Investment Value
I. XAN Price History Review and Current Market Status
II. Key Factors Affecting XAN's Future Price
III. XAN Price Prediction for 2025-2030
IV. XAN Professional Investment Strategies and Risk Management
V. XAN Potential Risks and Challenges
VI. Conclusion and Action Recommendations
FAQ

