ACT vs SOL: A Comparative Analysis of Two Educational Assessment Systems
Introduction: ACT vs SOL Investment Comparison
In the cryptocurrency market, ACT vs SOL comparison has always been an unavoidable topic for investors. The two not only have significant differences in market cap ranking, application scenarios, and price performance, but also represent different cryptocurrency positions.
Act I: The AI Prophecy (ACT): Since its launch, it has gained market recognition for exploring how to engage with AI beyond the traditional user/assistant paradigm.
Solana (SOL): Since its inception in 2017, it has been hailed as a high-performance blockchain protocol, and is one of the cryptocurrencies with the highest global trading volume and market capitalization.
This article will comprehensively analyze the investment value comparison between ACT and SOL, focusing on historical price trends, supply mechanisms, institutional adoption, technical ecosystems, and future predictions, and attempt to answer the question that investors care about most:
"Which is the better buy right now?"
I. Price History Comparison and Current Market Status
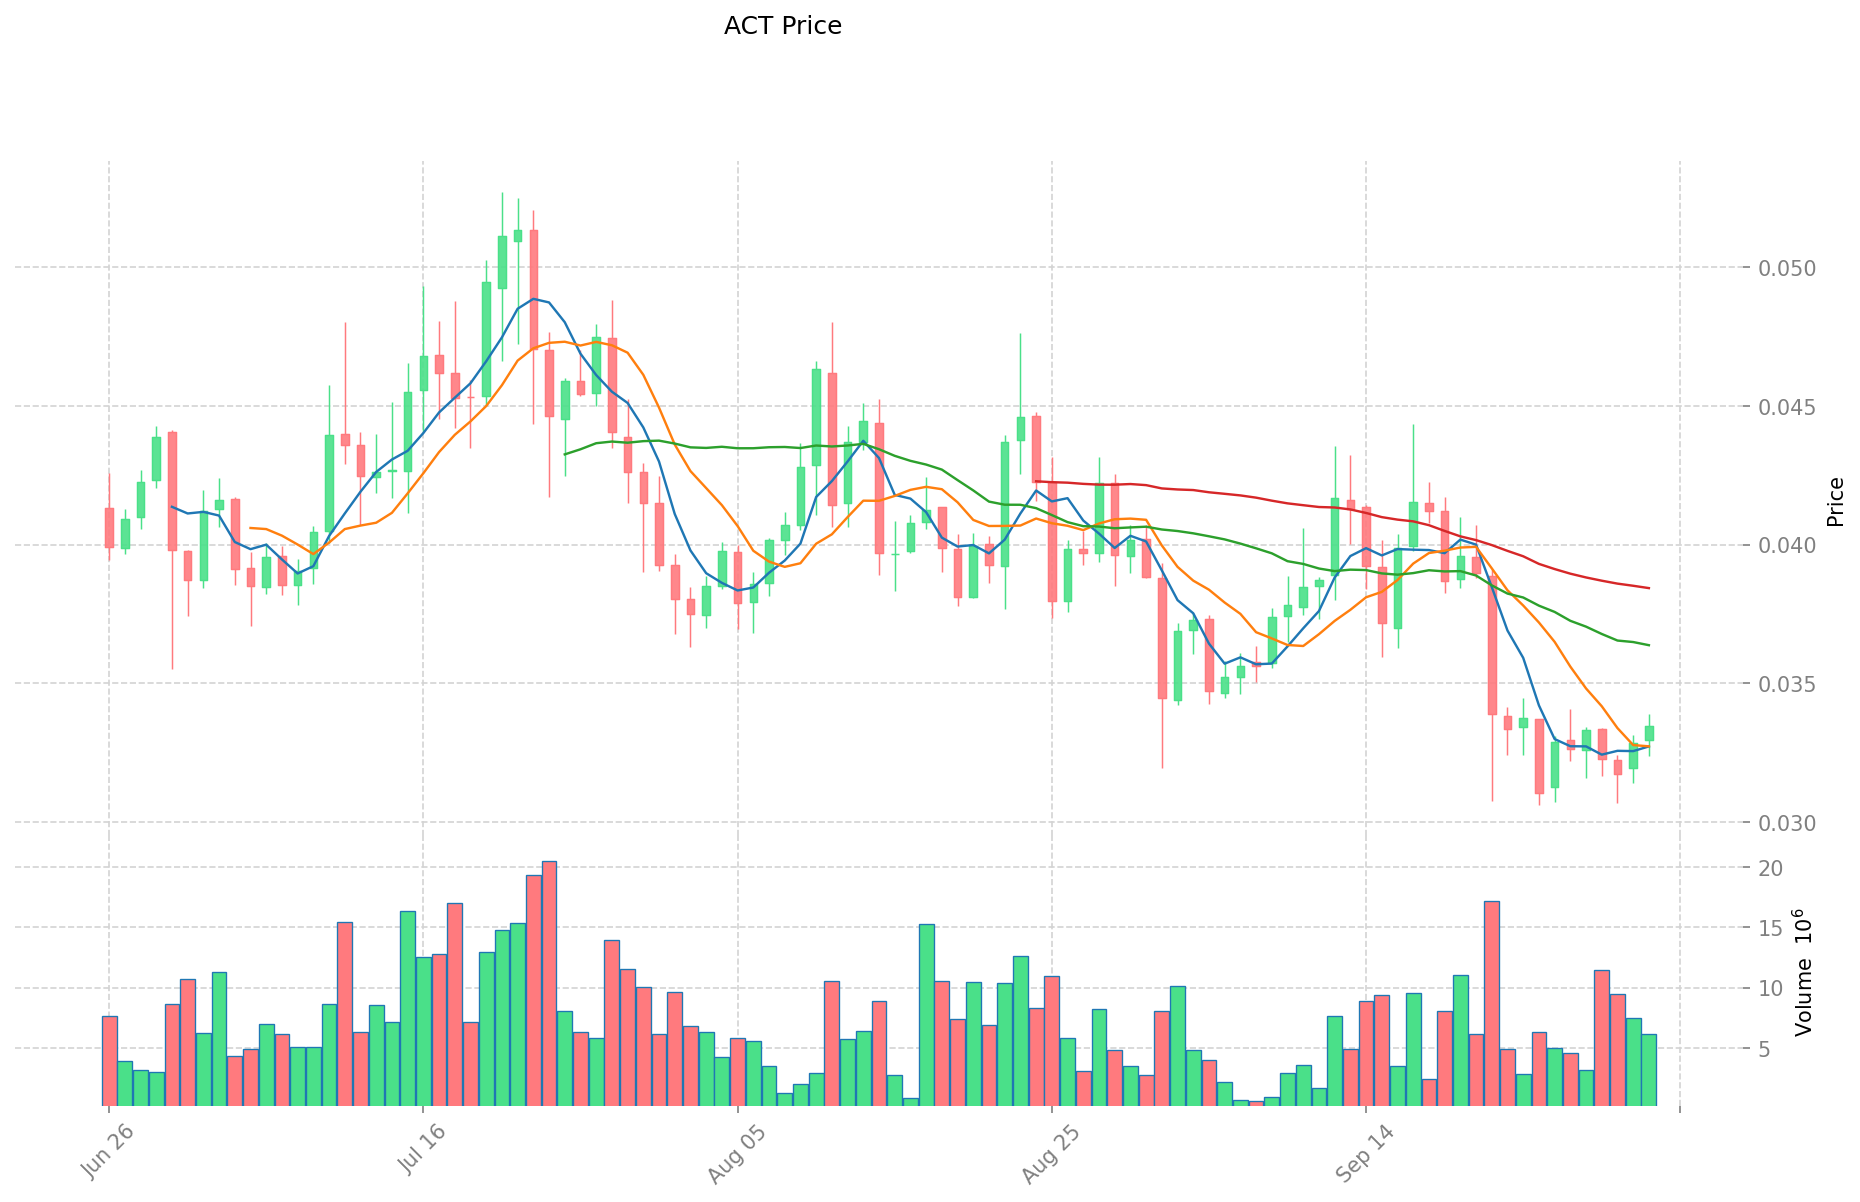
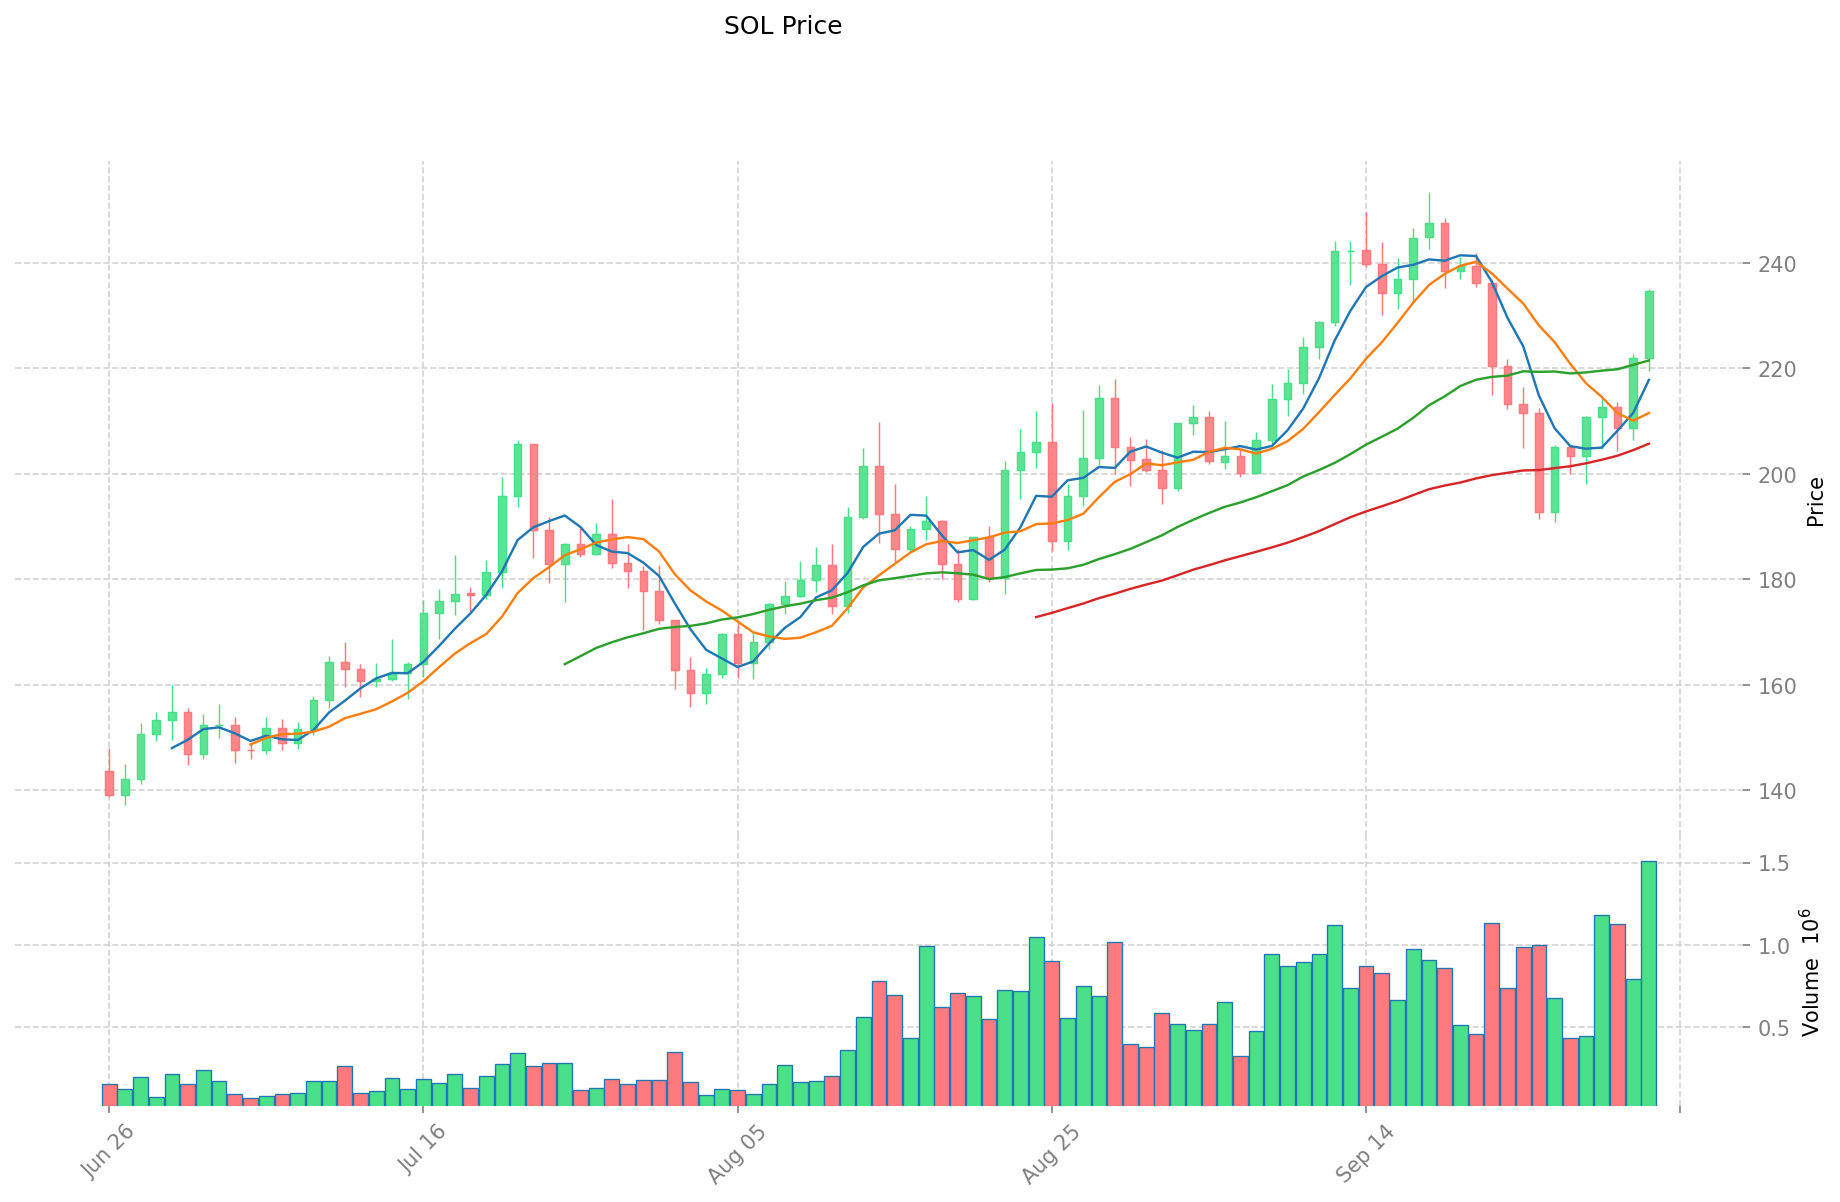
ACT and SOL Historical Price Trends
- 2024: ACT reached its all-time high of $0.95 on November 14, 2024.
- 2025: SOL hit its historical peak of $293.31 on January 19, 2025.
- Comparative analysis: In the recent market cycle, ACT dropped from its high of $0.95 to a low of $0.0177, while SOL showed more resilience, maintaining a higher price level.
Current Market Situation (2025-10-03)
- ACT current price: $0.03305
- SOL current price: $231.04
- 24-hour trading volume: ACT $223,743.72 vs SOL $254,321,370.79
- Market Sentiment Index (Fear & Greed Index): 64 (Greed)
Click to view real-time prices:
- Check ACT current price Market Price
- Check SOL current price Market Price
II. Project Fundamentals Comparison
ACT (Act I: The AI Prophecy)
- Project Overview: ACT is one of the few projects exploring how to engage with AI beyond a cold and damp 1-on-1 user/assistant paradigm, but as a network of equals.
- Key Features:
- Focuses on AI interaction and networking
- Aims to create a more equitable AI ecosystem
- Team Background: Limited information available on the founding team.
- Development Progress: Specific milestones and roadmap details not provided in the given context.
SOL (Solana)
- Project Overview: Solana is a high-performance blockchain protocol designed to enable scalable, user-friendly apps for the world.
- Key Features:
- High throughput: Capable of processing 50,000 transactions per second
- Low transaction costs
- Fast block times
- Proof of History (PoH) consensus mechanism
- Team Background: Founded by former engineers from Qualcomm, Intel, and Dropbox at the end of 2017.
- Development Progress:
- Launched in 2020
- Continuous development and ecosystem growth
- Widely adopted in DeFi and NFT sectors
Comparative Analysis
- Technology: Solana has a more established and proven technology stack, while ACT's technological details are less clear from the available information.
- Market Position: Solana ranks 6th in market capitalization, whereas ACT is at 904th, indicating a significant difference in market recognition and adoption.
- Use Case: Solana focuses on providing a scalable blockchain infrastructure, while ACT aims to innovate in AI interactions.
- Community and Ecosystem: Solana has a larger and more active ecosystem with numerous DApps and projects built on its platform. ACT's ecosystem size and activity are not clearly defined in the given information.
III. Investment Considerations
Potential Opportunities
- ACT:
- Innovative approach to AI interactions could attract attention in the growing AI market
- Lower market cap suggests potential for higher percentage gains if successful
- SOL:
- Established platform with proven technology and wide adoption
- Continued growth in DeFi and NFT sectors could drive further demand
Potential Risks
- ACT:
- Limited information on development progress and team
- Lower liquidity and trading volume compared to major cryptocurrencies
- Higher volatility due to smaller market cap
- SOL:
- Competition from other high-performance blockchains
- Potential technical issues or network outages could impact reputation
Key Factors to Monitor
- ACT:
- Project development updates and milestones
- Partnerships or collaborations in the AI sector
- Changes in trading volume and liquidity
- SOL:
- Network performance and stability
- Adoption rates for new projects and DApps
- Regulatory developments affecting blockchain platforms
IV. Conclusion
Both ACT and SOL present unique investment propositions in the cryptocurrency market. SOL offers a more established and widely adopted platform with a proven track record, making it potentially suitable for investors seeking exposure to a major player in the blockchain space. ACT, while more speculative, could appeal to those interested in the intersection of blockchain and AI technologies.
Investors should conduct thorough research, consider their risk tolerance, and potentially consult with financial advisors before making investment decisions. The cryptocurrency market is highly volatile and subject to rapid changes, requiring careful consideration and ongoing monitoring of investments.
II. Core Factors Affecting Investment Value of ACT vs SOL
Supply Mechanism Comparison (Tokenomics)
- ACT: Market capitalization of 20-30 million USD with a growing holder base
- SOL: Inflationary model with staking rewards (6-8% annual yield) that can be reduced through governance
- 📌 Historical Pattern: SOL faces dilution pressure from inflation, while ACT benefits from increasing holder base and community growth
Institutional Adoption and Market Applications
- Institutional Holdings: SOL has stronger institutional backing with ETF products like REX-Osprey Solana + Staking ETF (SSK)
- Enterprise Adoption: SOL leads with DeFi applications, liquid staking protocols (Marinade, Jito) and DePIN (Decentralized Physical Infrastructure Networks)
- Regulatory Attitudes: SOL positioned as potentially the third crypto asset to receive ETF approval after Bitcoin and Ethereum
Technical Development and Ecosystem Building
- ACT Growth: Driven by exchange listings (like Bitget) and strong community activity
- SOL Development: Recovery after FTX collapse with growing TVL in SOL terms and strong DEX trading volumes
- Ecosystem Comparison: SOL has a robust ecosystem including NFT marketplaces (Magic Eden, Tensor), DeFi protocols, and meme coins, while ACT is emerging with AI trading strategies and decentralized governance
Macroeconomic and Market Cycles
- Inflation Performance: SOL holders benefit from staking rewards to offset inflation
- Monetary Policy Impact: SOL faces selling pressure from token unlocks (e.g., 1.79 million SOL worth over $200M unlocked in April)
- Cross-border Transaction Demand: SOL's high throughput supports large communities and maintains speed during peak demand III. 2025-2030 Price Prediction: ACT vs SOL
Short-term Prediction (2025)
- ACT: Conservative $0.028466 - $0.0331 | Optimistic $0.0331 - $0.046009
- SOL: Conservative $152.1432 - $230.52 | Optimistic $230.52 - $322.728
Mid-term Prediction (2027)
- ACT may enter a growth phase, with prices estimated between $0.0254651871 and $0.0465398247
- SOL may enter a bullish phase, with prices estimated between $214.9921728 and $455.6550528
- Key drivers: Institutional inflows, ETF developments, ecosystem growth
Long-term Prediction (2030)
- ACT: Base scenario $0.060044386615837 - $0.071452820072846 | Optimistic scenario $0.071452820072846+
- SOL: Base scenario $362.5722213594624 - $496.67427583488 | Optimistic scenario $526.4747323849728+
Disclaimer: These predictions are based on historical data and market analysis. Cryptocurrency markets are highly volatile and subject to rapid changes. This information should not be considered as financial advice. Always conduct your own research before making investment decisions.
ACT:
| 年份 | 预测最高价 | 预测平均价格 | 预测最低价 | 涨跌幅 |
|---|---|---|---|---|
| 2025 | 0.046009 | 0.0331 | 0.028466 | 0 |
| 2026 | 0.04825649 | 0.0395545 | 0.027292605 | 19 |
| 2027 | 0.0465398247 | 0.043905495 | 0.0254651871 | 32 |
| 2028 | 0.056980551411 | 0.04522265985 | 0.0248724629175 | 36 |
| 2029 | 0.068987167601175 | 0.0511016056305 | 0.029127915209385 | 54 |
| 2030 | 0.071452820072846 | 0.060044386615837 | 0.030622637174077 | 81 |
SOL:
| 年份 | 预测最高价 | 预测平均价格 | 预测最低价 | 涨跌幅 |
|---|---|---|---|---|
| 2025 | 322.728 | 230.52 | 152.1432 | 0 |
| 2026 | 365.14368 | 276.624 | 226.83168 | 19 |
| 2027 | 455.6550528 | 320.88384 | 214.9921728 | 38 |
| 2028 | 419.331002112 | 388.2694464 | 322.263640512 | 68 |
| 2029 | 589.54832741376 | 403.800224256 | 246.31813679616 | 74 |
| 2030 | 526.4747323849728 | 496.67427583488 | 362.5722213594624 | 114 |
IV. Investment Strategy Comparison: ACT vs SOL
Long-term vs Short-term Investment Strategies
- ACT: Suitable for investors interested in AI technology potential and emerging projects
- SOL: Suitable for investors seeking established ecosystems and blockchain infrastructure exposure
Risk Management and Asset Allocation
- Conservative investors: ACT: 10% vs SOL: 90%
- Aggressive investors: ACT: 30% vs SOL: 70%
- Hedging tools: Stablecoin allocation, options, cross-currency portfolios
V. Potential Risk Comparison
Market Risk
- ACT: Higher volatility due to lower market cap and liquidity
- SOL: Exposure to broader crypto market trends and competitor performance
Technical Risk
- ACT: Scalability, network stability (limited information available)
- SOL: Network outages, smart contract vulnerabilities
Regulatory Risk
- Global regulatory policies may affect both differently, with SOL potentially facing more scrutiny due to its higher profile
VI. Conclusion: Which Is the Better Buy?
📌 Investment Value Summary:
- ACT advantages: Innovative AI focus, potential for high growth from a lower market cap
- SOL advantages: Established ecosystem, high performance, institutional adoption
✅ Investment Advice:
- Novice investors: Consider a small allocation to SOL as part of a diversified crypto portfolio
- Experienced investors: Balanced approach with a larger allocation to SOL and a smaller speculative position in ACT
- Institutional investors: Focus on SOL for its liquidity, ecosystem, and potential regulatory clarity
⚠️ Risk Warning: Cryptocurrency markets are highly volatile. This article does not constitute investment advice. None
VII. FAQ
Q1: What are the main differences between ACT and SOL? A: ACT focuses on AI interactions and networking, while SOL is a high-performance blockchain protocol. SOL has a more established ecosystem, higher market cap, and greater institutional adoption, whereas ACT is a newer project with potential in the AI sector.
Q2: Which cryptocurrency has shown better price performance recently? A: SOL has shown better price performance and resilience compared to ACT. As of October 3, 2025, SOL's price was $231.04, while ACT's price was $0.03305.
Q3: What are the key investment considerations for ACT and SOL? A: For ACT, consider its innovative approach to AI and potential for higher percentage gains. For SOL, focus on its established platform, wide adoption, and growth in DeFi and NFT sectors. Both carry risks, with ACT having higher volatility and SOL facing competition from other blockchains.
Q4: How do the supply mechanisms of ACT and SOL differ? A: ACT has a market capitalization of 20-30 million USD with a growing holder base. SOL has an inflationary model with staking rewards (6-8% annual yield) that can be reduced through governance.
Q5: What are the long-term price predictions for ACT and SOL? A: By 2030, ACT's base scenario price range is predicted to be $0.060044386615837 - $0.071452820072846, while SOL's base scenario range is $362.5722213594624 - $496.67427583488. However, these predictions are subject to market volatility and should not be considered financial advice.
Q6: How should investors allocate their portfolio between ACT and SOL? A: Conservative investors might consider allocating 10% to ACT and 90% to SOL, while aggressive investors might opt for 30% ACT and 70% SOL. The exact allocation depends on individual risk tolerance and investment goals.
Q7: What are the main risks associated with investing in ACT and SOL? A: ACT faces higher volatility due to its lower market cap and liquidity. SOL is exposed to broader crypto market trends and potential network outages. Both cryptocurrencies are subject to regulatory risks, with SOL potentially facing more scrutiny due to its higher profile.
Share
Content
Introduction: ACT vs SOL Investment Comparison
I. Price History Comparison and Current Market Status
II. Project Fundamentals Comparison
III. Investment Considerations
IV. Conclusion
II. Core Factors Affecting Investment Value of ACT vs SOL
IV. Investment Strategy Comparison: ACT vs SOL
V. Potential Risk Comparison
VI. Conclusion: Which Is the Better Buy?
VII. FAQ

