AIA vs ADA: The Battle for AI Dominance in the Insurance Industry
Introduction: Investment Comparison between AIA and ADA
In the cryptocurrency market, the comparison between DeAgentAI (AIA) vs Cardano (ADA) has been an unavoidable topic for investors. The two differ significantly in market cap ranking, application scenarios, and price performance, representing different positioning in the crypto asset space.
DeAgentAI (AIA): Since its launch, it has gained market recognition for its AI Agent infrastructure across multiple ecosystems.
Cardano (ADA): Introduced in 2017, it has been hailed as a "third-generation" blockchain platform, and is one of the cryptocurrencies with high global trading volume and market capitalization.
This article will comprehensively analyze the investment value comparison between AIA and ADA, focusing on historical price trends, supply mechanisms, institutional adoption, technological ecosystems, and future predictions, attempting to answer the question investors care about most:
"Which is the better buy right now?"
I. Price History Comparison and Current Market Status
DeAgentAI (AIA) and Cardano (ADA) Historical Price Trends
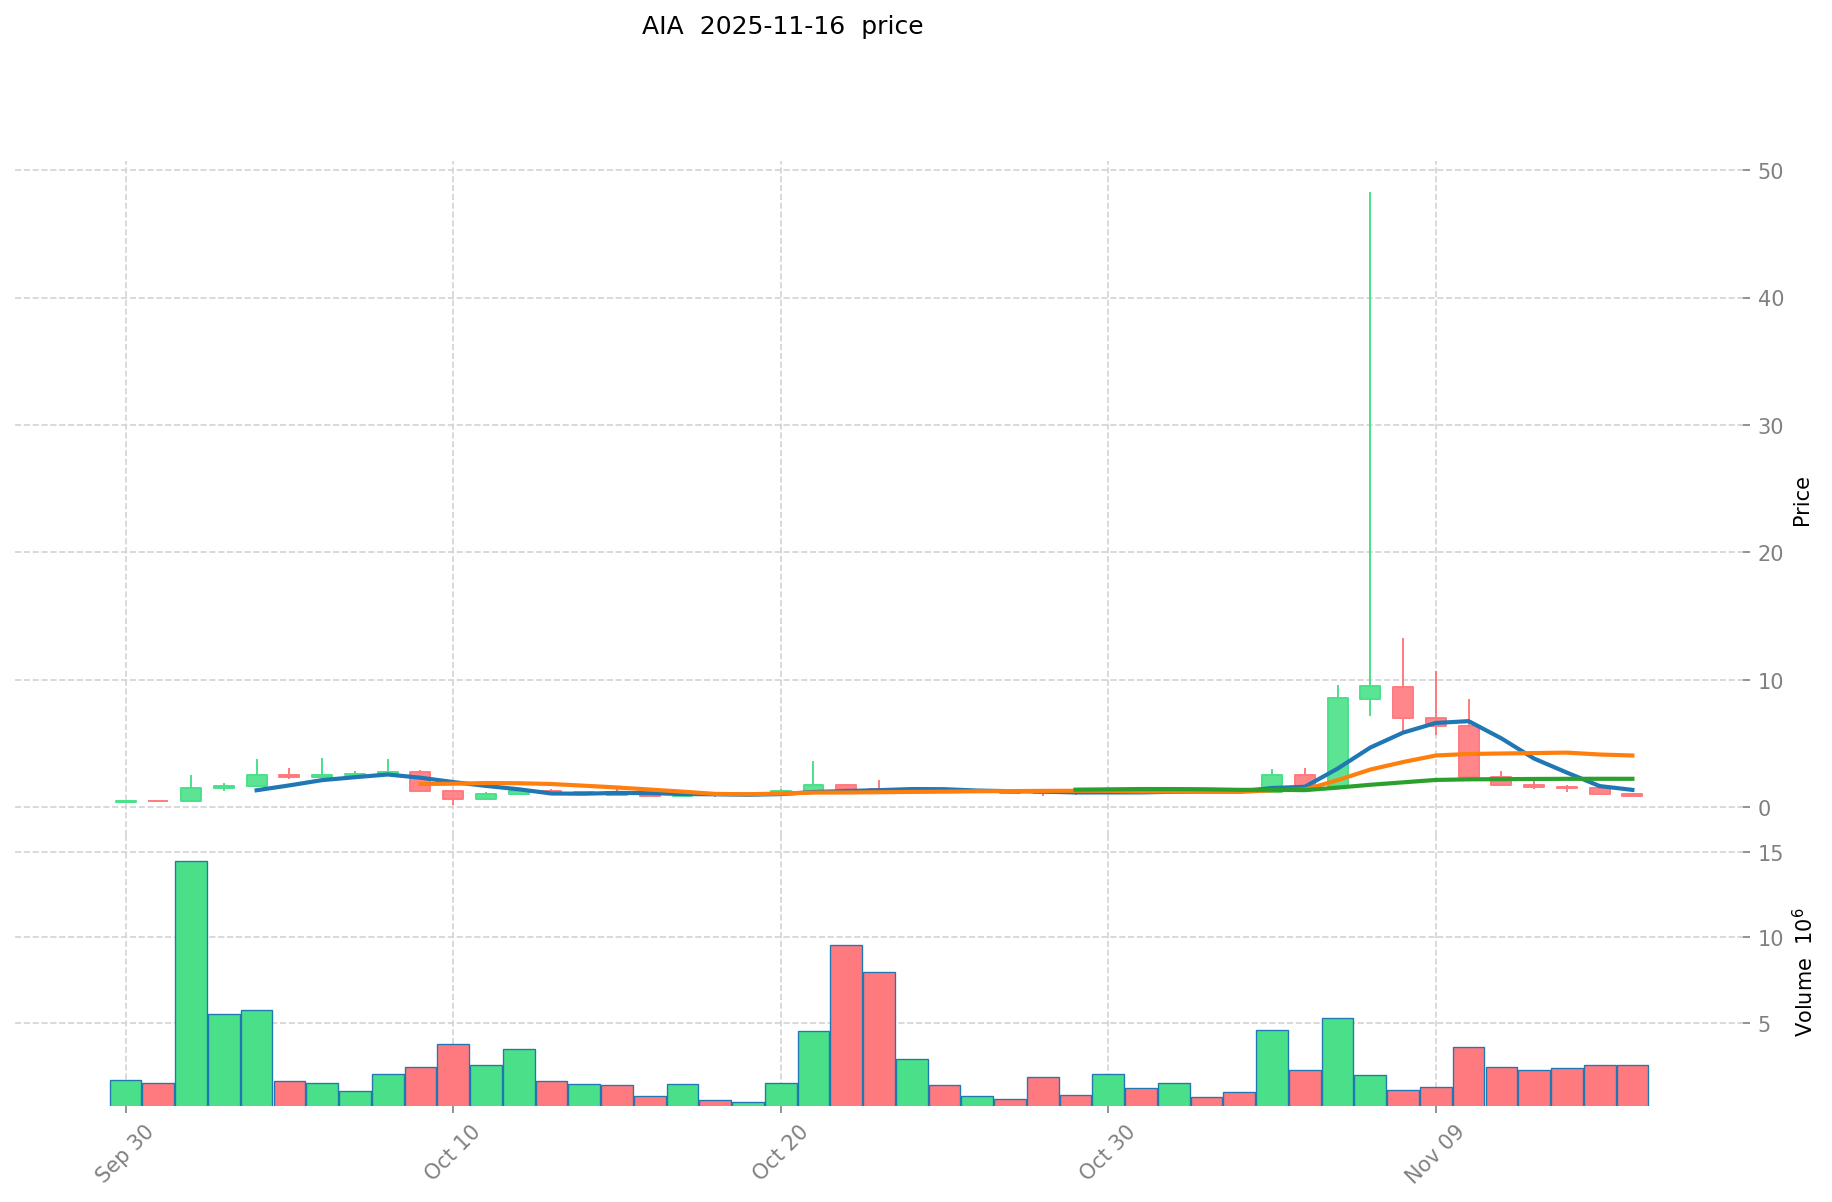
- 2025: AIA reached an all-time high of $48.3 on November 7, 2025, and an all-time low of $0.16356 on October 10, 2025.
- 2021: ADA reached its all-time high of $3.09 on September 2, 2021.
- Comparative analysis: In recent market cycles, AIA has shown significant volatility, ranging from $48.3 to $0.16356, while ADA has experienced a more stable trend, currently trading at $0.4809.
Current Market Situation (2025-11-17)
- AIA current price: $0.834
- ADA current price: $0.4809
- 24-hour trading volume: AIA $3,191,726.10 vs ADA $5,217,789.67
- Market Sentiment Index (Fear & Greed Index): 10 (Extreme Fear)
Click to view real-time prices:
- View AIA current price Market Price
- View ADA current price Market Price

II. Core Factors Affecting Investment Value of AIA vs ADA
Supply Mechanism Comparison (Tokenomics)
- AIA: Fixed maximum supply of 1 billion tokens with deflationary burn mechanism
- ADA: Fixed maximum supply of 45 billion tokens with no burn mechanism
- 📌 Historical Pattern: Deflationary tokenomics like AIA's burn mechanism typically create upward price pressure over time, while ADA's fixed supply model relies more on adoption metrics for value growth.
Institutional Adoption and Market Applications
- Institutional Holdings: ADA currently has stronger institutional backing with inclusion in Grayscale's Digital Large Cap Fund and availability on more institutional platforms
- Enterprise Adoption: ADA leads in enterprise applications through partnerships with Ethiopian Ministry of Education and commercial implementations, while AIA focuses more on immediate payment solutions
- National Policies: Both tokens face varied regulatory scrutiny across jurisdictions, with ADA generally receiving more favorable treatment due to its academic foundation and transparent development
Technical Development and Ecosystem Building
- AIA Technical Upgrades: Implementation of scalable smart contracts and cross-chain interoperability
- ADA Technical Development: Continued improvement of Hydra scaling solution and completion of Voltaire governance phase
- Ecosystem Comparison: ADA has a more mature DeFi ecosystem with established DEXes and yield farming protocols, while AIA is expanding its NFT marketplace capabilities and focusing on payment integrations
Macroeconomic and Market Cycles
- Performance in Inflationary Environments: ADA has demonstrated stronger historical performance during inflationary periods due to its wider market adoption
- Macroeconomic Monetary Policy: Both tokens show sensitivity to Federal Reserve policy changes, with ADA typically exhibiting higher correlation with traditional markets
- Geopolitical Factors: ADA's focus on developing markets provides potential hedge against Western economic volatility, while AIA's positioning in payment systems offers utility in cross-border transaction scenarios
III. 2025-2030 Price Prediction: AIA vs ADA
Short-term Prediction (2025)
- AIA: Conservative $0.5727 - $0.83 | Optimistic $0.83 - $1.1869
- ADA: Conservative $0.402384 - $0.4848 | Optimistic $0.4848 - $0.538128
Mid-term Prediction (2027)
- AIA may enter a growth phase, with expected prices ranging from $0.93604329 to $1.6800777
- ADA may enter a gradual growth phase, with expected prices ranging from $0.298183512 to $0.6072100608
- Key drivers: Institutional fund inflows, ETF developments, ecosystem growth
Long-term Prediction (2030)
- AIA: Base scenario $1.68350985873 - $2.2390681121109 | Optimistic scenario $2.2390681121109+
- ADA: Base scenario $0.7301321474832 - $0.854254612555344 | Optimistic scenario $0.854254612555344+
Disclaimer: This analysis is based on historical data and current market trends. Cryptocurrency markets are highly volatile and unpredictable. This information should not be considered as financial advice. Always conduct your own research before making any investment decisions.
AIA:
| 年份 | 预测最高价 | 预测平均价格 | 预测最低价 | 涨跌幅 |
|---|---|---|---|---|
| 2025 | 1.1869 | 0.83 | 0.5727 | 0 |
| 2026 | 1.391661 | 1.00845 | 0.968112 | 22 |
| 2027 | 1.6800777 | 1.2000555 | 0.93604329 | 45 |
| 2028 | 1.526470596 | 1.4400666 | 1.36806327 | 74 |
| 2029 | 1.88375111946 | 1.483268598 | 1.42393785408 | 79 |
| 2030 | 2.2390681121109 | 1.68350985873 | 1.0437761124126 | 103 |
ADA:
| 年份 | 预测最高价 | 预测平均价格 | 预测最低价 | 涨跌幅 |
|---|---|---|---|---|
| 2025 | 0.538128 | 0.4848 | 0.402384 | 0 |
| 2026 | 0.57283968 | 0.511464 | 0.34779552 | 6 |
| 2027 | 0.6072100608 | 0.54215184 | 0.298183512 | 12 |
| 2028 | 0.816046949568 | 0.5746809504 | 0.327568141728 | 19 |
| 2029 | 0.7649003449824 | 0.695363949984 | 0.64668847348512 | 44 |
| 2030 | 0.854254612555344 | 0.7301321474832 | 0.503791181763408 | 51 |
IV. Investment Strategy Comparison: AIA vs ADA
Long-term vs Short-term Investment Strategies
- AIA: Suitable for investors focused on AI infrastructure and cross-ecosystem potential
- ADA: Suitable for investors seeking stability and academic-backed blockchain development
Risk Management and Asset Allocation
- Conservative investors: AIA: 30% vs ADA: 70%
- Aggressive investors: AIA: 60% vs ADA: 40%
- Hedging tools: Stablecoin allocation, options, cross-currency portfolio
V. Potential Risk Comparison
Market Risks
- AIA: Higher volatility and potential for rapid price swings
- ADA: Slower price movement but susceptible to overall crypto market trends
Technical Risks
- AIA: Scalability, network stability
- ADA: Centralization concerns, potential security vulnerabilities
Regulatory Risks
- Global regulatory policies may impact both differently, with ADA potentially facing less scrutiny due to its academic foundation
VI. Conclusion: Which Is the Better Buy?
📌 Investment Value Summary:
- AIA advantages: AI-focused infrastructure, deflationary tokenomics, cross-ecosystem potential
- ADA advantages: Established ecosystem, academic backing, strong institutional adoption
✅ Investment Advice:
- New investors: Consider a higher allocation to ADA for its established track record
- Experienced investors: Balanced portfolio with both AIA and ADA, adjusting based on risk tolerance
- Institutional investors: ADA may be more suitable due to its wider adoption and regulatory positioning
⚠️ Risk Warning: The cryptocurrency market is highly volatile. This article does not constitute investment advice. None
VII. FAQ
Q1: What are the main differences between AIA and ADA? A: AIA is focused on AI infrastructure across ecosystems with a deflationary tokenomics model, while ADA is a more established "third-generation" blockchain platform with a fixed supply and stronger institutional backing.
Q2: Which token has shown better price performance recently? A: AIA has shown more significant volatility, reaching an all-time high of $48.3 in 2025, while ADA has demonstrated a more stable trend, currently trading at $0.4809.
Q3: How do the supply mechanisms of AIA and ADA differ? A: AIA has a fixed maximum supply of 1 billion tokens with a deflationary burn mechanism, while ADA has a fixed maximum supply of 45 billion tokens without a burn mechanism.
Q4: Which token has stronger institutional adoption? A: ADA currently has stronger institutional backing, being included in Grayscale's Digital Large Cap Fund and available on more institutional platforms.
Q5: What are the key technical developments for each token? A: AIA is implementing scalable smart contracts and cross-chain interoperability, while ADA is improving its Hydra scaling solution and completing the Voltaire governance phase.
Q6: How do the long-term price predictions for AIA and ADA compare? A: By 2030, AIA's base scenario predicts a range of $1.68350985873 - $2.2390681121109, while ADA's base scenario predicts $0.7301321474832 - $0.854254612555344.
Q7: What are the recommended investment strategies for AIA and ADA? A: Conservative investors might consider allocating 30% to AIA and 70% to ADA, while aggressive investors might opt for 60% AIA and 40% ADA. New investors may prefer a higher allocation to ADA for its established track record.
Q8: What are the main risks associated with investing in AIA and ADA? A: AIA faces higher volatility and potential scalability issues, while ADA may experience slower price movement and potential centralization concerns. Both are subject to overall crypto market trends and regulatory risks.
Share
Content
Introduction: Investment Comparison between AIA and ADA
I. Price History Comparison and Current Market Status
II. Core Factors Affecting Investment Value of AIA vs ADA
III. 2025-2030 Price Prediction: AIA vs ADA
IV. Investment Strategy Comparison: AIA vs ADA
V. Potential Risk Comparison
VI. Conclusion: Which Is the Better Buy?
VII. FAQ

