GEOD vs TRX: A Comparative Analysis of Two Emerging Blockchain Technologies
Introduction: GEOD vs TRX Investment Comparison
In the cryptocurrency market, the comparison between GEODNET (GEOD) and TRON (TRX) has been an unavoidable topic for investors. The two not only show significant differences in market cap ranking, application scenarios, and price performance but also represent different positioning in the crypto asset space.
GEODNET (GEOD): Since its launch, it has gained market recognition for its focus on Real-Time Kinematics (RTK) and Global Navigation Satellite System (GNSS) signal correction.
TRON (TRX): Introduced in 2017, it has been hailed as a platform for decentralized applications and content distribution, becoming one of the cryptocurrencies with the highest global trading volume and market capitalization.
This article will comprehensively analyze the investment value comparison between GEOD and TRX, focusing on historical price trends, supply mechanisms, institutional adoption, technological ecosystems, and future predictions, attempting to answer the question most concerning to investors:
"Which is the better buy right now?"
I. Price History Comparison and Current Market Status
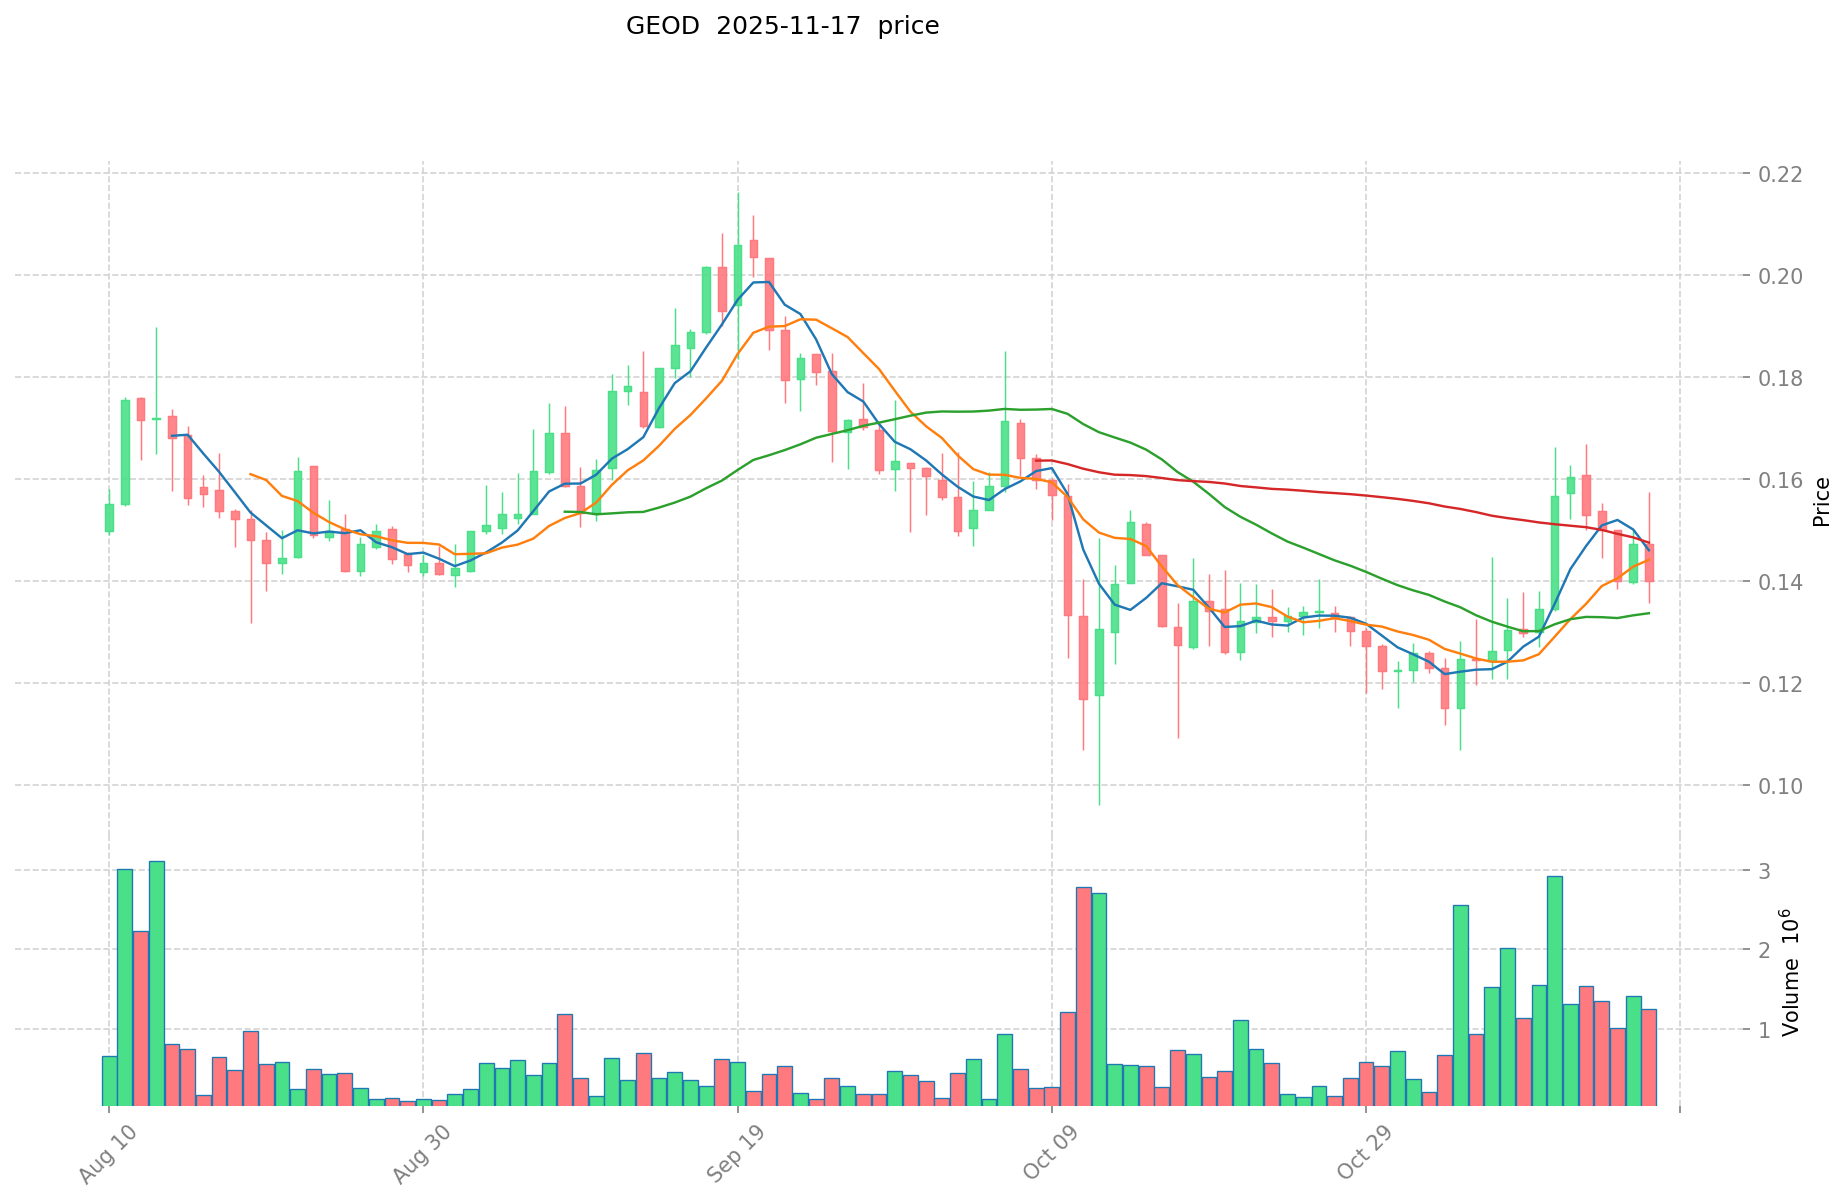
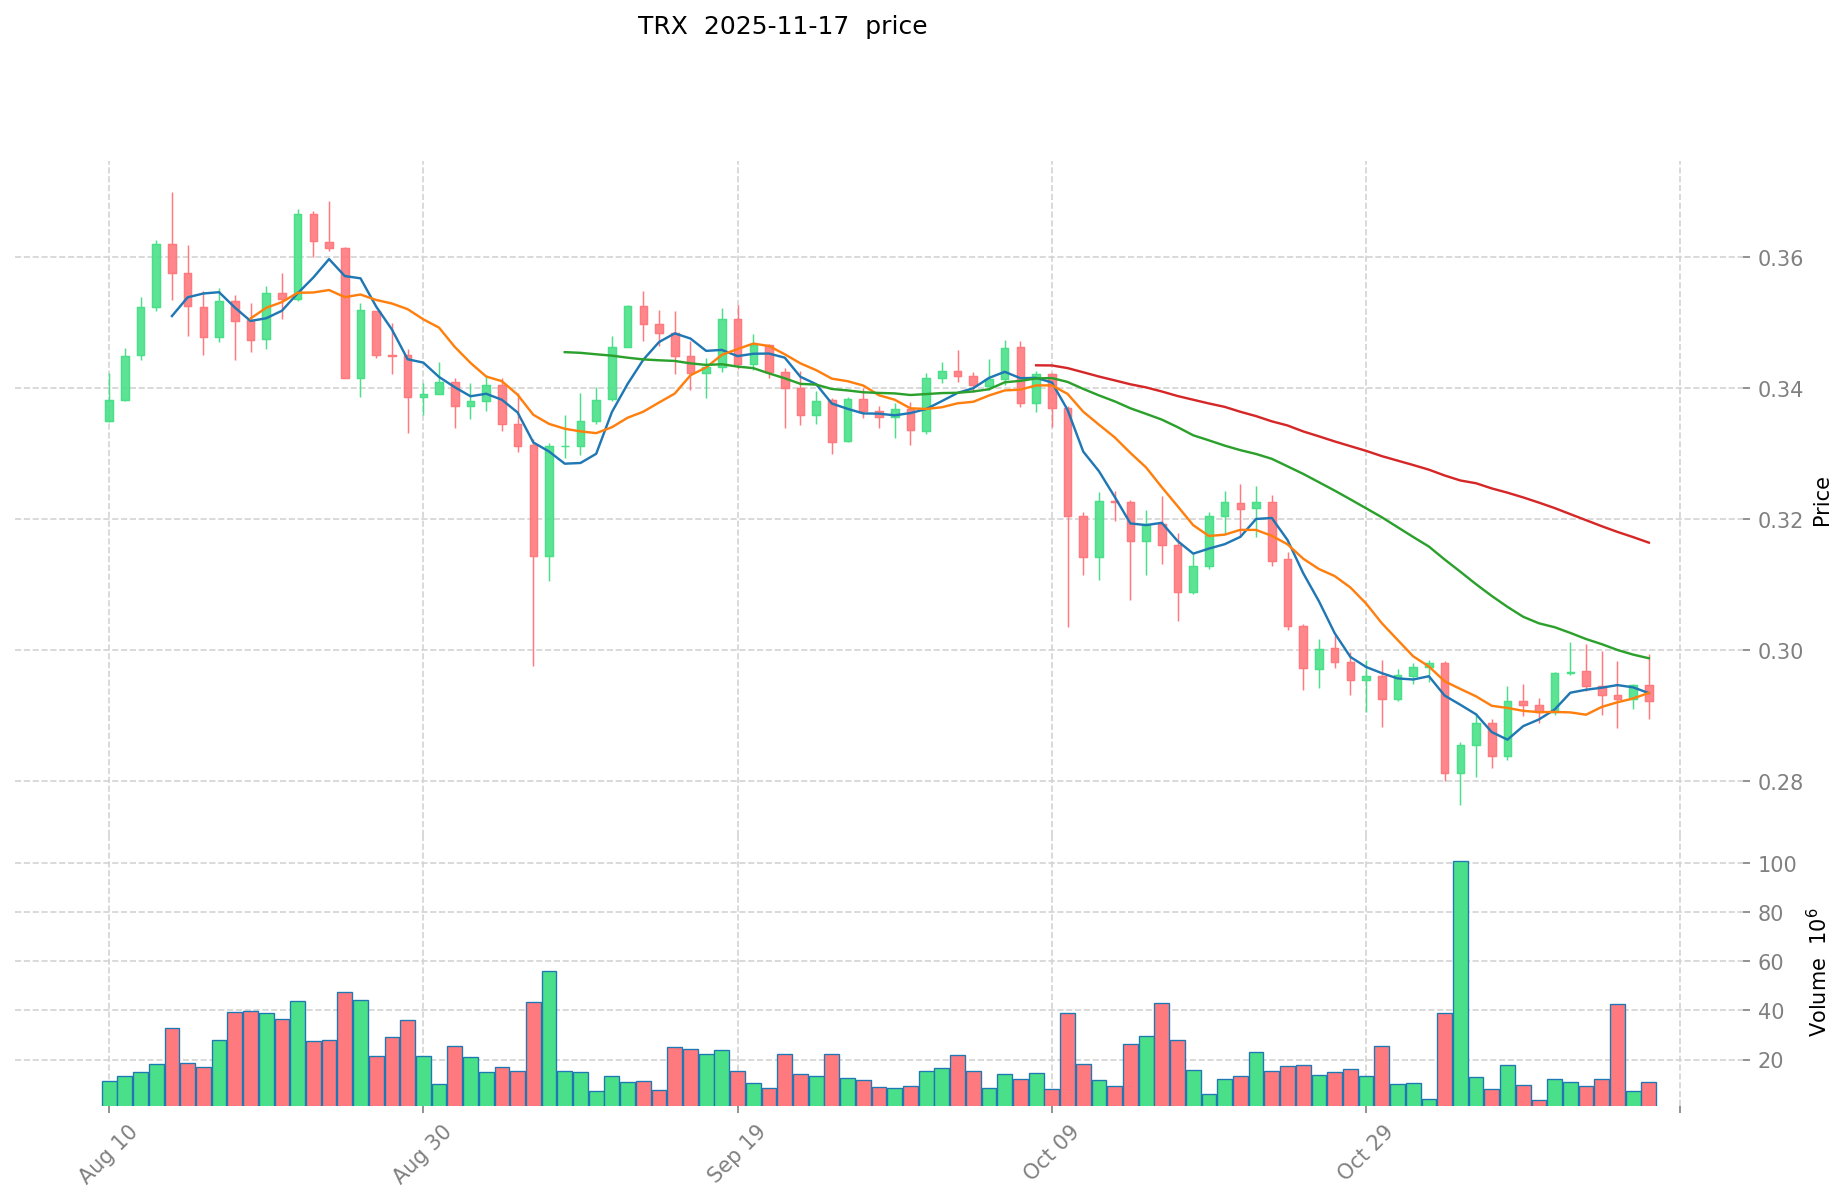
GEOD and TRX Historical Price Trends
- 2025: GEOD reached its all-time high of $0.37899 on January 25, 2025, and its all-time low of $0.09605 on October 12, 2025.
- 2024: TRX hit its all-time high of $0.431288 on December 4, 2024.
- Comparative Analysis: In the recent market cycle, GEOD has experienced significant volatility, dropping from its high of $0.37899 to a low of $0.09605, while TRX has shown more stability, maintaining a higher price point above $0.29.
Current Market Situation (2025-11-17)
- GEOD current price: $0.14318
- TRX current price: $0.29291
- 24-hour trading volume: GEOD $169,542.34 vs TRX $3,297,948.93
- Market Sentiment Index (Fear & Greed Index): 10 (Extreme Fear)
Click to view real-time prices:
- Check GEOD current price Market Price
- Check TRX current price Market Price
II. Core Factors Affecting the Investment Value of GEOD vs TRX
Supply Mechanism Comparison (Tokenomics)
-
GEOD: Fixed supply of 10,000,000,000 GEOD tokens with no additional minting, creating a deflationary model
-
TRX: Total supply of 100,846,433,019 TRX with an inflationary model through block rewards, though with a staking mechanism that can lock tokens
-
📌 Historical Pattern: Fixed supply models like GEOD's typically create upward price pressure during demand increases, while TRX's inflationary model requires consistent adoption growth to maintain price stability.
Institutional Adoption and Market Applications
- Institutional Holdings: TRX currently has stronger institutional presence with established partnerships across various industries, while GEOD is still building its institutional relationships
- Enterprise Adoption: TRX has more extensive enterprise applications in content delivery, gaming, and DeFi, while GEOD is focusing on its unique polygon-based DeFi ecosystem
- Regulatory Stance: Both face varying regulatory scrutiny across jurisdictions, with TRX having navigated regulatory challenges in major markets longer than the newer GEOD
Technical Development and Ecosystem Building
- GEOD Technical Upgrades: Focus on developing cross-chain liquidity through polygon infrastructure and building comprehensive DeFi applications
- TRX Technical Development: Established TRON network with continued optimization for scalability and transaction throughput, supporting a mature dApp ecosystem
- Ecosystem Comparison: TRX offers a more developed ecosystem across DeFi, NFTs, and dApps with higher transaction volumes, while GEOD is building its niche in polygon-based DeFi services with growing liquidity pools
Macroeconomic Factors and Market Cycles
- Performance in Inflationary Environments: TRX has demonstrated more resilience during inflationary periods due to its established market position, while GEOD's fixed supply model could theoretically provide stronger inflation protection in the long term
- Macroeconomic Monetary Policy: Rising interest rates have historically created headwinds for both assets, though established networks like TRON have shown more stability
- Geopolitical Factors: Cross-border transaction demand benefits both tokens, with TRX having more established usage patterns in international transfers
III. 2025-2030 Price Prediction: GEOD vs TRX
Short-term Prediction (2025)
- GEOD: Conservative $0.1368 - $0.144 | Optimistic $0.144 - $0.17856
- TRX: Conservative $0.2079235 - $0.29285 | Optimistic $0.29285 - $0.316278
Mid-term Prediction (2027)
- GEOD may enter a growth phase, with an estimated price range of $0.151933824 - $0.245290752
- TRX may enter a bullish market, with an estimated price range of $0.20101224 - $0.486084144
- Key drivers: Institutional capital inflow, ETF, ecosystem development
Long-term Prediction (2030)
- GEOD: Base scenario $0.223136792371584 - $0.2452052663424 | Optimistic scenario $0.2452052663424 - $0.274629898303488
- TRX: Base scenario $0.487344389781834 - $0.6016597404714 | Optimistic scenario $0.6016597404714 - $0.794190857422248
Disclaimer
GEOD:
| 年份 | 预测最高价 | 预测平均价格 | 预测最低价 | 涨跌幅 |
|---|---|---|---|---|
| 2025 | 0.17856 | 0.144 | 0.1368 | 0 |
| 2026 | 0.2048256 | 0.16128 | 0.1483776 | 12 |
| 2027 | 0.245290752 | 0.1830528 | 0.151933824 | 27 |
| 2028 | 0.24415582464 | 0.214171776 | 0.18847116288 | 49 |
| 2029 | 0.2612467323648 | 0.22916380032 | 0.1558313842176 | 60 |
| 2030 | 0.274629898303488 | 0.2452052663424 | 0.223136792371584 | 71 |
TRX:
| 年份 | 预测最高价 | 预测平均价格 | 预测最低价 | 涨跌幅 |
|---|---|---|---|---|
| 2025 | 0.316278 | 0.29285 | 0.2079235 | 0 |
| 2026 | 0.4263896 | 0.304564 | 0.2436512 | 4 |
| 2027 | 0.486084144 | 0.3654768 | 0.20101224 | 24 |
| 2028 | 0.63441290328 | 0.425780472 | 0.25972608792 | 45 |
| 2029 | 0.6732227933028 | 0.53009668764 | 0.3233589794604 | 81 |
| 2030 | 0.794190857422248 | 0.6016597404714 | 0.487344389781834 | 105 |
IV. Investment Strategy Comparison: GEOD vs TRX
Long-term vs Short-term Investment Strategies
- GEOD: Suitable for investors focused on DeFi potential and polygon ecosystem growth
- TRX: Suitable for investors seeking established networks with broader application scenarios
Risk Management and Asset Allocation
- Conservative investors: GEOD: 20% vs TRX: 80%
- Aggressive investors: GEOD: 40% vs TRX: 60%
- Hedging tools: Stablecoin allocation, options, cross-currency portfolios
V. Potential Risk Comparison
Market Risk
- GEOD: Higher volatility due to lower market cap and trading volume
- TRX: Susceptible to broader crypto market trends and competitor actions
Technical Risk
- GEOD: Scalability, network stability in early development stages
- TRX: Hash power concentration, potential security vulnerabilities
Regulatory Risk
- Global regulatory policies may have differing impacts on both tokens
VI. Conclusion: Which Is the Better Buy?
📌 Investment Value Summary:
- GEOD advantages: Fixed supply model, focus on polygon-based DeFi ecosystem
- TRX advantages: Established network, higher liquidity, broader adoption
✅ Investment Advice:
- New investors: Consider a small allocation to GEOD for diversification, larger allocation to TRX for stability
- Experienced investors: Balanced portfolio with both assets, adjusting based on risk tolerance
- Institutional investors: TRX for liquidity and established track record, GEOD for potential growth exposure
⚠️ Risk Warning: Cryptocurrency markets are highly volatile. This article does not constitute investment advice. None
VII. FAQ
Q1: What are the main differences between GEOD and TRX? A: GEOD has a fixed supply of 10 billion tokens and focuses on polygon-based DeFi, while TRX has an inflationary model with over 100 billion tokens and a more established ecosystem across DeFi, NFTs, and dApps.
Q2: Which cryptocurrency has shown better price performance recently? A: TRX has shown more stability, maintaining a higher price point above $0.29, while GEOD has experienced significant volatility, dropping from its high of $0.37899 to a low of $0.09605 in the recent market cycle.
Q3: How do the long-term price predictions for GEOD and TRX compare? A: By 2030, GEOD is predicted to reach $0.223-$0.274, while TRX is expected to reach $0.487-$0.794 in the base scenario, indicating potentially higher growth for TRX.
Q4: What are the key factors affecting the investment value of GEOD and TRX? A: Key factors include supply mechanisms, institutional adoption, technical development, ecosystem building, and macroeconomic factors such as inflation and interest rates.
Q5: How should investors allocate their portfolio between GEOD and TRX? A: Conservative investors might consider 20% GEOD and 80% TRX, while aggressive investors could opt for 40% GEOD and 60% TRX, adjusting based on individual risk tolerance and market conditions.
Q6: What are the main risks associated with investing in GEOD and TRX? A: Risks include market volatility, technical challenges, regulatory uncertainties, and competition within the cryptocurrency space. GEOD faces higher volatility due to its lower market cap, while TRX is more susceptible to broader crypto market trends.
Share
Content
Introduction: GEOD vs TRX Investment Comparison
I. Price History Comparison and Current Market Status
II. Core Factors Affecting the Investment Value of GEOD vs TRX
III. 2025-2030 Price Prediction: GEOD vs TRX
IV. Investment Strategy Comparison: GEOD vs TRX
V. Potential Risk Comparison
VI. Conclusion: Which Is the Better Buy?
VII. FAQ

