Is XDB CHAIN (XDB) a good investment?: A Comprehensive Analysis of Price Potential, Technology, and Market Viability in 2024


Introduction: XDB CHAIN (XDB) Investment Position and Market Prospects
XDB is a native cryptocurrency asset within the blockchain ecosystem, launched in September 2019. As a Real World Asset (RWA) token, XDB powers the XDB CHAIN protocol layer blockchain designed to empower brands and consumers. As of December 24, 2025, XDB's fully diluted valuation stands at approximately $4,712,082.98, with a circulating supply of approximately 17.06 billion tokens out of a maximum supply of 20 billion tokens. The current price is approximately $0.0002511.
XDB CHAIN distinguishes itself through its innovative deflationary tokenomics model called Buyback and Burn (BBB), which is supported by branded token (BCO) economics. The platform facilitates fast and affordable transfer of consumer digital assets, including branded tokens, non-fungible tokens (NFTs), and stablecoins.
Investors and market participants increasingly pose the question "Is XDB CHAIN (XDB) a good investment?" when evaluating opportunities within the blockchain space. This article provides a comprehensive analysis of XDB's investment value, historical price performance, future price projections, and associated investment risks to serve as a reference for potential investors.
XDB CHAIN (XDB) Market Analysis Report
I. Price History Review and Current Investment Value of XDB
Historical Price Performance and Investment Returns
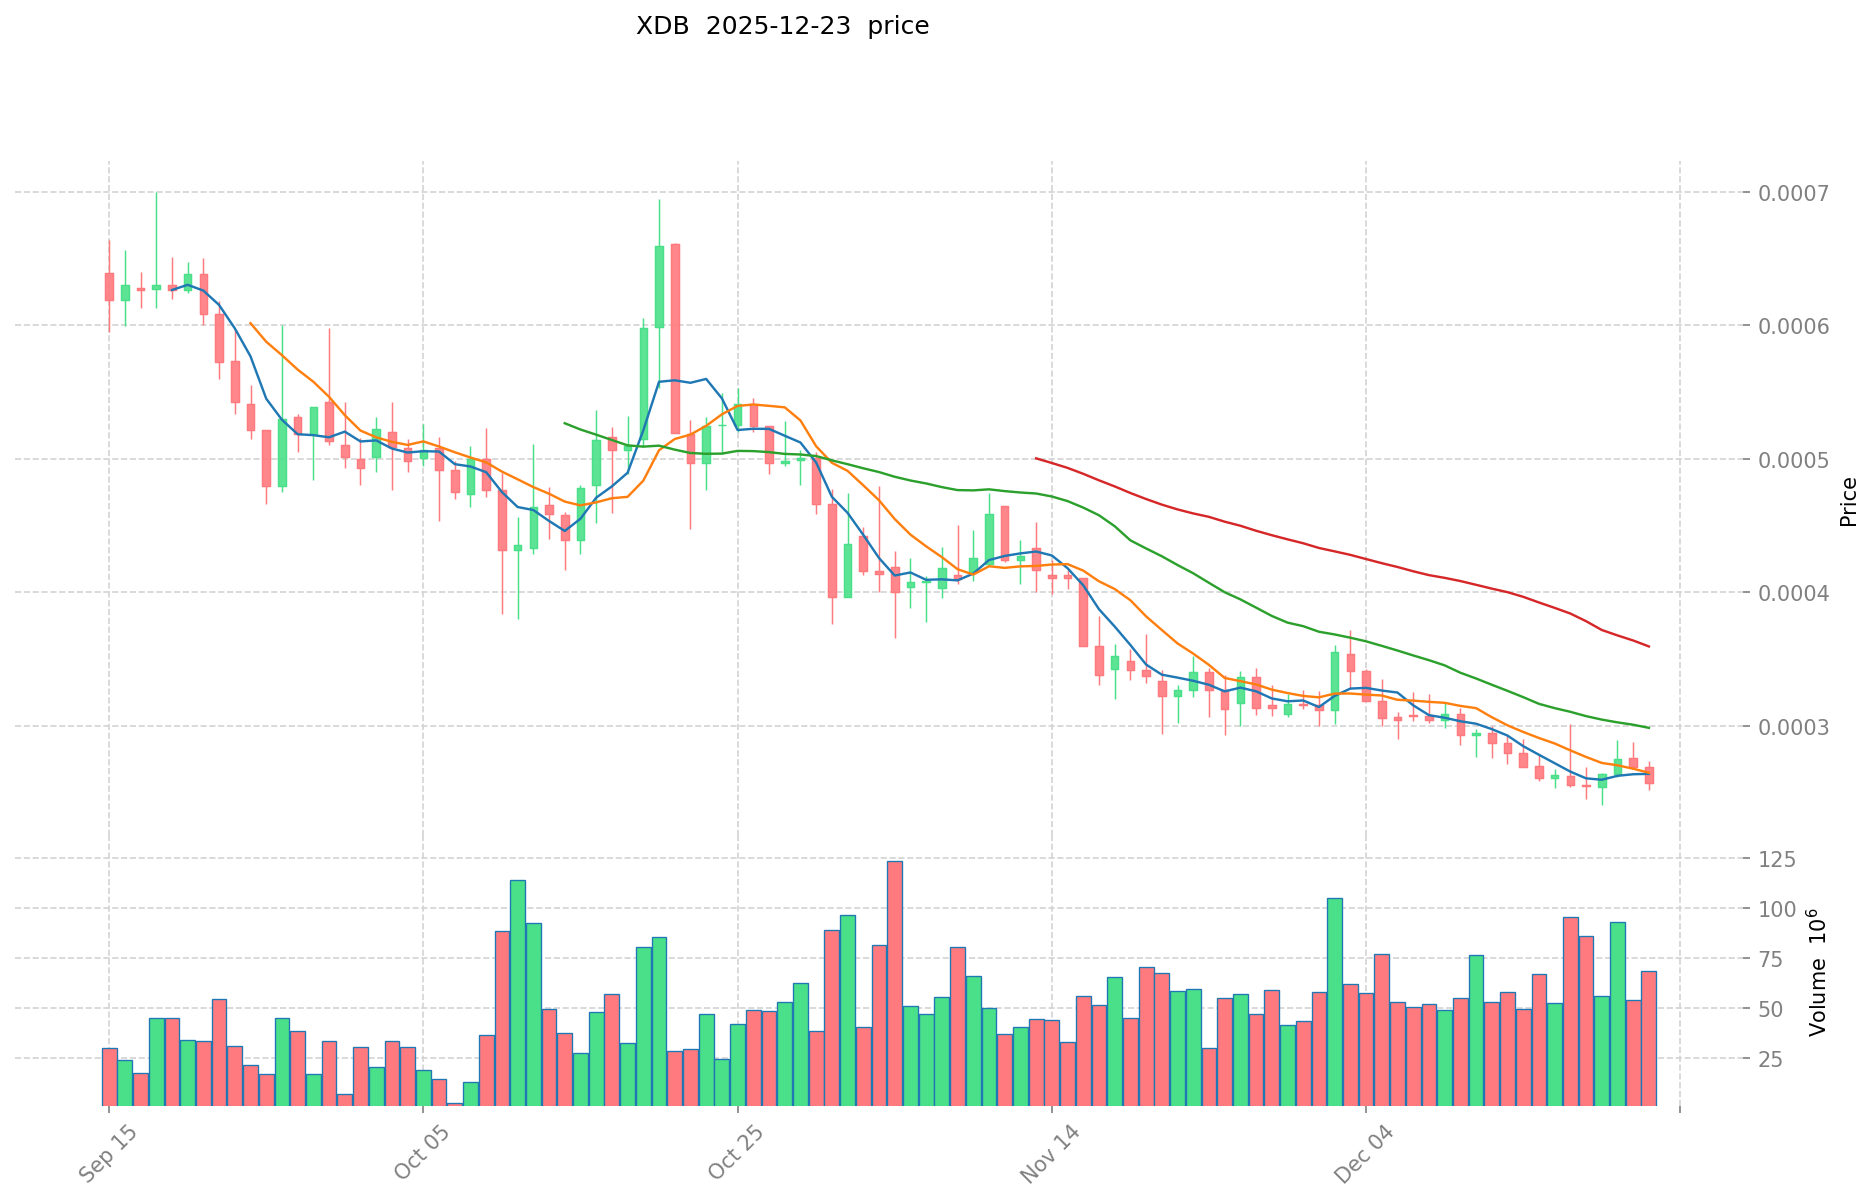
Based on available data, XDB CHAIN has experienced significant price volatility since its inception:
- November 22, 2021: All-time high of $0.850722 was recorded, representing the peak valuation period for the token
- November 4, 2024: All-time low of $0.00021539 was reached, marking the lowest price point in the token's history
- September 9, 2019: Initial token launch at $0.015302
The trajectory from launch to all-time high represented substantial early gains for initial investors, followed by a dramatic 99.97% decline from peak to the recent low price point.
Current Market Status (December 24, 2025)
| Metric | Value |
|---|---|
| Current Price | $0.0002511 |
| 24-Hour Change | -3.64% |
| 1-Hour Change | -0.24% |
| 7-Day Change | -3.39% |
| 30-Day Change | -25.04% |
| 1-Year Change | -68.50% |
| Market Capitalization | $4,283,028.43 |
| Fully Diluted Valuation | $4,712,082.98 |
| 24-Hour Trading Volume | $14,149.02 |
| Market Dominance | 0.00014% |
| Current Ranking | #1,626 |
Market Sentiment Indicator
Market Emotion Score: 1 (indicating neutral to bearish sentiment)
The token currently maintains minimal market dominance with 5,068 token holders and circulation representing 85.29% of total supply.
II. Project Overview and Fundamental Architecture
Core Concept and Use Case
XDB is the native token of XDB CHAIN, a protocol-layer blockchain designed to "empower brands and consumers of tomorrow." The platform functions as a real-world asset (RWA) infrastructure supporting fast and cost-effective transfers of consumer digital assets.
Supported Asset Classes
The platform facilitates the transfer of:
- Branded tokens (BCO)
- Non-fungible tokens (NFTs)
- Stablecoins
- Additional consumer digital assets
Tokenomic Mechanism: Buyback and Burn (BBB)
XDB CHAIN implements a deflationary economic model called Buyback and Burn (BBB), which is supported by the tokenomics of branded tokens (BCO). This mechanism is designed to:
- Create scarcity through token reduction
- Align incentives between the platform and token holders
- Support long-term value appreciation through deflationary mechanics
III. Token Supply Structure
| Supply Metric | Amount |
|---|---|
| Total Supply | 18,765,762,572 XDB |
| Maximum Supply | 20,000,000,000 XDB |
| Circulating Supply | 17,057,062,634 XDB |
| Circulating Supply Ratio | 85.29% |
The token distribution reflects a mature stage with the majority of tokens already in circulation.
IV. Community and Development Resources
Official Channels
- Website: https://digitalbits.io/
- Block Explorer: https://explorer.xdbchain.com/
- Whitepaper: https://xdbchain.com/wp-content/uploads/2023/12/xdb_chain_whitepaper.pdf
Social Media Presence
- Twitter: https://twitter.com/DigitalBitsOrg
- Reddit: https://www.reddit.com
- GitHub: https://github.com/DigitalBitsOrg and https://github.com/DigitalBitsOrg/datadog-digitalbits-core
- LinkedIn: https://www.linkedin.com/company/10008095
- Facebook: https://www.facebook.com/DigitalBitsOrg/
Exchange Availability
XDB is available for trading on 2 cryptocurrency exchanges.
V. Key Risk Considerations
- Extreme Price Volatility: The token has experienced a 99.97% decline from its all-time high
- Low Market Capitalization: Current market cap of approximately $4.3 million indicates relatively small market size
- Limited Trading Volume: 24-hour volume of $14,149 suggests low liquidity
- Bearish Short-Term Trend: Significant declines across 30-day (-25.04%) and 1-year (-68.50%) periods
- Concentrated Supply: 85% of supply already circulating may affect price discovery mechanisms
Disclaimer: This report is for informational purposes only and does not constitute investment advice. Cryptocurrency investments carry substantial risk, including the potential loss of principal. Investors should conduct their own research and consult with qualified financial advisors before making investment decisions.
Last Updated: December 24, 2025
XDB CHAIN (XDB) Investment Analysis Report
Report Date: December 24, 2025
I. Executive Summary
XDB CHAIN (XDB) is the native token of a protocol-layer blockchain designed to empower brands and consumers through fast and affordable transfer of consumer digital assets. The platform supports branded tokens (BCO), non-fungible tokens (NFTs), and stablecoins, incorporating a deflationary buyback and burn (BBB) mechanism. As of December 24, 2025, XDB is trading at $0.0002511 with a market capitalization of approximately $4.28 million and a market ranking of 1626.
II. Core Factors Influencing XDB CHAIN as an Investment
Supply Mechanism and Scarcity
Token Economics:
- Maximum supply: 20 billion XDB
- Circulating supply: 17.06 billion XDB (85.29% of max supply)
- Total market cap (FDMC): $4.71 million
- Current holder count: 5,068 addresses
Deflationary System: The platform introduces a Buyback and Burn (BBB) mechanism supported by the tokenomics of branded tokens (BCO). This deflationary system is designed to reduce token supply over time, theoretically supporting long-term scarcity dynamics.
Price History Context:
- All-time high: $0.850722 (November 22, 2021)
- All-time low: $0.00021539 (November 4, 2024)
- Current price represents a 99.97% decline from ATH
- Initial listing price: $0.015302 (September 16, 2019)
Technology and Ecosystem Development
Platform Architecture: XDB CHAIN functions as a protocol-layer blockchain specifically engineered to support:
- Branded consumer tokens (BCO)
- NFT infrastructure
- Stablecoin integration
- Fast and cost-efficient digital asset transfers
Real-World Asset Focus: XDB is classified as a Real World Asset (RWA), positioning it within the emerging infrastructure for tokenizing real-world value on blockchain networks.
Market Activity and Liquidity
Trading Volume:
- 24-hour trading volume: $14,149.02
- Listed on 2 exchanges
- Relatively low liquidity relative to market capitalization
Current Market Sentiment: The project maintains an active online presence with documented development:
- Website: https://digitalbits.io/
- GitHub repositories: Active development repositories maintained
- Block explorer: https://explorer.xdbchain.com/
- Social presence: Twitter (@DigitalBitsOrg)
III. Recent Price Performance Analysis
Short-Term Price Trends
| Timeframe | Change Percentage | Amount Change |
|---|---|---|
| 1 Hour | -0.24% | -$0.000000604 |
| 24 Hours | -3.64% | -$0.000009485 |
| 7 Days | -3.39% | -$0.000008811 |
| 30 Days | -25.04% | -$0.000083879 |
| 1 Year | -68.5% | -$0.000546043 |
Market Range (24H):
- High: $0.000265
- Low: $0.0002501
The token exhibits consistent downward pressure across multiple timeframes, with the most significant deterioration occurring over the 30-day and 1-year periods.
IV. Market Sentiment and Outlook
Analytical Consensus
Multiple analytical sources indicate a bearish forecast for 2025, with the following considerations:
Mixed Price Drivers:
- Positive factors: Deflationary burn mechanisms and potential real-world adoption could provide price support
- Negative factors: Market headwinds and execution risks present significant challenges
Projected 2025 Price Range:
- Consensus range: $0.000222 to $0.000425 USD
- Expected average target: Approximately $0.000324 USD
- January 19, 2026 forecast: $0.0003062 USD (representing 11.62% appreciation from current levels)
Risk Assessment
The analytical consensus characterizes XDB CHAIN as a high-risk investment with the following considerations:
- Low market capitalization ($4.28 million) indicates limited liquidity and greater volatility potential
- Execution risks related to technology development and real-world adoption
- Substantial decline from historical valuation levels
V. Community and Development Activity
Active Development Infrastructure:
- Multiple GitHub repositories demonstrating ongoing development
- Explorer infrastructure operational
- Website and social media presence maintained
Holder Distribution:
- 5,068 unique token holders
- Relatively distributed ownership structure
VI. Disclaimer
This report presents factual data and market analysis based on available information as of December 24, 2025. The inclusion of price forecasts and market sentiment represents third-party analyst opinions and should not be construed as investment recommendations. Cryptocurrency investments carry substantial risk, including potential total loss of capital. Individuals should conduct independent research and consult qualified financial advisors before making investment decisions.
III. XDB CHAIN (XDB) Future Investment Predictions and Price Outlook
Short-term Investment Predictions (2025, Short-term XDB Investment Outlook)
- Conservative Forecast: $0.000186 - $0.000251
- Neutral Forecast: $0.000251 - $0.000301
- Optimistic Forecast: $0.000301 - $0.000351
Mid-term Investment Outlook (2026-2027, Mid-term XDB CHAIN (XDB) Investment Forecast)
-
Market Stage Expectations: Gradual price stabilization with potential for incremental growth as adoption of the platform's consumer digital assets ecosystem develops.
-
Investment Return Predictions:
- 2026: $0.000262 - $0.000376
- 2027: $0.000199 - $0.000404
-
Key Catalysts: Platform expansion in branded token (BCO) adoption, enhanced buyback and burn (BBB) mechanism effectiveness, increased institutional participation in RWA infrastructure development.
Long-term Investment Outlook (Is XDB CHAIN a Good Long-term Investment?)
-
Base Scenario: $0.000260 - $0.000420 USD (Assuming steady ecosystem growth, moderate market adoption of consumer digital assets, and consistent deflationary mechanics through BBB system)
-
Optimistic Scenario: $0.000420 - $0.000561 USD (Assuming accelerated mainstream adoption of branded tokens and NFTs, successful brand partnerships, and favorable market conditions through 2030)
-
Risk Scenario: $0.000186 - $0.000240 USD (Under conditions of limited ecosystem adoption, increased market competition, regulatory headwinds, or broader cryptocurrency market downturns)
View XDB Long-term Investment and Price Predictions: Price Prediction
2025-12-31 to 2030 Long-term Outlook
-
Base Scenario: $0.000260 - $0.000419 USD (Corresponding to steady platform development and gradual mainstream application enhancement)
-
Optimistic Scenario: $0.000420 - $0.000561 USD (Corresponding to large-scale adoption and favorable market environment)
-
Transformative Scenario: $0.000561 USD and above (If ecosystem achieves breakthrough progress and achieves mainstream proliferation)
-
2030-12-31 Predicted High: $0.000561 USD (Based on optimistic development assumptions)
Disclaimer: This analysis is provided for informational purposes only and should not be construed as investment advice. Cryptocurrency markets are highly volatile and unpredictable. Past performance does not guarantee future results. Readers should conduct their own research and consult with qualified financial advisors before making investment decisions. All price predictions carry inherent uncertainty and risk.
| 年份 | 预测最高价 | 预测平均价格 | 预测最低价 | 涨跌幅 |
|---|---|---|---|---|
| 2025 | 0.00030132 | 0.0002511 | 0.000185814 | 0 |
| 2026 | 0.0003756456 | 0.00027621 | 0.0002623995 | 10 |
| 2027 | 0.000404150472 | 0.0003259278 | 0.000198815958 | 29 |
| 2028 | 0.00045994931136 | 0.000365039136 | 0.00030663287424 | 45 |
| 2029 | 0.00042486905039 | 0.00041249422368 | 0.000239246649734 | 64 |
| 2030 | 0.000561033393627 | 0.000418681637035 | 0.000259582614961 | 66 |
XDB CHAIN (XDB) Research Report
I. Executive Summary
XDB is the native token of XDB CHAIN, classified as a Real World Asset (RWA). XDB CHAIN is a protocol-layer blockchain designed to "empower brands and consumers of tomorrow," facilitating fast and affordable transfer of consumer digital assets including branded tokens (BCO), non-fungible tokens (NFTs), and stablecoins. The platform incorporates a deflationary mechanism called Buyback and Burn (BBB) supported by the tokenomics of branded tokens (BCO).
Report Date: December 24, 2025
II. Market Status and Performance Analysis
Current Market Position
| Metric | Value |
|---|---|
| Current Price | $0.0002511 |
| Market Capitalization | $4,283,028.43 |
| Fully Diluted Valuation | $4,712,082.98 |
| Market Ranking | 1,626 |
| Market Dominance | 0.00014% |
| Trading Volume (24H) | $14,149.02 |
Price Performance Metrics
| Time Period | Change Percentage | Price Movement |
|---|---|---|
| 1 Hour | -0.24% | -$0.000000604 |
| 24 Hours | -3.64% | -$0.000009485 |
| 7 Days | -3.39% | -$0.000008811 |
| 30 Days | -25.04% | -$0.000083879 |
| 1 Year | -68.5% | -$0.000546043 |
Historical Price Levels
- All-Time High: $0.850722 (November 22, 2021)
- All-Time Low: $0.00021539 (November 4, 2024)
- 24-Hour High: $0.000265
- 24-Hour Low: $0.0002501
III. Token Economics and Supply Structure
Supply Composition
| Category | Amount |
|---|---|
| Circulating Supply | 17,057,062,634 XDB |
| Total Supply | 18,765,762,572 XDB |
| Maximum Supply | 20,000,000,000 XDB |
| Circulation Ratio | 85.29% |
Token Distribution Insights
- Total Holders: 5,068
- Circulating Supply Percentage: 85.29% of total supply is currently in circulation
- Remaining Potential Dilution: 14.71% of tokens remain unminted
Deflationary Mechanism
XDB CHAIN implements a Buyback and Burn (BBB) system that creates a deflationary pressure on token supply. This mechanism is supported by the tokenomics of branded tokens (BCO), which are primary revenue sources for the protocol. The system aims to reduce token supply over time, potentially supporting long-term price appreciation.
IV. Investment Strategy and Risk Management
Investment Methodology (XDB Investment Strategy)
Long-Term Holding (HODL XDB): Suitable for risk-tolerant investors who believe in the long-term utility and adoption of the XDB CHAIN protocol for brand tokenization and consumer digital asset transfer.
Active Trading: Requires careful technical analysis given the high volatility and low liquidity demonstrated by 24-hour trading volumes of approximately $14,149. Wave trading opportunities exist but carry elevated execution risks.
Risk Management (Risk Management for XDB Investment)
⚠️ Given the current market conditions and token performance, conservative risk management is strongly recommended.
Asset Allocation Guidelines:
- Conservative Investors: XDB should represent no more than 0.1-0.5% of a diversified portfolio due to high risk profile
- Aggressive Investors: Maximum 2-5% allocation, with strict stop-loss implementation
- Professional Investors: Tactical positions with defined entry/exit parameters and hedging strategies
Risk Mitigation Strategies:
- Multi-asset portfolio diversification across established cryptocurrencies and traditional assets
- Utilization of stablecoins for capital preservation during downturns
- Position sizing proportional to risk tolerance
Secure Storage Recommendations:
- Cold wallet Storage: Hardware wallets (Ledger, Trezor) for long-term holding
- Hot Wallet Usage: Only for active trading amounts, with security best practices
- Exchange Risk Minimization: Avoid leaving substantial funds on trading platforms
V. Investment Risks and Challenges
Market Risks
- Extreme Volatility: Token has declined 68.5% over the past year and 25.04% over the past month, indicating severe price instability
- Illiquidity: Daily trading volume of $14,149 is significantly low, creating potential execution challenges for large orders
- Price Recovery Uncertainty: Current price of $0.0002511 represents a 99.97% decline from all-time high, indicating substantial accumulated losses
Regulatory Risks
XDB CHAIN's classification as a real-world asset token may be subject to evolving regulatory frameworks across different jurisdictions. The regulatory status of brand tokenization and consumer digital assets remains uncertain in many markets, creating potential compliance challenges.
Technology Risks
- Smart Contract Security: Any vulnerabilities in the BBB deflationary mechanism or related smart contracts could impact token value
- Adoption Risk: Protocol success depends on significant adoption by brands and consumers for digital asset transfer
- Competitive Risk: Market faces competition from other blockchain platforms offering similar functionality
Liquidity Risk
With only 2 exchange listings and moderate holder distribution (5,068 total holders), liquidity constraints may persist, affecting ability to enter or exit positions efficiently.
VI. Conclusion: Is XDB a Good Investment?
Investment Value Summary
XDB CHAIN operates within the emerging real-world asset (RWA) and brand tokenization segment, which represents a legitimate protocol utility. However, the extreme price depreciation (-68.5% annually, -99.97% from ATH), combined with low trading volume and limited adoption metrics, indicates significant ongoing challenges.
The deflationary BBB mechanism provides theoretical long-term support, but current market conditions and price action suggest the market has not yet validated this mechanism's effectiveness or the protocol's broader value proposition.
Investor Recommendations
✅ For New Investors:
- If considering exposure, implement dollar-cost averaging (DCA) with extremely small position sizes (0.1-0.5% of total crypto allocation)
- Utilize secure cold storage exclusively
- Establish clear risk tolerance limits and stop-loss parameters
✅ For Experienced Investors:
- Consider as high-risk speculative position only, not core portfolio component
- Technical analysis may identify swing trading opportunities, but verify liquidity conditions before execution
- Implement strict position sizing (maximum 2-5% of crypto portfolio) with defined exit rules
✅ For Institutional Investors:
- Research brand partnership pipeline and protocol adoption metrics before any strategic allocation
- Conduct thorough due diligence on smart contract security and regulatory compliance
- Consider as long-tail diversification only
Critical Disclaimer
⚠️ Important Notice: Cryptocurrency investment, particularly in tokens with limited liquidity and extreme historical volatility like XDB, carries substantial risk of total capital loss. This report is for informational purposes only and does not constitute financial advice, investment recommendation, or solicitation to buy or sell XDB or any cryptocurrency.
Investors must:
- Conduct independent research and due diligence
- Consult qualified financial advisors
- Only invest capital they can afford to lose entirely
- Understand and accept the risks outlined in this analysis
Past performance does not guarantee future results. Market conditions, regulatory developments, and technological changes may significantly impact XDB's future prospects.
XDB CHAIN (XDB) Investment Analysis Report - FAQ
FAQ
Q1: What is XDB CHAIN and what problem does it solve?
A: XDB CHAIN is a protocol-layer blockchain designed to empower brands and consumers through fast and affordable transfer of consumer digital assets. It functions as a Real World Asset (RWA) infrastructure supporting branded tokens (BCO), non-fungible tokens (NFTs), and stablecoins. The platform addresses the need for efficient tokenization and transfer of consumer digital assets by implementing a deflationary Buyback and Burn (BBB) mechanism supported by branded token economics.
Q2: What is the current market price and market capitalization of XDB?
A: As of December 24, 2025, XDB is trading at approximately $0.0002511 with a market capitalization of $4,283,028.43 and a fully diluted valuation of $4,712,082.98. The token ranks 1,626 in the cryptocurrency market with a market dominance of 0.00014%, maintained by 5,068 token holders.
Q3: How severe has XDB's price decline been since inception?
A: XDB has experienced extreme price volatility since its launch in September 2019. The token reached an all-time high of $0.850722 in November 2021 but subsequently declined by 99.97% to reach an all-time low of $0.00021539 in November 2024. Over the past 12 months, XDB has declined 68.5%, while the 30-day change shows a -25.04% decline, indicating sustained downward pressure.
Q4: What is the tokenomics structure and supply composition of XDB?
A: XDB has a maximum supply of 20 billion tokens, with 17.06 billion tokens currently in circulation (85.29% of maximum supply). The platform incorporates a deflationary Buyback and Burn (BBB) mechanism designed to reduce token supply over time. With 14.71% of tokens still unminted and 85.29% already circulating, the token is in a mature circulation stage with potential for additional dilution.
Q5: What are the main investment risks associated with XDB?
A: Key investment risks include extreme price volatility (-68.5% annually), extremely low trading volume ($14,149 daily), limited liquidity with only 2 exchange listings, uncertain regulatory status as an RWA token, technology adoption risks, and the token's 99.97% decline from all-time highs. The low market capitalization of $4.28 million indicates a relatively small market with heightened volatility potential.
Q6: What price forecasts do analysts project for XDB through 2030?
A: Analyst consensus indicates diverse scenarios. For 2025, conservative forecasts range from $0.000186-$0.000251, while neutral forecasts predict $0.000251-$0.000301. Long-term projections (2030) range from a base scenario of $0.000260-$0.000419 USD to an optimistic scenario of $0.000420-$0.000561 USD. Risk scenarios project $0.000186-$0.000240 USD under adverse conditions.
Q7: Is XDB suitable for conservative investors?
A: No. XDB is classified as a high-risk investment unsuitable for conservative investors as a core portfolio holding. For conservative investors considering exposure, XDB should represent no more than 0.1-0.5% of a diversified cryptocurrency portfolio. Aggressive investors might allocate maximum 2-5% with strict stop-loss implementation. Only risk capital that investors can afford to lose entirely should be allocated to XDB.
Q8: What infrastructure and development activity supports XDB CHAIN?
A: XDB CHAIN maintains active development infrastructure including multiple GitHub repositories (github.com/DigitalBitsOrg), an operational block explorer (explorer.xdbchain.com), official website (digitalbits.io), and social media presence on Twitter (@DigitalBitsOrg), Reddit, LinkedIn, and Facebook. The project has been operational since September 2019, demonstrating sustained development activity, though current market metrics suggest limited market adoption relative to infrastructure investments.
Disclaimer: This FAQ is provided for informational purposes only and does not constitute investment advice or financial recommendation. Cryptocurrency investments carry substantial risk, including potential total loss of capital. Investors must conduct independent research and consult qualified financial advisors before making investment decisions.
Share
How to Buy Cryptocurrency


Trending Cryptocurrencies


2025 ATR Price Prediction: Bullish Outlook as Adoption and Partnerships Drive Growth

Is Artrade (ATR) a good investment?: Analyzing the potential and risks of this NFT marketplace token

Is Propy (PRO) a good investment?: Analyzing Market Potential, Risk Factors, and Future Growth Prospects in the Real Estate Blockchain Sector

What are AliExpress Coin

RWA on Avalanche (AVAX): How Real-World Assets Come On-Chain

Is Ondo Finance (ONDO) a good investment?: Analyzing the potential and risks of this innovative DeFi protocol
Ethereum Maintains 62% NFT Market Share Despite Growing Competition
CryptoQuant On-Chain Analysis Tools: Bitcoin Market Insights and Whale Tracking for Crypto Traders in 2026

Mist Browser (Ethereum DApp Browser)

Moo Deng (MOODENG) — The Viral Hippo Taking Over Crypto

Bitcoin Options Signal Cautious Optimism in Early 2026, Why Call Buying Is Back
