MMT vs NEAR: Comparing Two Blockchain Platforms for Scalability and Interoperability
Introduction: Investment Comparison of MMT vs NEAR
In the cryptocurrency market, the comparison between Momentum (MMT) vs NEAR (NEAR) has always been a topic that investors cannot avoid. The two not only have significant differences in market cap ranking, application scenarios, and price performance, but also represent different positions in crypto assets.
Momentum (MMT): Since its launch on March 31, 2025, it has gained market recognition for its position as the "Robinhood of the tokenized era".
NEAR (NEAR): Since its inception in October 2020, it has been hailed as a highly scalable base protocol for supporting DApp operations on mobile devices.
This article will comprehensively analyze the investment value comparison between Momentum vs NEAR, focusing on historical price trends, supply mechanisms, institutional adoption, technical ecosystems, and future predictions, and attempt to answer the question that investors care about most:
"Which is the better buy right now?"
I. Price History Comparison and Current Market Status
Momentum (MMT) and NEAR (NEAR) Historical Price Trends
- 2025: MMT launched on March 31, rapidly growing its liquidity to $500M and attracting over 2.1 million users.
- 2022: NEAR reached its all-time high of $20.44 on January 17, 2022.
- Comparative analysis: Since its launch, MMT has shown significant growth, while NEAR has experienced a substantial decline from its all-time high.
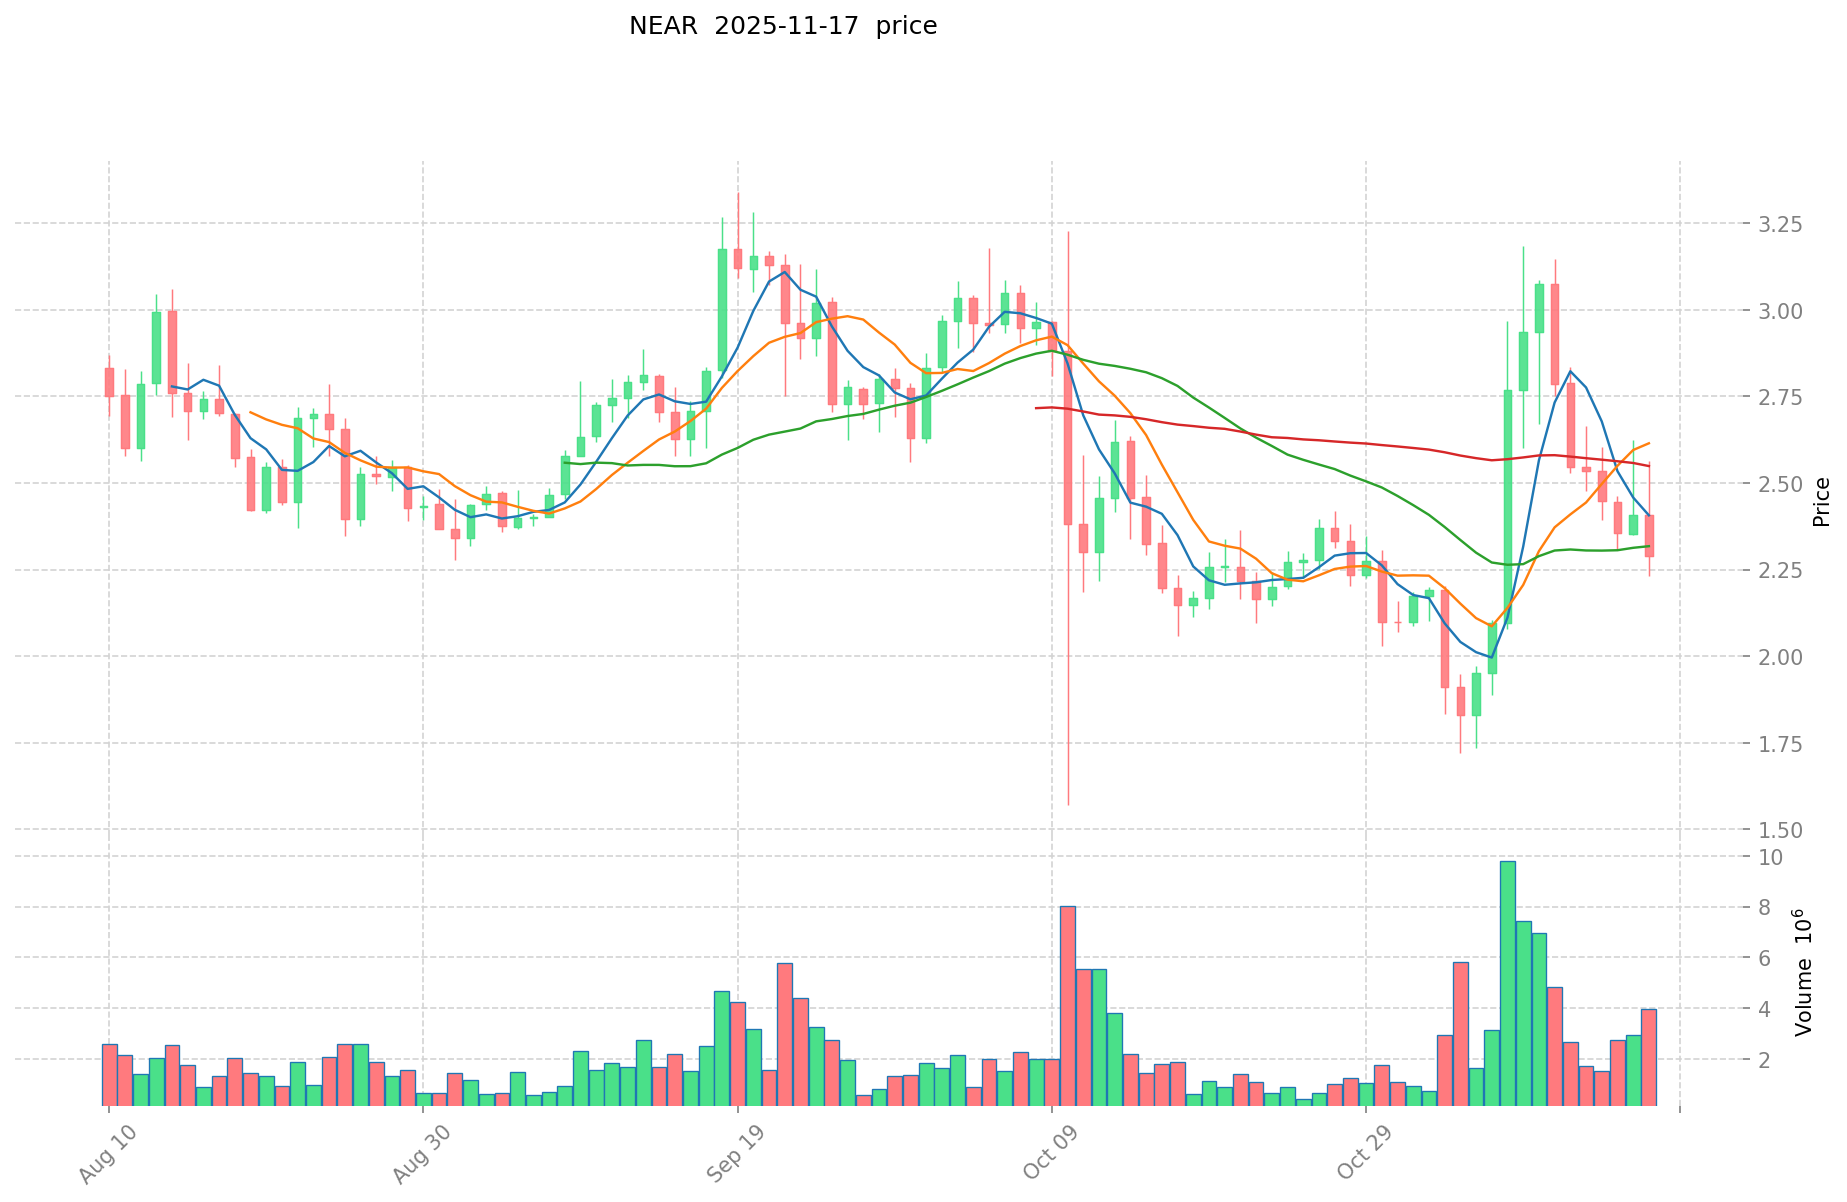
Current Market Situation (2025-11-17)
- MMT current price: $0.3373
- NEAR current price: $2.319
- 24-hour trading volume: MMT $9,651,309.08 vs NEAR $9,571,634.66
- Market Sentiment Index (Fear & Greed Index): 10 (Extreme Fear)
Click to view real-time prices:
- View MMT current price Market Price
- View NEAR current price Market Price

II. Core Factors Affecting the Investment Value of MMT vs NEAR
Supply Mechanisms Comparison (Tokenomics)
- NEAR: NEAR Protocol has an inflationary tokenomics model with a maximum annual issuance rate of 5%, where tokens are distributed to validators as staking rewards. However, as transaction fees are burned, this creates a counterbalance to inflation.
- MMT: Multi-token design with three distinct tokens - Sequencer, Settlement, and Gas tokens. MMT has a deflationary mechanism where gas fees are partially burned, reducing supply over time.
- 📌 Historical pattern: Deflationary models like MMT's tend to create stronger upward price pressure during bull markets, while NEAR's moderate inflation model provides more stability through market cycles.
Institutional Adoption and Market Applications
- Institutional holdings: NEAR has attracted more institutional investment with backing from major venture capital firms and participation in its ecosystem fund.
- Enterprise adoption: NEAR has broader enterprise partnerships and real-world applications, particularly in Web3 infrastructure and gaming. MMT is still developing its enterprise connections but shows potential in the modular blockchain space.
- Regulatory attitudes: Both projects face similar regulatory considerations, though NEAR's longer market presence provides slightly more regulatory clarity for institutional investors.
Technical Development and Ecosystem Building
- NEAR technical upgrades: Implementation of Nightshade sharding for scalability, Fast Finality for quicker transaction confirmation, and Aurora EVM compatibility for Ethereum interoperability.
- MMT technical development: Focus on modular architecture with a high-performance execution layer, cross-chain interoperability, and advanced sequencing technology.
- Ecosystem comparison: NEAR has a more developed ecosystem with established DeFi protocols, NFT marketplaces, and numerous dApps. MMT's ecosystem is newer but growing rapidly with a focus on performance-intensive applications.
Macroeconomic Factors and Market Cycles
- Performance in inflationary environments: NEAR's established infrastructure positioning may provide more stability during inflation, while MMT's deflationary model could theoretically offer better value preservation.
- Macroeconomic monetary policy: Interest rate fluctuations tend to impact both tokens similarly, though newer projects like MMT may face higher volatility during policy shifts.
- Geopolitical factors: Both networks offer censorship-resistant technology, though NEAR's wider global distribution of validators may provide an advantage in terms of geopolitical resilience.
III. 2025-2030 Price Prediction: MMT vs NEAR
Short-term Prediction (2025)
- MMT: Conservative $0.28 - $0.34 | Optimistic $0.34 - $0.48
- NEAR: Conservative $2.13 - $2.32 | Optimistic $2.32 - $2.92
Mid-term Prediction (2027)
- MMT may enter a growth phase, with prices expected in the range of $0.36 - $0.53
- NEAR may enter a consolidation phase, with prices expected in the range of $1.44 - $3.70
- Key drivers: Institutional capital inflow, ETF, ecosystem development
Long-term Prediction (2030)
- MMT: Base scenario $0.47 - $0.68 | Optimistic scenario $0.68 - $1.00
- NEAR: Base scenario $3.42 - $4.22 | Optimistic scenario $4.22 - $5.78
Disclaimer
MMT:
| 年份 | 预测最高价 | 预测平均价格 | 预测最低价 | 涨跌幅 |
|---|---|---|---|---|
| 2025 | 0.477688 | 0.3364 | 0.282576 | 0 |
| 2026 | 0.5495094 | 0.407044 | 0.26050816 | 20 |
| 2027 | 0.52610437 | 0.4782767 | 0.363490292 | 41 |
| 2028 | 0.6628915062 | 0.502190535 | 0.401752428 | 48 |
| 2029 | 0.78643037781 | 0.5825410206 | 0.431080355244 | 72 |
| 2030 | 0.9993491208393 | 0.684485699205 | 0.47229513245145 | 102 |
NEAR:
| 年份 | 预测最高价 | 预测平均价格 | 预测最低价 | 涨跌幅 |
|---|---|---|---|---|
| 2025 | 2.9232 | 2.32 | 2.1344 | 0 |
| 2026 | 2.700248 | 2.6216 | 1.887552 | 13 |
| 2027 | 3.69868436 | 2.660924 | 1.43689896 | 14 |
| 2028 | 4.4199278102 | 3.17980418 | 1.8442864244 | 37 |
| 2029 | 4.635836514022 | 3.7998659951 | 2.735903516472 | 63 |
| 2030 | 5.77845621874857 | 4.217851254561 | 3.41645951619441 | 81 |
IV. Investment Strategy Comparison: MMT vs NEAR
Long-term vs Short-term Investment Strategies
- MMT: Suitable for investors focused on modular blockchain potential and performance-driven applications
- NEAR: Suitable for investors seeking established ecosystems and Web3 infrastructure exposure
Risk Management and Asset Allocation
- Conservative investors: MMT: 30% vs NEAR: 70%
- Aggressive investors: MMT: 60% vs NEAR: 40%
- Hedging tools: Stablecoin allocation, options, cross-token portfolios
V. Potential Risk Comparison
Market Risks
- MMT: Higher volatility due to newer market presence and smaller market cap
- NEAR: Potential market saturation in the Layer 1 space
Technical Risks
- MMT: Scalability challenges, network stability during rapid growth
- NEAR: Validator concentration, potential security vulnerabilities in sharding implementation
Regulatory Risks
- Global regulatory policies may impact both tokens, with NEAR potentially facing less uncertainty due to its longer market presence
VI. Conclusion: Which Is the Better Buy?
📌 Investment Value Summary:
- MMT advantages: Deflationary model, focus on high-performance applications, potential for rapid ecosystem growth
- NEAR advantages: Established ecosystem, broader enterprise adoption, proven scalability solutions
✅ Investment Advice:
- New investors: Consider a balanced approach, leaning towards NEAR for its established presence
- Experienced investors: Explore a higher allocation to MMT for potential growth, while maintaining NEAR exposure
- Institutional investors: Evaluate MMT for long-term potential, while leveraging NEAR's established infrastructure and partnerships
⚠️ Risk Warning: The cryptocurrency market is highly volatile. This article does not constitute investment advice. None
VII. FAQ
Q1: What are the main differences between MMT and NEAR in terms of their technological focus? A: MMT focuses on modular blockchain architecture with a high-performance execution layer and cross-chain interoperability. NEAR, on the other hand, emphasizes scalability through sharding technology, fast finality, and EVM compatibility.
Q2: How do the tokenomics of MMT and NEAR differ? A: MMT has a deflationary model with a multi-token design (Sequencer, Settlement, and Gas tokens) where gas fees are partially burned. NEAR has an inflationary model with a maximum annual issuance rate of 5%, balanced by transaction fee burning.
Q3: Which token has shown better price performance since its launch? A: Since its launch in March 2025, MMT has shown significant growth. NEAR, launched in October 2020, reached its all-time high in January 2022 but has since experienced a substantial decline.
Q4: How do MMT and NEAR compare in terms of institutional adoption? A: NEAR has attracted more institutional investment and has broader enterprise partnerships, particularly in Web3 infrastructure and gaming. MMT is still developing its enterprise connections but shows potential in the modular blockchain space.
Q5: What are the projected price ranges for MMT and NEAR by 2030? A: For MMT, the base scenario projects $0.47 - $0.68, with an optimistic scenario of $0.68 - $1.00. For NEAR, the base scenario projects $3.42 - $4.22, with an optimistic scenario of $4.22 - $5.78.
Q6: How should investors allocate their portfolio between MMT and NEAR? A: Conservative investors might consider allocating 30% to MMT and 70% to NEAR, while aggressive investors might opt for 60% MMT and 40% NEAR. The specific allocation should be based on individual risk tolerance and investment goals.
Q7: What are the main risks associated with investing in MMT and NEAR? A: MMT faces higher volatility due to its newer market presence and smaller market cap, as well as potential scalability challenges. NEAR risks include potential market saturation in the Layer 1 space and validator concentration. Both tokens are subject to regulatory risks, though NEAR may face less uncertainty due to its longer market presence.
Share
Content
Introduction: Investment Comparison of MMT vs NEAR
I. Price History Comparison and Current Market Status
II. Core Factors Affecting the Investment Value of MMT vs NEAR
III. 2025-2030 Price Prediction: MMT vs NEAR
IV. Investment Strategy Comparison: MMT vs NEAR
V. Potential Risk Comparison
VI. Conclusion: Which Is the Better Buy?
VII. FAQ

