REZ vs QNT: Comparing Two Leading Blockchain Interoperability Solutions
Introduction: REZ vs QNT Investment Comparison
In the cryptocurrency market, the comparison between Renzo (REZ) and Quant (QNT) has been an unavoidable topic for investors. The two not only show significant differences in market cap ranking, application scenarios, and price performance, but also represent different positioning in the crypto asset space.
Renzo (REZ): Since its launch, it has gained market recognition as a Liquid Restaking Token (LRT) and Strategy Manager for EigenLayer.
Quant (QNT): Introduced in 2018, it has been hailed as a technology provider enabling trusted digital interaction, recognized for solving interoperability through its global blockchain operating system, Overledger.
This article will comprehensively analyze the investment value comparison between REZ and QNT, focusing on historical price trends, supply mechanisms, institutional adoption, technological ecosystems, and future predictions, attempting to answer the question investors care about most:
"Which is the better buy right now?"
I. Price History Comparison and Current Market Status
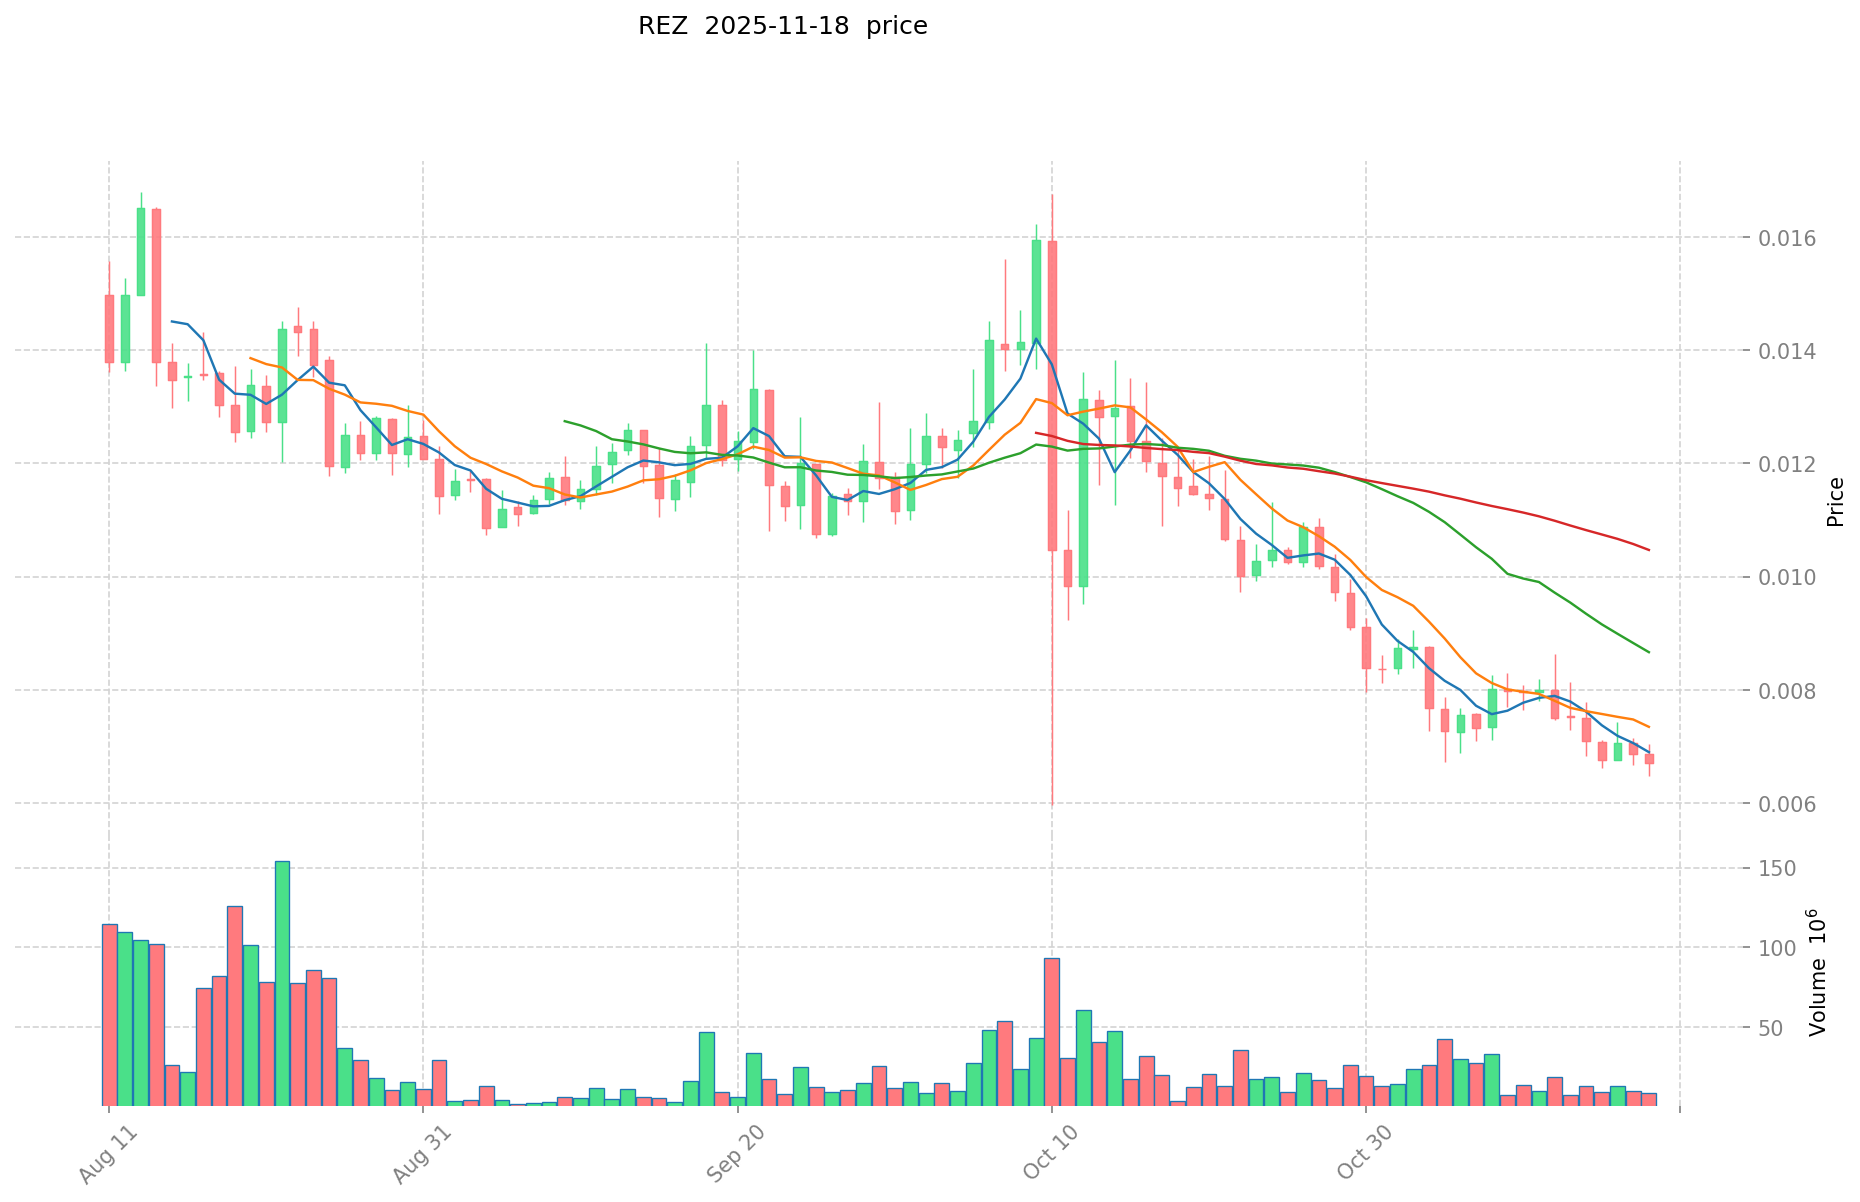
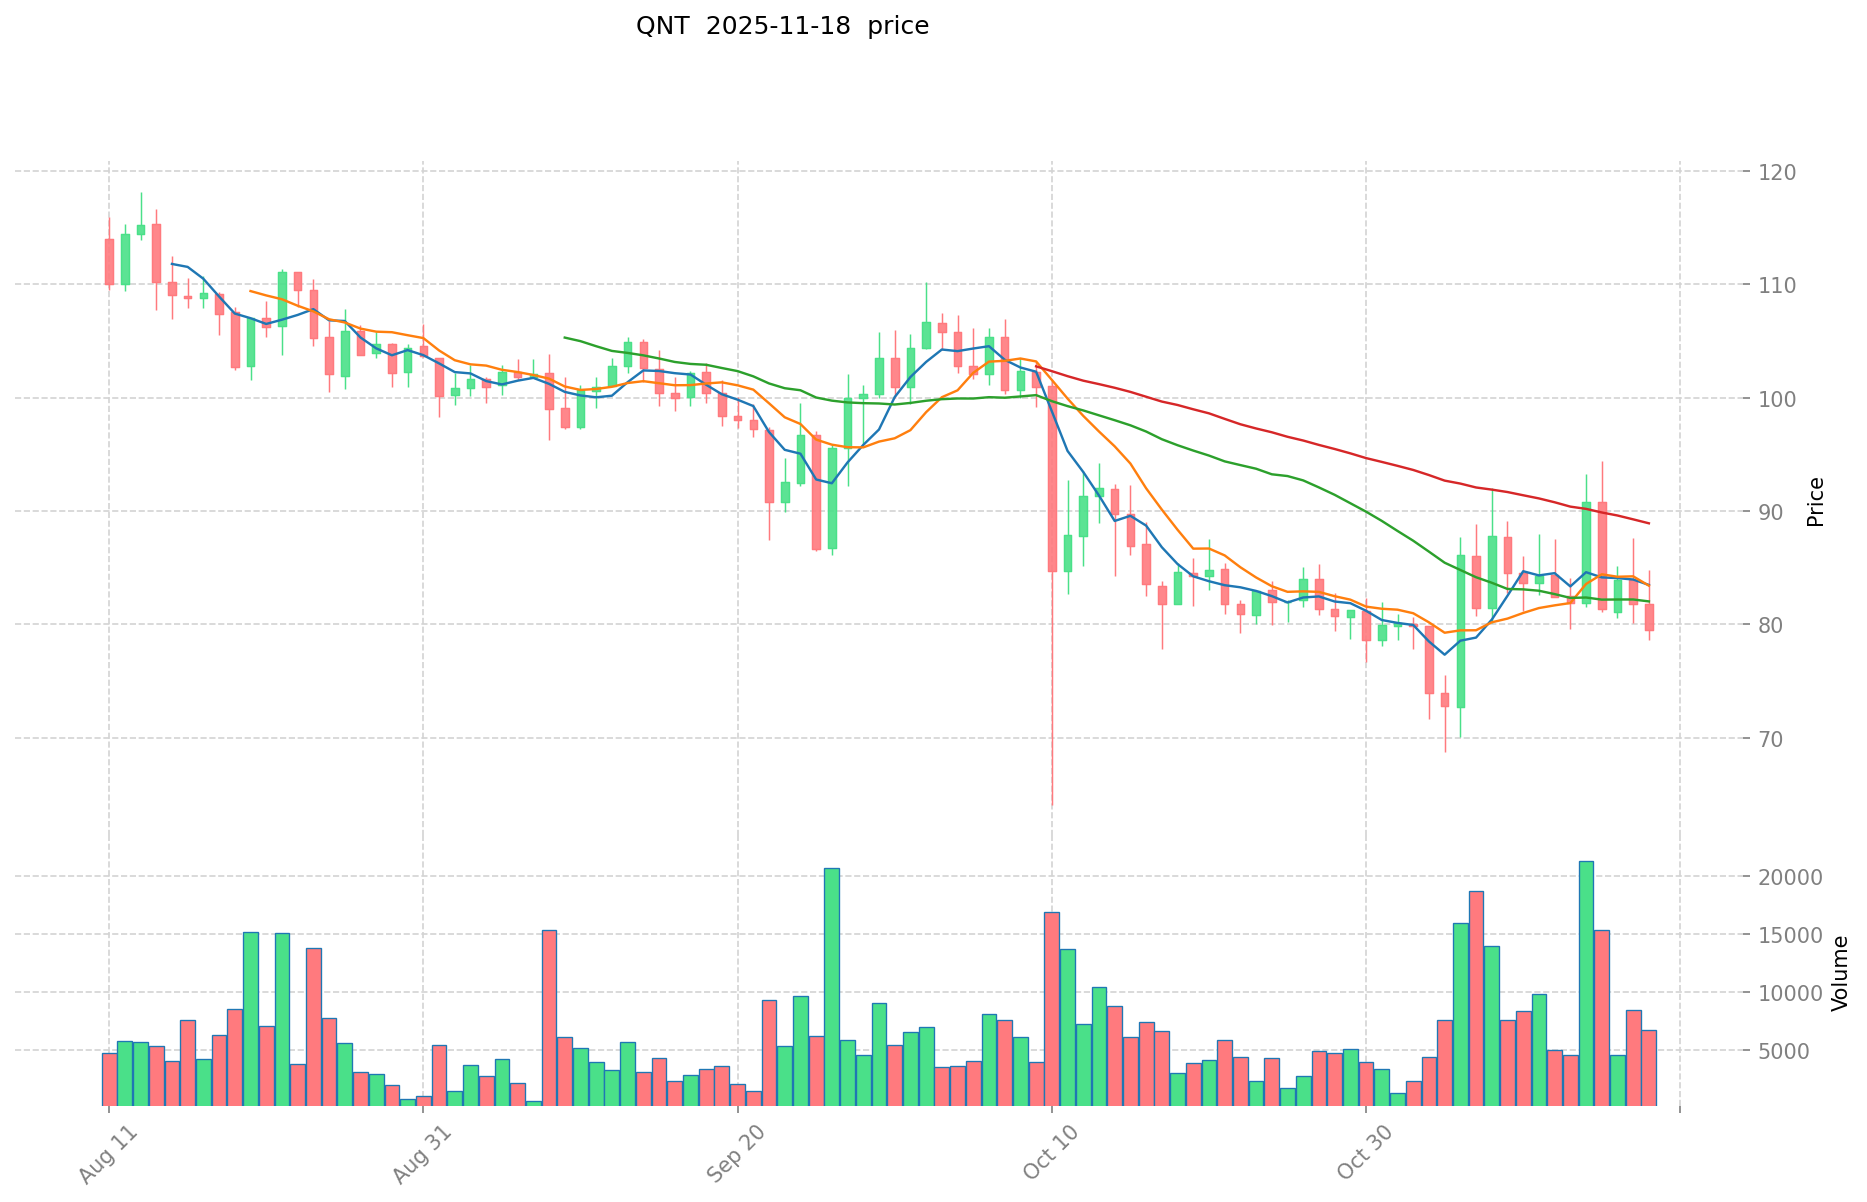
REZ (Coin A) and QNT (Coin B) Historical Price Trends
- 2024: REZ launched as a Liquid Restaking Token for EigenLayer, price fluctuated due to initial market interest.
- 2021: QNT reached its all-time high of $427.42 in September, likely due to increased adoption of its blockchain interoperability solutions.
- Comparative analysis: In the recent market cycle, REZ dropped from its high of $0.265 to a low of $0.005953, while QNT declined from its peak but has maintained a higher price level relative to its launch price.
Current Market Situation (2025-11-19)
- REZ current price: $0.00709
- QNT current price: $80.36
- 24-hour trading volume: REZ $42,780.71 vs QNT $442,017.35
- Market Sentiment Index (Fear & Greed Index): 11 (Extreme Fear)
Click to view real-time prices:
- Check REZ current price Market Price
- Check QNT current price Market Price
II. Core Factors Affecting REZ vs QNT Investment Value
Supply Mechanism Comparison (Tokenomics)
- REZ: Limited supply model affecting long-term scarcity
- QNT: Deflationary mechanism with token utility focus
- 📌 Historical pattern: Supply constraints in both assets have typically led to price appreciation during periods of increasing adoption
Institutional Adoption and Market Applications
- Institutional holdings: QNT has attracted more enterprise interest through its utility in interoperability
- Enterprise adoption: QNT shows stronger positioning in cross-border payments and settlements through Overledger system
- Regulatory stance: Both assets facing evolving regulatory frameworks across jurisdictions
Technological Development and Ecosystem Building
- REZ technological advances: Focus on network efficiency and scalability
- QNT technological development: Interoperability solutions connecting disparate networks
- Ecosystem comparison: QNT demonstrates more established enterprise connections while REZ focuses on broader DeFi applications
Macroeconomic Factors and Market Cycles
- Inflation environment performance: Both assets positioned as alternative stores of value
- Monetary policy impacts: Interest rate changes affect investment flows to both cryptocurrencies
- Geopolitical factors: Cross-border transaction needs potentially benefit QNT's interoperability focus
III. 2025-2030 Price Prediction: REZ vs QNT
Short-term Prediction (2025)
- REZ: Conservative $0.00649888 - $0.007064 | Optimistic $0.007064 - $0.0098896
- QNT: Conservative $69.8088 - $80.24 | Optimistic $80.24 - $85.8568
Mid-term Prediction (2027)
- REZ may enter a growth phase, with projected prices of $0.00491951088 - $0.00983902176
- QNT may enter a consolidation phase, with projected prices of $59.57892216 - $95.50150758
- Key drivers: Institutional inflows, ETFs, ecosystem development
Long-term Prediction (2030)
- REZ: Base scenario $0.013106092140648 - $0.0182174680755 | Optimistic scenario $0.0182174680755+
- QNT: Base scenario $69.062562470135025 - $125.5682954002455 | Optimistic scenario $125.5682954002455 - $140.63649084827496
Disclaimer: This analysis is for informational purposes only and should not be considered as financial advice. Cryptocurrency markets are highly volatile and unpredictable. Always conduct your own research before making any investment decisions.
REZ:
| 年份 | 预测最高价 | 预测平均价格 | 预测最低价 | 涨跌幅 |
|---|---|---|---|---|
| 2025 | 0.0098896 | 0.007064 | 0.00649888 | 0 |
| 2026 | 0.010087392 | 0.0084768 | 0.006866208 | 19 |
| 2027 | 0.00983902176 | 0.009282096 | 0.00491951088 | 30 |
| 2028 | 0.0140540215536 | 0.00956055888 | 0.008604502992 | 34 |
| 2029 | 0.014404894064496 | 0.0118072902168 | 0.009209686369104 | 66 |
| 2030 | 0.0182174680755 | 0.013106092140648 | 0.007863655284388 | 84 |
QNT:
| 年份 | 预测最高价 | 预测平均价格 | 预测最低价 | 涨跌幅 |
|---|---|---|---|---|
| 2025 | 85.8568 | 80.24 | 69.8088 | 0 |
| 2026 | 92.183724 | 83.0484 | 69.760656 | 3 |
| 2027 | 95.50150758 | 87.616062 | 59.57892216 | 9 |
| 2028 | 112.6173052917 | 91.55878479 | 61.3443858093 | 13 |
| 2029 | 149.048545759641 | 102.08804504085 | 95.962762338399 | 27 |
| 2030 | 140.63649084827496 | 125.5682954002455 | 69.062562470135025 | 56 |
IV. Investment Strategy Comparison: REZ vs QNT
Long-term vs Short-term Investment Strategies
- REZ: Suitable for investors focused on DeFi ecosystems and liquid staking potential
- QNT: Suitable for investors seeking enterprise blockchain adoption and interoperability solutions
Risk Management and Asset Allocation
- Conservative investors: REZ: 20% vs QNT: 80%
- Aggressive investors: REZ: 40% vs QNT: 60%
- Hedging tools: Stablecoin allocation, options, cross-currency portfolios
V. Potential Risk Comparison
Market Risks
- REZ: Higher volatility due to lower market cap and newer market presence
- QNT: Potential overvaluation risks based on enterprise adoption expectations
Technical Risks
- REZ: Scalability, network stability
- QNT: Centralization concerns, potential security vulnerabilities
Regulatory Risks
- Global regulatory policies may impact both assets differently, with QNT potentially facing more scrutiny due to its enterprise focus
VI. Conclusion: Which Is the Better Buy?
📌 Investment Value Summary:
- REZ advantages: Potential for high growth in DeFi and liquid staking markets
- QNT advantages: Established enterprise connections and interoperability solutions
✅ Investment Advice:
- New investors: Consider a small allocation to QNT as part of a diversified portfolio
- Experienced investors: Balanced approach with both REZ and QNT, adjusting based on risk tolerance
- Institutional investors: Focus on QNT for its enterprise blockchain solutions, while monitoring REZ for potential DeFi growth
⚠️ Risk Warning: Cryptocurrency markets are highly volatile. This article does not constitute investment advice. None
VII. FAQ
Q1: What are the main differences between REZ and QNT? A: REZ is a Liquid Restaking Token for EigenLayer, focusing on DeFi applications, while QNT is a blockchain interoperability solution provider with a focus on enterprise adoption. REZ has a lower market cap and is newer to the market, while QNT has been around since 2018 and has established enterprise connections.
Q2: Which coin has shown better price performance historically? A: QNT has shown better historical price performance. It reached an all-time high of $427.42 in September 2021 and has maintained a higher price level relative to its launch price. REZ, being newer, has experienced more volatility and currently trades at a much lower price point.
Q3: How do the supply mechanisms of REZ and QNT compare? A: REZ operates on a limited supply model, which could affect long-term scarcity. QNT, on the other hand, has a deflationary mechanism with a focus on token utility. Both supply constraints have historically led to price appreciation during periods of increasing adoption.
Q4: What are the key factors affecting the investment value of REZ and QNT? A: Key factors include supply mechanisms, institutional adoption, technological development, ecosystem building, macroeconomic factors, and market cycles. QNT has shown stronger institutional adoption and enterprise applications, while REZ focuses more on broader DeFi applications.
Q5: What are the projected prices for REZ and QNT in 2030? A: For REZ, the base scenario projects prices between $0.013106092140648 and $0.0182174680755, with an optimistic scenario above $0.0182174680755. For QNT, the base scenario projects prices between $69.062562470135025 and $125.5682954002455, with an optimistic scenario between $125.5682954002455 and $140.63649084827496.
Q6: How should investors allocate their portfolio between REZ and QNT? A: Conservative investors might consider allocating 20% to REZ and 80% to QNT, while more aggressive investors could opt for 40% REZ and 60% QNT. However, individual allocation should be based on personal risk tolerance and investment goals.
Q7: What are the main risks associated with investing in REZ and QNT? A: For REZ, risks include higher volatility due to lower market cap, scalability issues, and network stability concerns. For QNT, risks include potential overvaluation based on enterprise adoption expectations, centralization concerns, and potential security vulnerabilities. Both face regulatory risks, with QNT potentially facing more scrutiny due to its enterprise focus.
Share
Content
Introduction: REZ vs QNT Investment Comparison
I. Price History Comparison and Current Market Status
II. Core Factors Affecting REZ vs QNT Investment Value
III. 2025-2030 Price Prediction: REZ vs QNT
IV. Investment Strategy Comparison: REZ vs QNT
V. Potential Risk Comparison
VI. Conclusion: Which Is the Better Buy?
VII. FAQ

