RSS3 vs DYDX: The Battle for Decentralized Data Governance in Web3
Introduction: RSS3 vs DYDX Investment Comparison
In the cryptocurrency market, the comparison between RSS3 vs DYDX has been an unavoidable topic for investors. The two not only show significant differences in market cap ranking, application scenarios, and price performance but also represent different positioning in the crypto asset space.
RSS3 (RSS3): Since its launch in 2021, it has gained market recognition for its role as a decentralized content and social protocol supporting efficient information distribution.
DYDX (DYDX): Introduced in 2021, it has been hailed as a decentralized derivatives trading protocol, becoming one of the leading platforms for decentralized perpetual contract trading.
This article will comprehensively analyze the investment value comparison between RSS3 and DYDX, focusing on historical price trends, supply mechanisms, institutional adoption, technological ecosystems, and future predictions, attempting to answer the question most important to investors:
"Which is the better buy right now?"
I. Price History Comparison and Current Market Status
RSS3 (Coin A) and DYDX (Coin B) Historical Price Trends
- 2022: RSS3 reached its all-time high of $0.687355 on February 15, 2022.
- 2024: DYDX hit its all-time high of $4.52 on March 8, 2024.
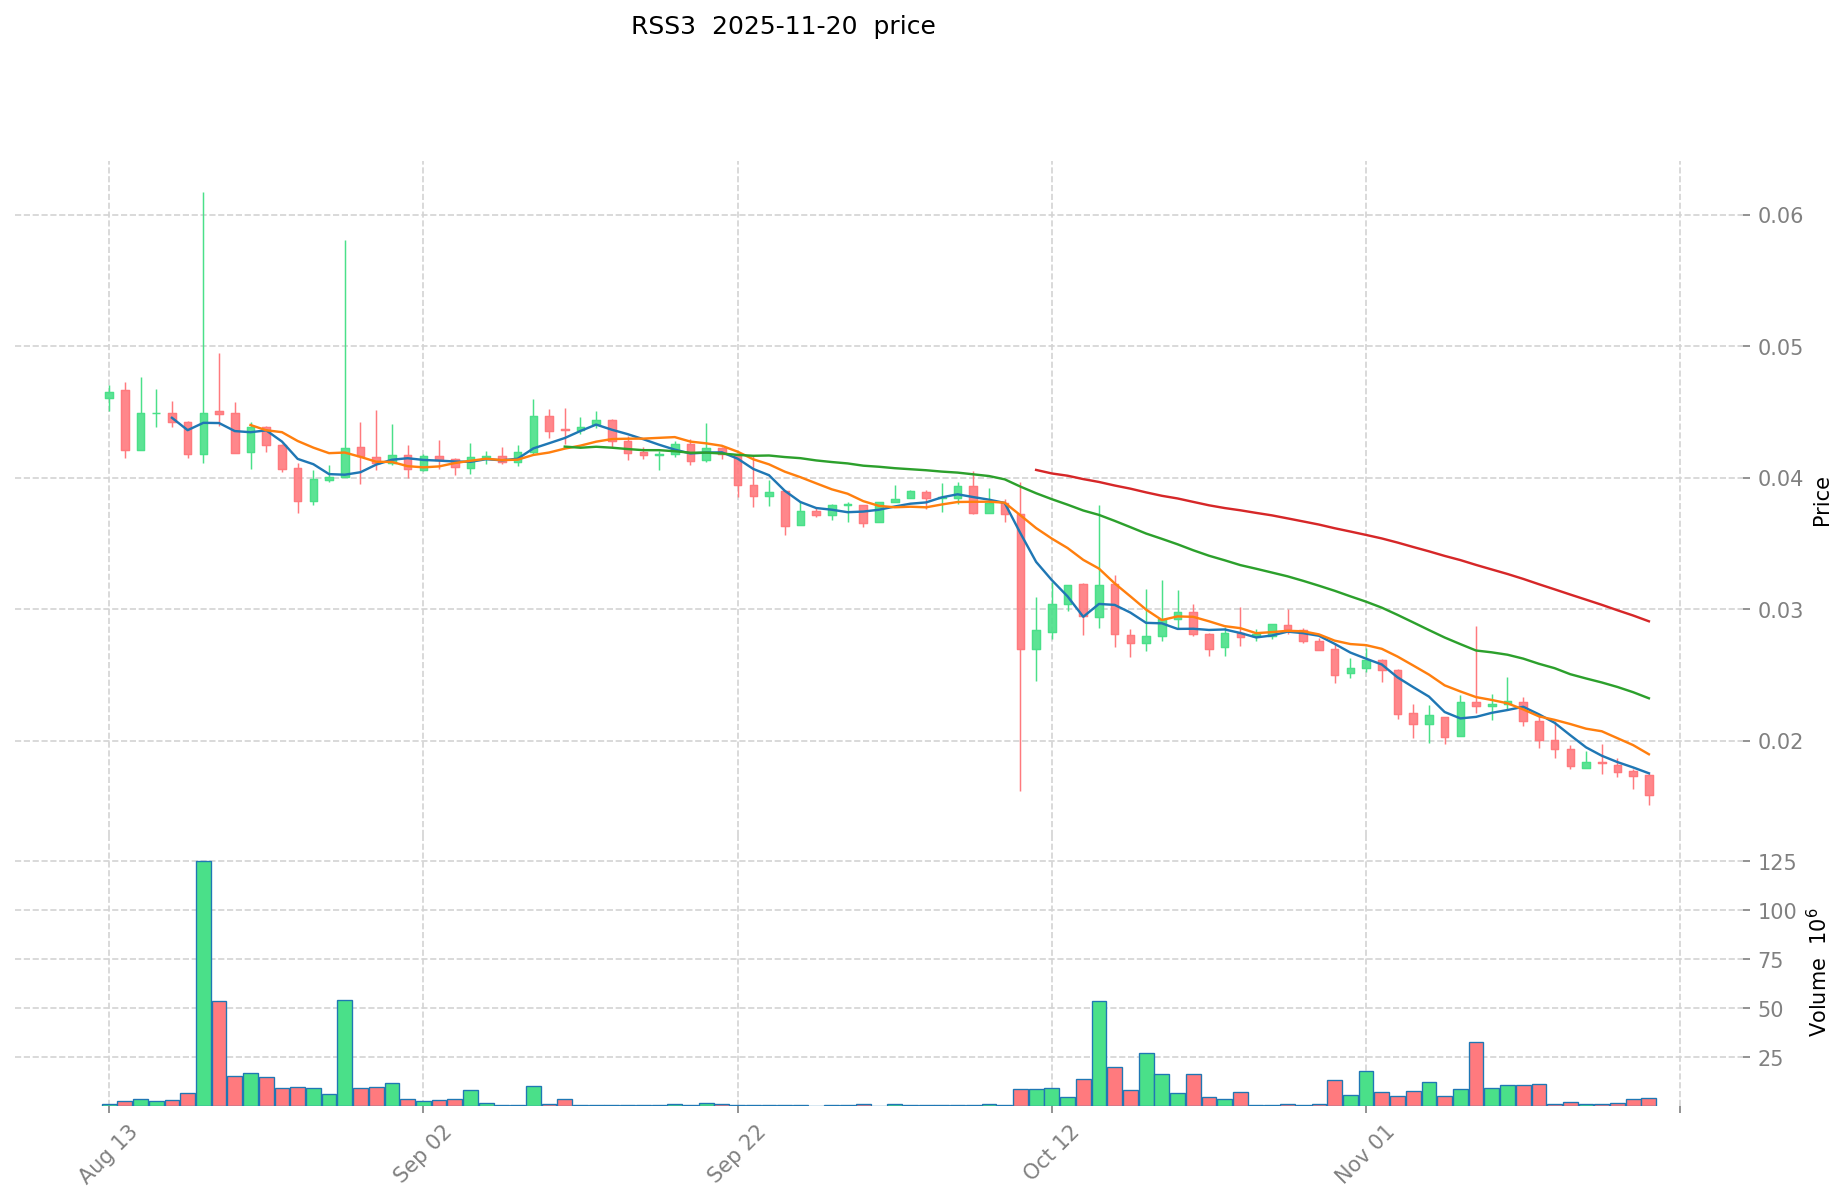
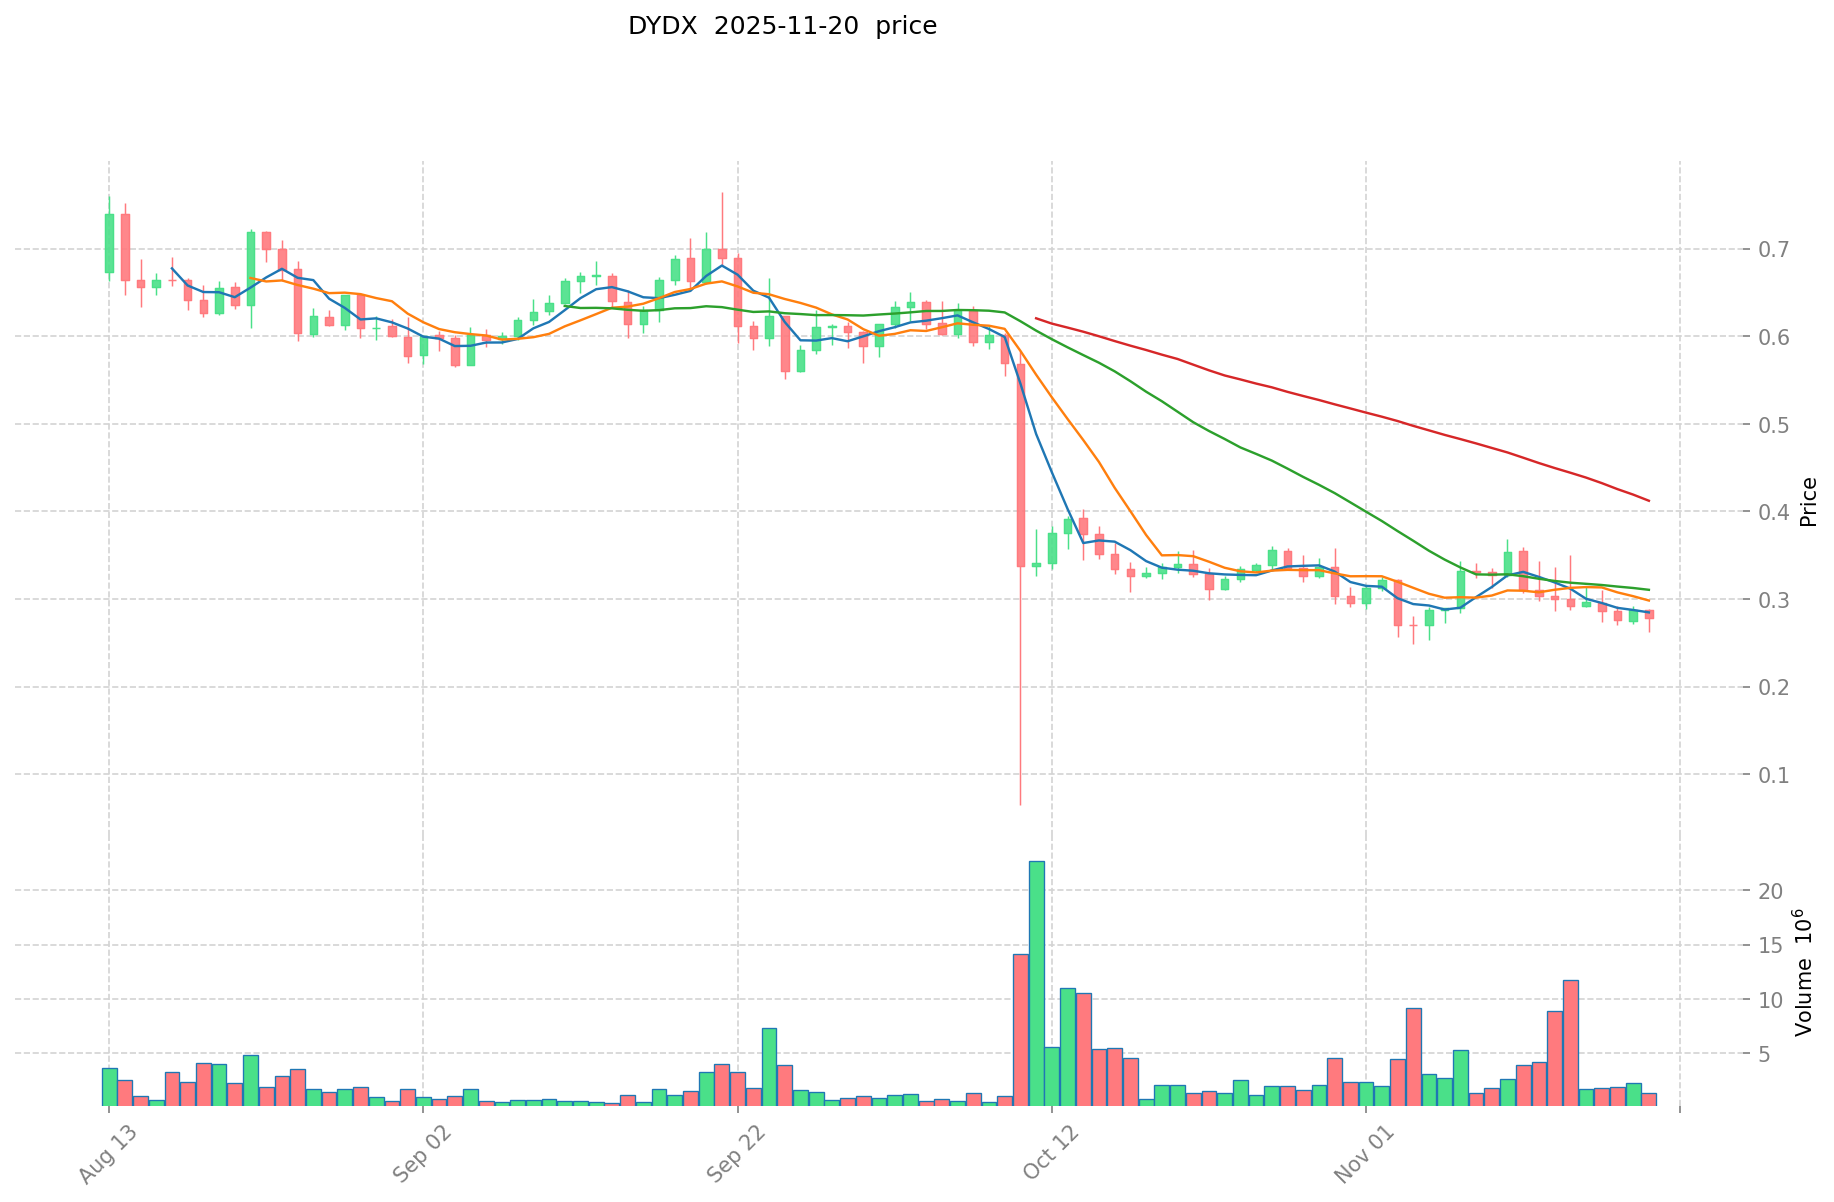
- Comparative analysis: In the current market cycle, RSS3 has dropped from its high of $0.687355 to a low of $0.01534555, while DYDX has fallen from $4.52 to a low of $0.126201.
Current Market Situation (2025-11-20)
- RSS3 current price: $0.01733
- DYDX current price: $0.2889
- 24-hour trading volume: RSS3 $187,943.19 vs DYDX $394,294.81
- Market Sentiment Index (Fear & Greed Index): 11 (Extreme Fear)
Click to view real-time prices:
- View RSS3 current price Market Price
- View DYDX current price Market Price
II. Core Factors Affecting Investment Value of RSS3 vs DYDX
Supply Mechanism Comparison (Tokenomics)
- RSS3: Total supply of 1 billion tokens with emission schedules designed to encourage long-term network growth. 28% of tokens allocated to core contributors with 4-year vesting.
- DYDX: Total supply of 1 billion tokens with trading rewards and liquidity provider incentives. Multi-year emission schedule with approximately 50% of supply distributed to the community.
- 📌 Historical pattern: Limited token supply with strategic emission schedules has typically supported price stability during market volatility periods for both projects.
Institutional Adoption and Market Applications
- Institutional holdings: DYDX has gained more institutional traction given its established position in the decentralized derivatives trading sector.
- Enterprise adoption: RSS3's data indexing infrastructure has potential for broad enterprise applications across Web3, while DYDX offers sophisticated financial products for professional traders and institutions.
- Regulatory stance: Both face uncertain regulatory environments, with DYDX potentially facing greater scrutiny due to its derivatives trading focus.
Technical Development and Ecosystem Building
- RSS3 technical upgrades: Development of RSS3 Network with Rabbit, Ruby, and Revery layers providing comprehensive Web3 data infrastructure solutions.
- DYDX technical development: Migration to a standalone blockchain built on Cosmos SDK, enabling cross-margin trading and reduced gas fees.
- Ecosystem comparison: DYDX has a more established DeFi presence with over $1 billion in TVL and strong derivatives trading volume, while RSS3 is building a broader data network infrastructure for various Web3 applications.
Macroeconomic Factors and Market Cycles
- Performance during inflation: Both tokens have limited historical data for comprehensive inflation resistance analysis.
- Macroeconomic policy effects: Interest rate changes and dollar strength affect both tokens similarly to broader crypto markets.
- Geopolitical factors: DYDX's decentralized trading platform may benefit from increased cross-border transaction demands during geopolitical uncertainty.
III. 2025-2030 Price Prediction: RSS3 vs DYDX
Short-term Prediction (2025)
- RSS3: Conservative $0.0161 - $0.0171 | Optimistic $0.0171 - $0.0207
- DYDX: Conservative $0.2611 - $0.2901 | Optimistic $0.2901 - $0.3858
Mid-term Prediction (2027)
- RSS3 may enter a growth phase, with expected price range of $0.0128 - $0.0248
- DYDX may enter a consolidation phase, with expected price range of $0.2959 - $0.4595
- Key drivers: Institutional capital inflow, ETF, ecosystem development
Long-term Prediction (2030)
- RSS3: Base scenario $0.0297 - $0.0383 | Optimistic scenario $0.0383 - $0.0400
- DYDX: Base scenario $0.5551 - $0.6995 | Optimistic scenario $0.6995 - $0.7500
Disclaimer
RSS3:
| 年份 | 预测最高价 | 预测平均价格 | 预测最低价 | 涨跌幅 |
|---|---|---|---|---|
| 2025 | 0.0207394 | 0.01714 | 0.0161116 | -1 |
| 2026 | 0.026894374 | 0.0189397 | 0.014204775 | 9 |
| 2027 | 0.02475039996 | 0.022917037 | 0.01283354072 | 32 |
| 2028 | 0.0247870672192 | 0.02383371848 | 0.0173986144904 | 37 |
| 2029 | 0.035006965703424 | 0.0243103928496 | 0.014829339638256 | 40 |
| 2030 | 0.0382596962667 | 0.029658679276512 | 0.016608860394846 | 71 |
DYDX:
| 年份 | 预测最高价 | 预测平均价格 | 预测最低价 | 涨跌幅 |
|---|---|---|---|---|
| 2025 | 0.385833 | 0.2901 | 0.26109 | 0 |
| 2026 | 0.35824449 | 0.3379665 | 0.172362915 | 16 |
| 2027 | 0.4594992534 | 0.348105495 | 0.29588967075 | 20 |
| 2028 | 0.541095181428 | 0.4038023742 | 0.387650279232 | 39 |
| 2029 | 0.6378058500489 | 0.472448777814 | 0.34016312002608 | 63 |
| 2030 | 0.699460415553627 | 0.55512731393145 | 0.488512036259676 | 92 |
IV. Investment Strategy Comparison: RSS3 vs DYDX
Long-term vs Short-term Investment Strategy
- RSS3: Suitable for investors focused on Web3 infrastructure potential and data ecosystem growth
- DYDX: Suitable for investors interested in decentralized derivatives trading and DeFi market expansion
Risk Management and Asset Allocation
- Conservative investors: RSS3: 30% vs DYDX: 70%
- Aggressive investors: RSS3: 60% vs DYDX: 40%
- Hedging tools: Stablecoin allocation, options, cross-currency portfolios
V. Potential Risk Comparison
Market Risk
- RSS3: Limited trading volume and potential price volatility
- DYDX: Exposure to derivatives market fluctuations and liquidity risks
Technical Risk
- RSS3: Scalability, network stability
- DYDX: Smart contract vulnerabilities, oracle reliability
Regulatory Risk
- Global regulatory policies may impact both tokens differently, with DYDX potentially facing more scrutiny due to its derivatives trading focus
VI. Conclusion: Which Is the Better Buy?
📌 Investment Value Summary:
- RSS3 advantages: Broad Web3 data infrastructure potential, ecosystem growth opportunities
- DYDX advantages: Established position in decentralized derivatives trading, strong trading volume
✅ Investment Advice:
- New investors: Consider a balanced approach with a slight preference for DYDX due to its more established market presence
- Experienced investors: Explore strategic allocation to both tokens based on risk tolerance and belief in respective ecosystems
- Institutional investors: Conduct thorough due diligence on both projects, with potential focus on DYDX for its institutional-grade offerings
⚠️ Risk Warning: The cryptocurrency market is highly volatile, and this article does not constitute investment advice. None
VII. FAQ
Q1: What are the main differences between RSS3 and DYDX? A: RSS3 is a decentralized content and social protocol supporting efficient information distribution, while DYDX is a decentralized derivatives trading protocol. RSS3 focuses on Web3 data infrastructure, whereas DYDX specializes in decentralized perpetual contract trading.
Q2: Which token has performed better historically? A: DYDX has shown stronger historical performance, reaching its all-time high of $4.52 on March 8, 2024, compared to RSS3's all-time high of $0.687355 on February 15, 2022.
Q3: How do their supply mechanisms differ? A: Both have a total supply of 1 billion tokens. RSS3 allocates 28% to core contributors with 4-year vesting, while DYDX distributes approximately 50% of supply to the community through trading rewards and liquidity provider incentives.
Q4: Which token has greater institutional adoption? A: DYDX has gained more institutional traction due to its established position in the decentralized derivatives trading sector.
Q5: What are the key technical developments for each project? A: RSS3 is developing the RSS3 Network with Rabbit, Ruby, and Revery layers for Web3 data infrastructure. DYDX is migrating to a standalone blockchain built on Cosmos SDK, enabling cross-margin trading and reduced gas fees.
Q6: What are the predicted price ranges for RSS3 and DYDX in 2030? A: For RSS3, the base scenario is $0.0297 - $0.0383, with an optimistic scenario of $0.0383 - $0.0400. For DYDX, the base scenario is $0.5551 - $0.6995, with an optimistic scenario of $0.6995 - $0.7500.
Q7: How should investors allocate their assets between RSS3 and DYDX? A: Conservative investors might consider allocating 30% to RSS3 and 70% to DYDX, while aggressive investors might allocate 60% to RSS3 and 40% to DYDX. However, individual allocations should be based on personal risk tolerance and investment goals.
Share
Content
Introduction: RSS3 vs DYDX Investment Comparison
I. Price History Comparison and Current Market Status
II. Core Factors Affecting Investment Value of RSS3 vs DYDX
III. 2025-2030 Price Prediction: RSS3 vs DYDX
IV. Investment Strategy Comparison: RSS3 vs DYDX
V. Potential Risk Comparison
VI. Conclusion: Which Is the Better Buy?
VII. FAQ

