WNXM vs XTZ: Comparing Two Promising Blockchain Projects in the DeFi Space
Introduction: WNXM vs XTZ Investment Comparison
In the cryptocurrency market, the comparison between WNXM vs XTZ has always been a topic that investors cannot avoid. The two not only show significant differences in market cap ranking, application scenarios, and price performance, but also represent different cryptocurrency asset positioning.
WNXM (WNXM): Since its launch, it has gained market recognition for its risk-sharing model in the decentralized insurance space.
Tezos (XTZ): Since its inception in 2017, it has been hailed as a "self-amending crypto-ledger," and is one of the cryptocurrencies with a significant global trading volume and market capitalization.
This article will comprehensively analyze the investment value comparison between WNXM vs XTZ, focusing on historical price trends, supply mechanisms, institutional adoption, technological ecosystems, and future predictions, attempting to answer the question that investors are most concerned about:
"Which is the better buy right now?"
I. Price History Comparison and Current Market Status
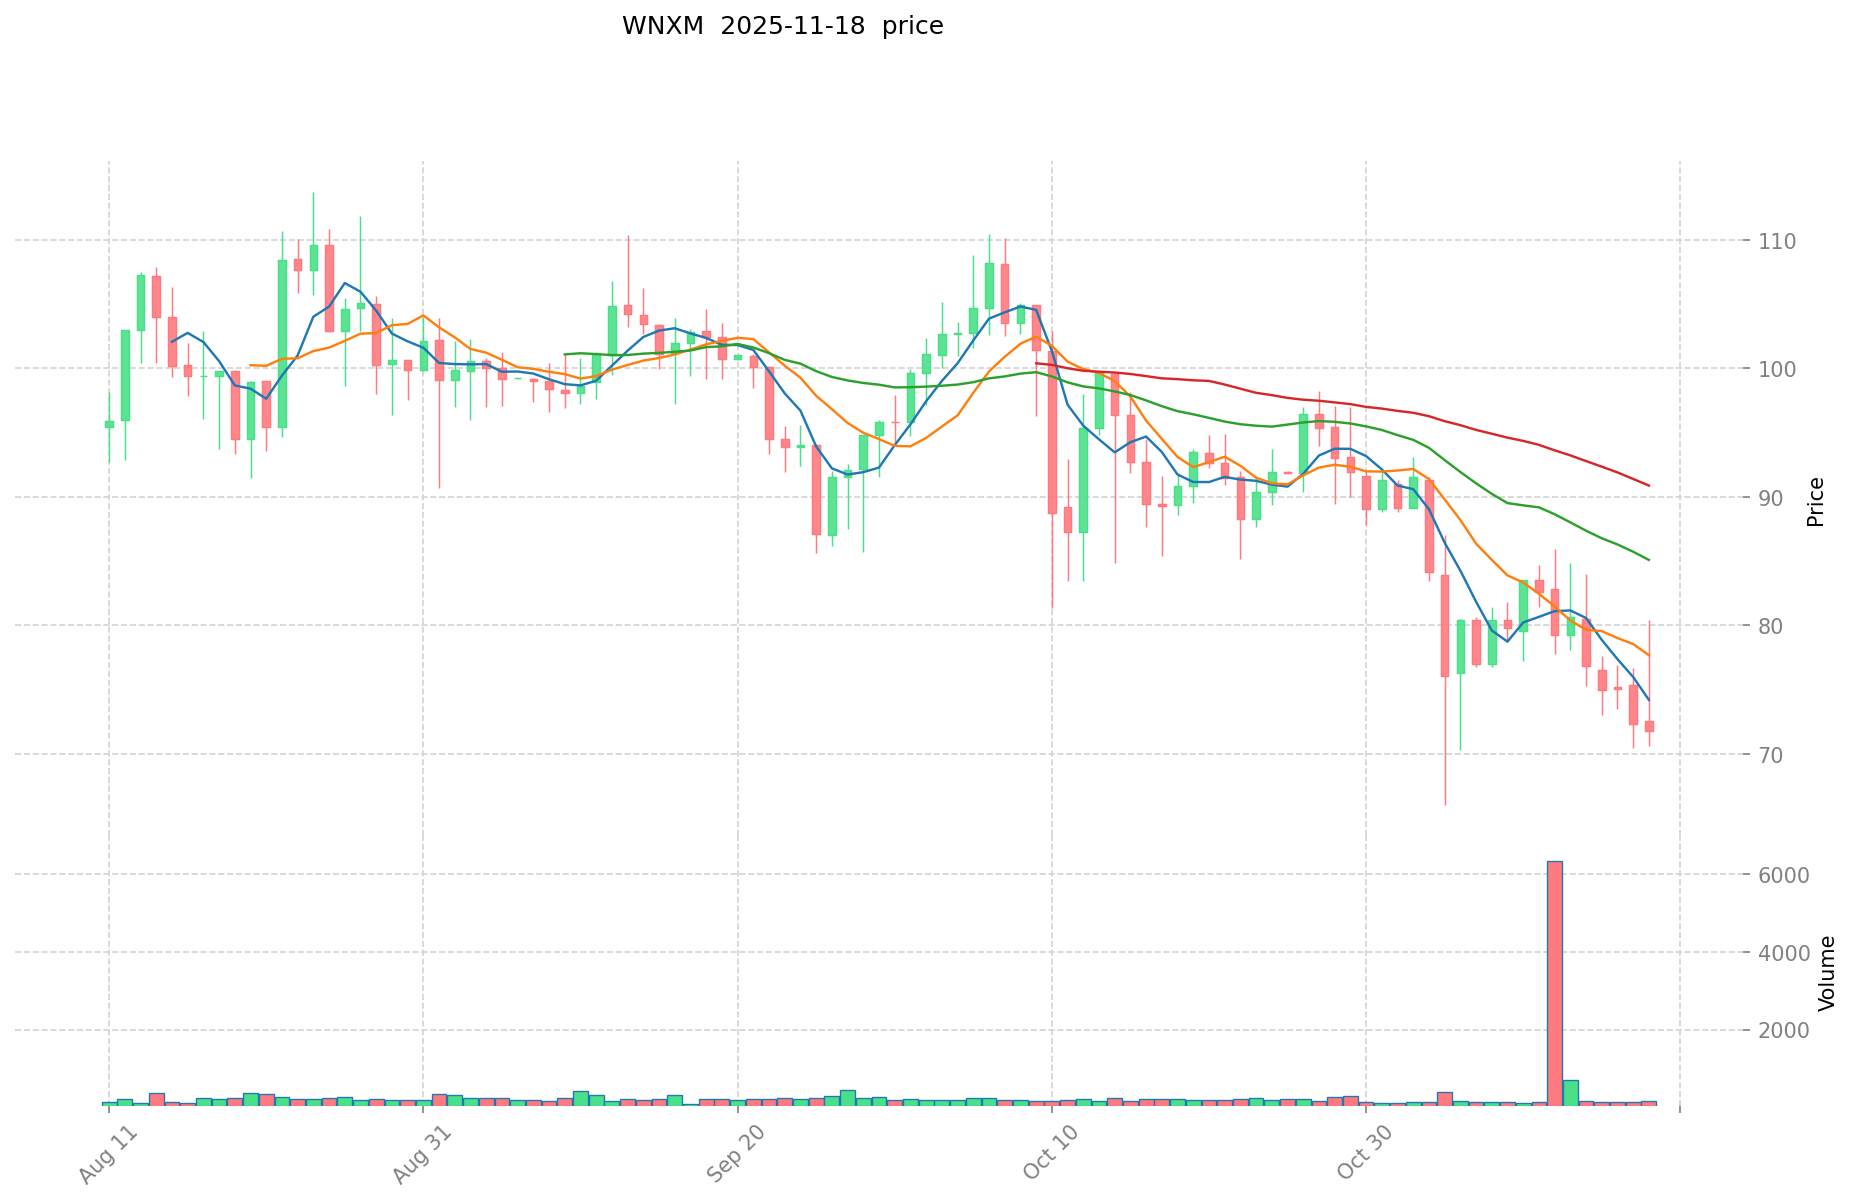
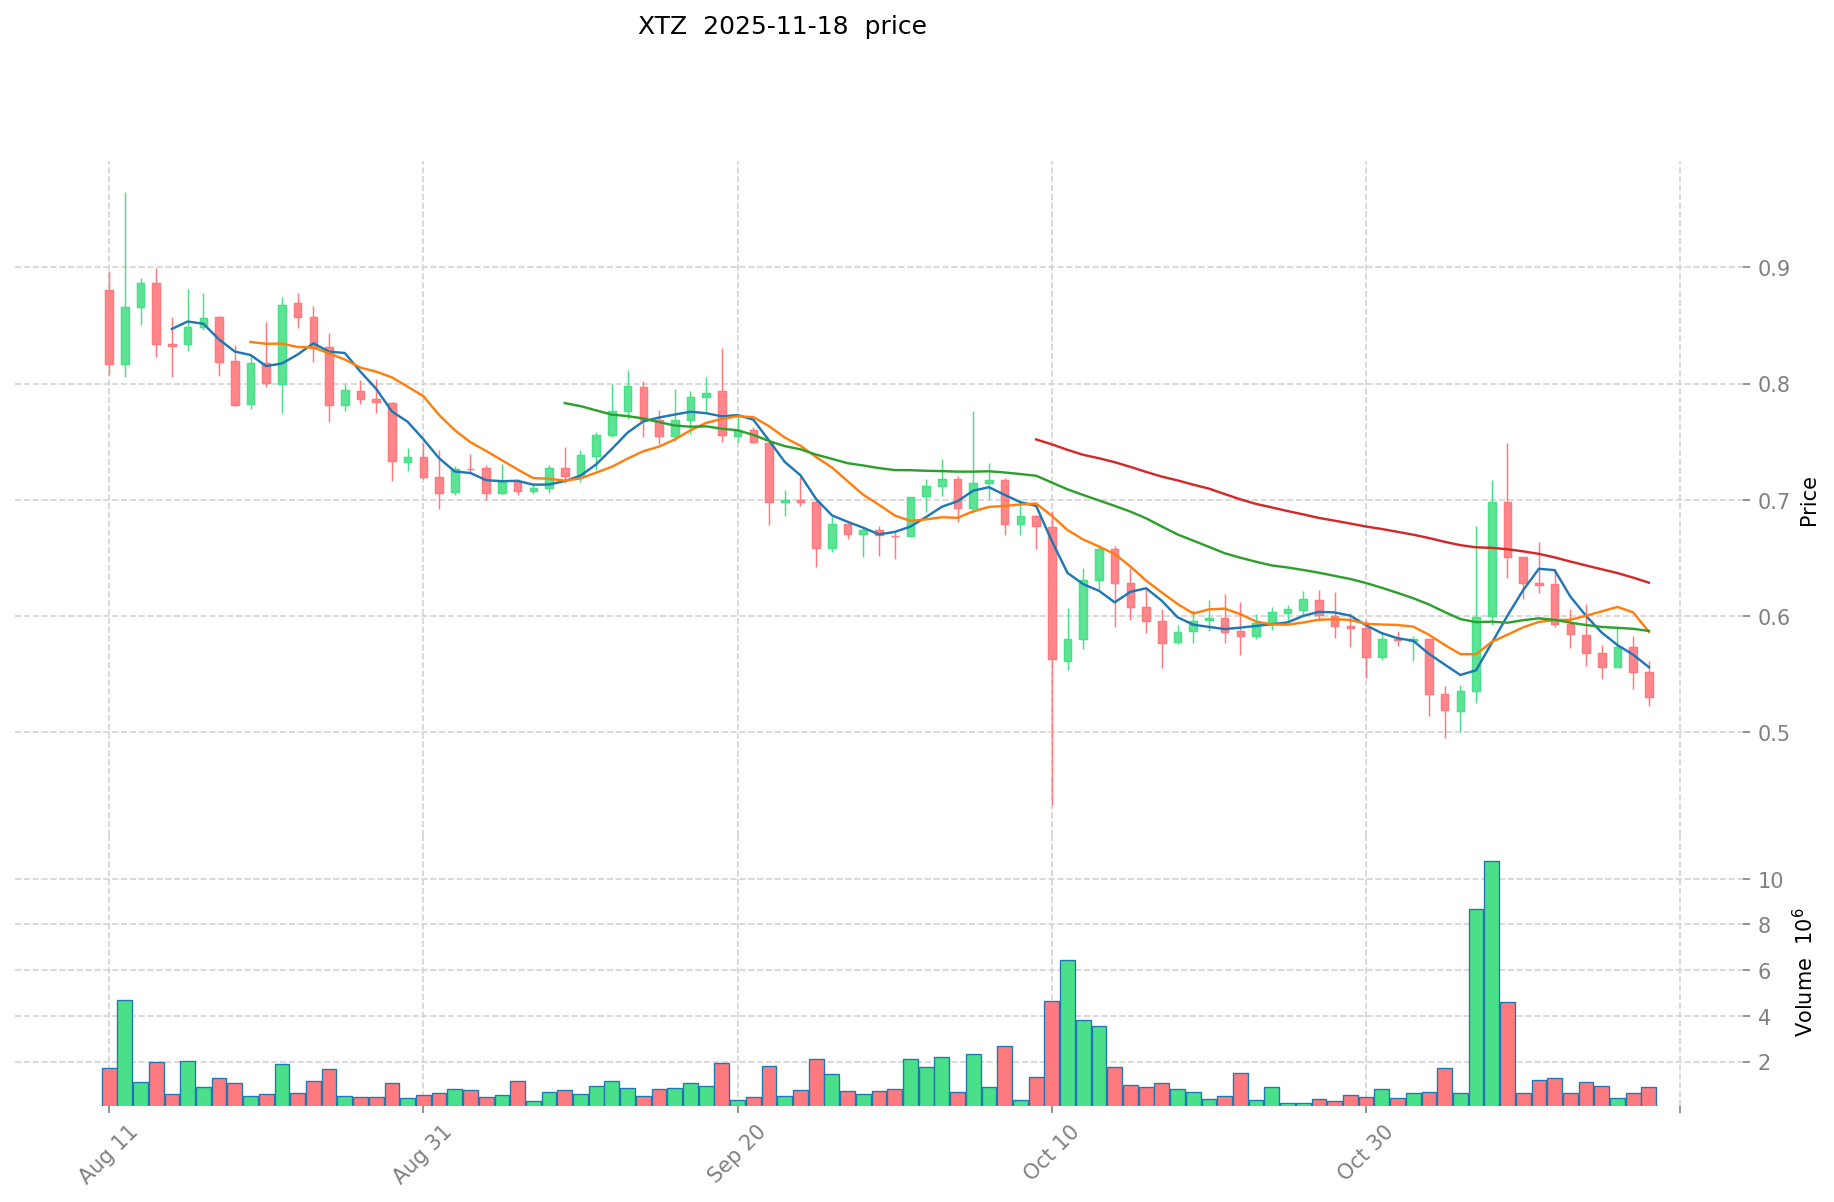
WNXM (Coin A) and XTZ (Coin B) Historical Price Trends
- 2021: XTZ reached its all-time high of $9.12 on October 4, 2021.
- 2022: XTZ hit its all-time low of $0.350476 on December 7, 2022.
- Comparative analysis: During the recent market cycle, XTZ dropped from its peak of $9.12 to a low of $0.350476, showing significant volatility.
Current Market Situation (2025-11-18)
- WNXM current price: $71.61
- XTZ current price: $0.5329
- 24-hour trading volume: WNXM $13,776.94 vs XTZ $30.85 million
- Market Sentiment Index (Fear & Greed Index): 11 (Extreme Fear)
Click to view real-time prices:
- Check WNXM current price Market Price
- Check XTZ current price Market Price
II. Core Factors Affecting WNXM vs XTZ Investment Value
Supply Mechanisms Comparison (Tokenomics)
- WNXM: Wrapped NXM token representing NXM in DeFi ecosystems
- XTZ: Inflationary model with on-chain governance for determining issuance
- 📌 Historical pattern: Supply mechanisms have shown limited direct correlation with price cycles in both assets.
Institutional Adoption and Market Applications
- Institutional holdings: Limited data available on institutional preference between these assets
- Enterprise adoption: XTZ has seen more enterprise applications in settlements and portfolio diversification
- Regulatory attitudes: Varying regulatory approaches across jurisdictions, with neither having significant regulatory advantages
Technical Development and Ecosystem Building
- XTZ technical development: Self-amending protocol allowing upgrades without hard forks
- Ecosystem comparison: XTZ has broader ecosystem applications including DeFi, NFTs and smart contracts, while WNXM remains more focused on the insurance segment
Macroeconomic Factors and Market Cycles
- Performance in inflationary environments: Insufficient historical data to determine anti-inflationary properties
- Macro monetary policy: Both assets show sensitivity to interest rates and USD index movements
- Geopolitical factors: Cross-border transaction demand affects both assets in similar patterns
III. 2025-2030 Price Prediction: WNXM vs XTZ
Short-term Prediction (2025)
- WNXM: Conservative $62.30 - $71.61 | Optimistic $71.61 - $98.82
- XTZ: Conservative $0.34 - $0.53 | Optimistic $0.53 - $0.59
Mid-term Prediction (2027)
- WNXM may enter a growth phase, with expected prices $91.50 - $104.58
- XTZ may enter a moderate growth phase, with expected prices $0.30 - $0.87
- Key drivers: Institutional inflows, ETFs, ecosystem development
Long-term Prediction (2030)
- WNXM: Base scenario $87.58 - $115.24 | Optimistic scenario $115.24 - $122.15
- XTZ: Base scenario $0.70 - $0.92 | Optimistic scenario $0.92 - $1.32
Disclaimer: This analysis is based on historical data and projections. Cryptocurrency markets are highly volatile and unpredictable. This information should not be considered as financial advice. Always conduct your own research before making investment decisions.
WNXM:
| 年份 | 预测最高价 | 预测平均价格 | 预测最低价 | 涨跌幅 |
|---|---|---|---|---|
| 2025 | 98.8218 | 71.61 | 62.3007 | 0 |
| 2026 | 115.893624 | 85.2159 | 68.17272 | 19 |
| 2027 | 104.57695248 | 100.554762 | 91.50483342 | 40 |
| 2028 | 115.8994186812 | 102.56585724 | 57.4368800544 | 43 |
| 2029 | 121.248228136266 | 109.2326379606 | 92.84774226651 | 52 |
| 2030 | 122.15485903133898 | 115.240433048433 | 87.58272911680908 | 60 |
XTZ:
| 年份 | 预测最高价 | 预测平均价格 | 预测最低价 | 涨跌幅 |
|---|---|---|---|---|
| 2025 | 0.591186 | 0.5326 | 0.340864 | 0 |
| 2026 | 0.62370123 | 0.561893 | 0.30342222 | 5 |
| 2027 | 0.87141175905 | 0.592797115 | 0.30232652865 | 11 |
| 2028 | 0.82727801383825 | 0.732104437025 | 0.468546839696 | 37 |
| 2029 | 1.06038006658701 | 0.779691225431625 | 0.444423998496026 | 46 |
| 2030 | 1.324851330253417 | 0.920035646009317 | 0.699227090967081 | 72 |
IV. Investment Strategy Comparison: WNXM vs XTZ
Long-term vs Short-term Investment Strategy
- WNXM: Suitable for investors focused on decentralized insurance and risk-sharing models
- XTZ: Suitable for investors interested in self-amending blockchain technology and diverse ecosystem applications
Risk Management and Asset Allocation
- Conservative investors: WNXM: 30% vs XTZ: 70%
- Aggressive investors: WNXM: 60% vs XTZ: 40%
- Hedging tools: Stablecoin allocation, options, cross-currency combinations
V. Potential Risk Comparison
Market Risk
- WNXM: Limited liquidity and higher volatility due to niche market focus
- XTZ: Susceptible to broader crypto market trends and sentiment shifts
Technical Risk
- WNXM: Scalability, network stability
- XTZ: Potential vulnerabilities in self-amending protocol, security breaches
Regulatory Risk
- Global regulatory policies may impact both assets differently, with XTZ potentially facing more scrutiny due to its wider adoption
VI. Conclusion: Which Is the Better Buy?
📌 Investment Value Summary:
- WNXM advantages: Unique position in decentralized insurance, potential for growth in DeFi sector
- XTZ advantages: Self-amending protocol, broader ecosystem applications, higher liquidity
✅ Investment Advice:
- New investors: Consider a balanced approach with a higher allocation to XTZ for its established ecosystem
- Experienced investors: Explore WNXM for portfolio diversification while maintaining a core position in XTZ
- Institutional investors: Evaluate XTZ for its technological innovations and potential for enterprise applications
⚠️ Risk Warning: The cryptocurrency market is highly volatile. This article does not constitute investment advice. None
VII. FAQ
Q1: What are the main differences between WNXM and XTZ? A: WNXM is focused on decentralized insurance and risk-sharing models, while XTZ is known for its self-amending protocol and broader ecosystem applications including DeFi, NFTs, and smart contracts. XTZ also has higher liquidity and trading volume compared to WNXM.
Q2: Which asset has shown better price performance historically? A: Based on the available data, XTZ has shown more significant price movements, reaching an all-time high of $9.12 in October 2021. However, it also experienced substantial volatility, dropping to a low of $0.350476 in December 2022. WNXM's price history is not as explicitly stated in the given information.
Q3: How do the supply mechanisms of WNXM and XTZ differ? A: WNXM is a wrapped token representing NXM in DeFi ecosystems, while XTZ follows an inflationary model with on-chain governance determining issuance. However, the supply mechanisms have shown limited direct correlation with price cycles for both assets.
Q4: What are the predicted price ranges for WNXM and XTZ in 2030? A: For WNXM, the base scenario predicts a range of $87.58 - $115.24, with an optimistic scenario of $115.24 - $122.15. For XTZ, the base scenario predicts a range of $0.70 - $0.92, with an optimistic scenario of $0.92 - $1.32.
Q5: How should investors allocate their portfolios between WNXM and XTZ? A: Conservative investors might consider allocating 30% to WNXM and 70% to XTZ, while aggressive investors might allocate 60% to WNXM and 40% to XTZ. However, individual allocations should be based on personal risk tolerance and investment goals.
Q6: What are the main risks associated with investing in WNXM and XTZ? A: Both assets face market risks related to crypto volatility. WNXM has limited liquidity and higher volatility due to its niche focus. XTZ is more susceptible to broader market trends. Technical risks include scalability for WNXM and potential vulnerabilities in XTZ's self-amending protocol. Both face regulatory risks, with XTZ potentially facing more scrutiny due to wider adoption.
Share
Content
Introduction: WNXM vs XTZ Investment Comparison
I. Price History Comparison and Current Market Status
II. Core Factors Affecting WNXM vs XTZ Investment Value
III. 2025-2030 Price Prediction: WNXM vs XTZ
IV. Investment Strategy Comparison: WNXM vs XTZ
V. Potential Risk Comparison
VI. Conclusion: Which Is the Better Buy?
VII. FAQ

