
XRP had a boring week. The price dipped around 5 percent and now trades at $1.32. Our team at CaptainAltcoin posted a weekly price prediction for XRP today, and the projections indicate another quiet week ahead.
But the XRP community never stays quiet for long. Someone always has a bold prediction. Javon Marks, a crypto analyst who has been vocal about XRP in recent years, just dropped a chart that got everyone talking.
Marks shared a 2-week XRP/Bitcoin chart on TradingView. The chart tracks how much XRP is worth in Bitcoin terms, not in dollars. This pair, XRP/BTC, tells a different story than the USD price. When XRP/BTC goes up, XRP is gaining strength against Bitcoin. When it goes down, Bitcoin is outperforming.
Marks pointed to a pattern that played out before. The last time XRP broke out against Bitcoin in a similar setup, the pair climbed over 243 percent. Following that breakout, XRP’s dollar price went on to climb over 500 percent, moving from the $0.50 range all the way to $3.30.
Now he says the same thing is happening again, but on a larger scale.
XRP Chart Analysis
The 2-week chart from Marks shows XRP/BTC trading at 0.00002012 at the time of his post. The pair has been consolidating for years, forming a massive descending triangle or a long-term accumulation pattern. The chart lines show a clear breakout above a multi-year resistance level that had held XRP/BTC down since the 2017-2018 peak.
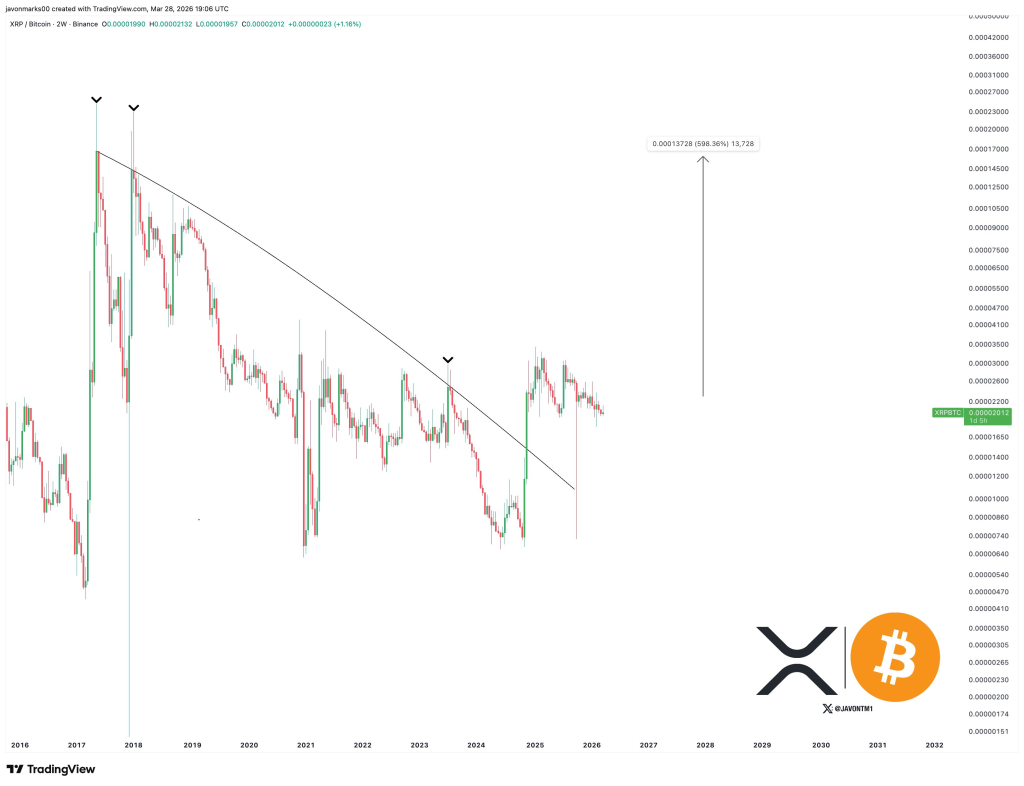
Source: X/@JavonTM1
In the previous cycle, the breakout happened from a smaller structure. That delivered a 243 percent move in the pair and a 500 percent move in XRP’s dollar price.
This time, the breakout structure is much larger. The base is wider. The resistance line goes back several years. Marks projects a 635 percent increase in XRP/BTC from the breakout point.
If that plays out, XRP’s dollar price would hit over $10. That is the calculation. A 635 percent rally in XRP/BTC means XRP gains massive strength against Bitcoin. With Bitcoin sitting in the $60,000 to $70,000 range, a 635 percent jump in the pair sends XRP well into double digits.
Technical analysis on a 2-week chart carries more weight than a 1-hour or 1-day chart. Longer timeframes filter out noise and show true structural breaks. The breakout Marks highlighted is not a small wiggle. It is a clean move above a resistance line that had rejected XRP/BTC multiple times over several years.
That said, patterns repeat until they do not. The last breakout delivered huge gains. This one could too. But the market is different now. Bitcoin dominance remains high. Altcoin seasons have been shorter and weaker than past cycles.
Still, for XRP holders looking for a reason to stay bullish, Marks just handed them one. The weekly price action in dollars looks boring. However, the XRP/BTC chart is worth checking out.
Read also: Claude AI Predicts the Price of XRP and Solana By the End of 2026
Disclaimer: The information on this page may come from third parties and does not represent the views or opinions of Gate. The content displayed on this page is for reference only and does not constitute any financial, investment, or legal advice. Gate does not guarantee the accuracy or completeness of the information and shall not be liable for any losses arising from the use of this information. Virtual asset investments carry high risks and are subject to significant price volatility. You may lose all of your invested principal. Please fully understand the relevant risks and make prudent decisions based on your own financial situation and risk tolerance. For details, please refer to
Disclaimer.
Related Articles
BTC falls 0.49% in 15 minutes: fragile long leverage and active sell-off pressure resonate to weigh on the short term
From 18:00 to 18:15 (UTC) on 2026-04-17, the BTC price fluctuated and trended downward within the 77097.4 to 77573.2 USDT range. Over these 15 minutes, the return rate recorded -0.49%, and the amplitude reached 0.61%. During this period, market trading was active; short-term volatility was amplified, and trading attention increased significantly. The main driver behind this abnormal move is that the overall leverage structure is bearish and long positions are fragile. At present, the BTC perpetual contract funding rate has remained negative for 11 consecutive days, indicating that the bears have the upper hand in the market. In addition, futures open interest (OI) is about 628.3 billion USDT, which is at a historical high. During the anomaly window, trading volume increased noticeably. On-chain data shows large amounts of BTC flowing from long-term holder addresses to exchanges, suggesting that active sell orders may have triggered longs to passively reduce positions, amplifying downward price pressure. Moreover, institutional positioning enthusiasm in the mainstream contract market has cooled off; liquidity boundaries have tightened, causing large-trade activity to have an amplified effect on market volatility. In the options market, implied volatility rose to 39.81%, increasing demand for downside protection and reflecting a defensive posture among market participants. Macro-environment volatility and some capital flowing into safe-haven assets, together with the recent regulatory uncertainty-related historical events, reinforced the move, pushing overall market risk appetite lower. Current BTC leverage risks still remain. If, in the future, there are concentrated sell-offs, volatility may be further amplified. It is recommended to continue monitoring sustained high OI levels, the persistence of negative funding rates, and on-chain transfers of large amounts of funds, and to stay alert for whale behavior and any disruptions to market sentiment caused by macro-policy developments. For subsequent price action, please watch key support levels, institutional and whale on-chain moves, and relevant global market news, and guard against short-term risks.
GateNews51m ago
Bitcoin Liquidations Hit $815M as BTC Surges Above $78K Amid Iran Strait Opening
Over $815 million in leveraged cryptocurrency positions were liquidated recently, mainly due to short positions against Bitcoin. Markets improved as Iran reopened the Strait of Hormuz and Trump hinted at a deal with Iran, boosting Bitcoin prices significantly.
GateNews57m ago
Cardano Founder Hoskinson Warns BIP-361 Could Freeze 1.7M Bitcoin
Charles Hoskinson warned that Bitcoin's BIP-361 upgrade, meant to address quantum threats, is wrongly classified as a soft fork. It could freeze 1.7 million BTC, including 1 million from Satoshi Nakamoto, as early coin owners can't prove ownership.
GateNews1h ago
BTC drops 0.45% in 15 minutes: Whale concentrated transfers into exchanges stack up sell pressure while leverage withdrawals amplify the pullback
From 17:00 to 17:15 (UTC) on 2026-04-17, BTC saw a brief drop. The return rate recorded was -0.45%, with the price ranging from 77354.3 to 77916.9 USDT and a swing of 0.72%. During the event, market attention warmed up, volatility intensified, and spot market liquidity changed significantly.
The main driver of this price anomaly was that whale wallets concentrated transfers to exchanges. In a single 15-minute period, the exchange inflow surged to 11,000 BTC, reaching a new high since December 2025. The average amount deposited per transaction was as high as 2.25 BTC, indicating that large holders chose key price levels to concentrate and release their positions, clearly lifting sell pressure. At the same time, BTC futures open interest fell to a 14-month low of $841 million, as leverage funds exited sharply. The spot market’s pull on price fluctuations became the main factor, further magnifying the impact of whale trading.
In addition, although ETF funds had a net inflow with a hedging effect—bringing the April cumulative inflow to $5.651 billion—within this anomaly window they were not able to fully absorb large sell orders. The spot market mainly relied on institutional buying to digest the selling pressure, and overall risk appetite contracted. On-chain data shows that 41% of the BTC supply is in a loss-making range, and some holders who bought at lower prices face take-profit and stop-loss pressure. With multiple factors converging, short-term tension formed among exchange inflows, leverage withdrawal, profit realization, and institutions’ ability to absorb, increasing the magnitude of spot volatility.
Short-term risks are worth watching closely. Users should closely monitor core indicators such as the subsequent exchange inflow volume, the pace of ETF net inflows, and futures open interest. If whale sell orders still have not eased and ETF inflows cannot accelerate in step, the BTC price may remain under sustained pressure. Users should focus on on-chain transfers and changes in major holders’ positions, watch the spot market’s key support ranges and trading structure, obtain more market information in a timely manner, and stay alert to risks brought by sharp volatility.
GateNews1h ago
Alcoa in Advanced Talks to Sell Massena Smelter Site to Bitcoin Miner NYDIG
Alcoa Corp. is negotiating to sell its Massena East smelter site in New York to Bitcoin mining firm NYDIG, with a deal anticipated to close mid-year as part of Alcoa's asset divestiture strategy.
GateNews2h ago
