Trade
Trading Type
Spot
Trade crypto freely
Alpha
Points
Get promising tokens in streamlined on-chain trading
Pre-Market
Trade new tokens before they are officially listed
Margin
Magnify your profit with leverage
Convert & Block Trading
0 Fees
Trade any size with no fees and no slippage
Leveraged Tokens
Get exposure to leveraged positions simply
Futures
Futures
Hundreds of contracts settled in USDT or BTC
Options
HOT
Trade European-style vanilla options
Unified Account
Maximize your capital efficiency
Demo Trading
Futures Kickoff
Get prepared for your futures trading
Futures Events
Participate in events to win generous rewards
Demo Trading
Use virtual funds to experience risk-free trading
Earn
Launch
CandyDrop
Collect candies to earn airdrops
Launchpool
Quick staking, earn potential new tokens
HODLer Airdrop
Hold GT and get massive airdrops for free
Launchpad
Be early to the next big token project
Alpha Points
NEW
Trade on-chain assets and enjoy airdrop rewards!
Futures Points
NEW
Earn futures points and claim airdrop rewards
Investment
Simple Earn
Earn interests with idle tokens
Auto-Invest
Auto-invest on a regular basis
Dual Investment
Buy low and sell high to take profits from price fluctuations
Soft Staking
Earn rewards with flexible staking
Crypto Loan
0 Fees
Pledge one crypto to borrow another
Lending Center
One-stop lending hub
VIP Wealth Hub
Customized wealth management empowers your assets growth
Private Wealth Management
Customized asset management to grow your digital assets
Quant Fund
Top asset management team helps you profit without hassle
Staking
Stake cryptos to earn in PoS products
BTC Staking
HOT
Stake BTC and earn 10% APR
GUSD Minting
Use USDT/USDC to mint GUSD for treasury-level yields

More
VastStarDiary
No content yet
VastStarDiary
Judging from the current BTC trend and market environment, there is potential bullish momentum in the short term. The core logic can be analyzed from three dimensions: technical, macro, and market structure.
I. Technical: Rebound potential after oversold conditions
1. Support Level Validity
The current price (89,550.2) is within the key support zone of 88,000-90,000 (both the recent rebound starting point and JPMorgan's estimated Bitcoin production cost line). Downside is limited, providing a technical basis for a rebound.
2. Oversold Indicator Signals
On the 4-hour chart, the KDJ indicator (K
BTC-0.67%

- Reward
- like
- 1
- Repost
- Share
LoveMakesTheLegsWeak.:
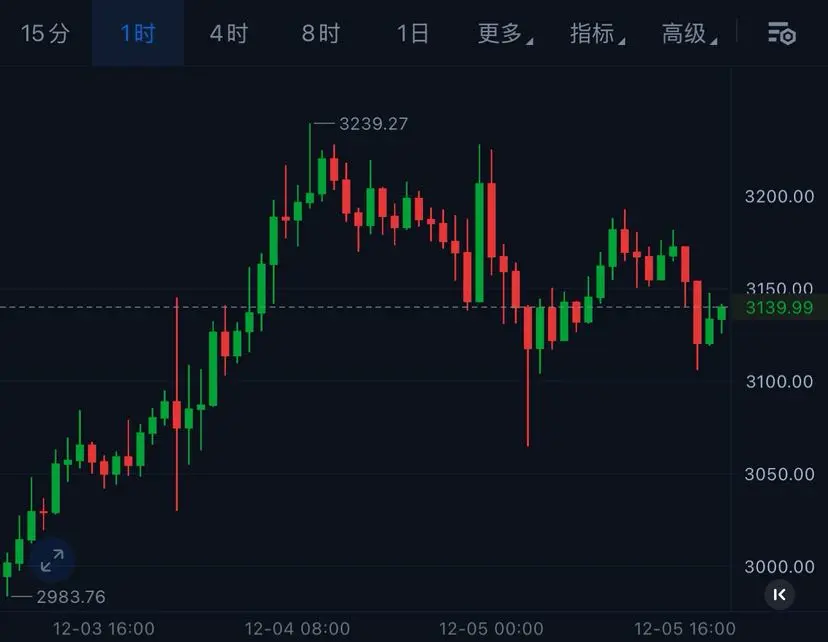
#成长值抽奖赢iPhone17和周边#Analysis of ETH on Friday Night, December 5
From the 1-hour timeframe, after two consecutive bullish candles, the pullback has basically ended. The lower Bollinger Band provides strong support, and there is a faint trend of breaking through the middle band. The KDJ indicator has turned upward and is about to overlap, while the bearish momentum is clearly weakening.
Personal suggestion, for reference only (set strict stop-loss)
ETH can be considered for long positions around 3120-3100, with a target of 3190-3250.
View OriginalFrom the 1-hour timeframe, after two consecutive bullish candles, the pullback has basically ended. The lower Bollinger Band provides strong support, and there is a faint trend of breaking through the middle band. The KDJ indicator has turned upward and is about to overlap, while the bearish momentum is clearly weakening.
Personal suggestion, for reference only (set strict stop-loss)
ETH can be considered for long positions around 3120-3100, with a target of 3190-3250.
- Reward
- like
- Comment
- Repost
- Share
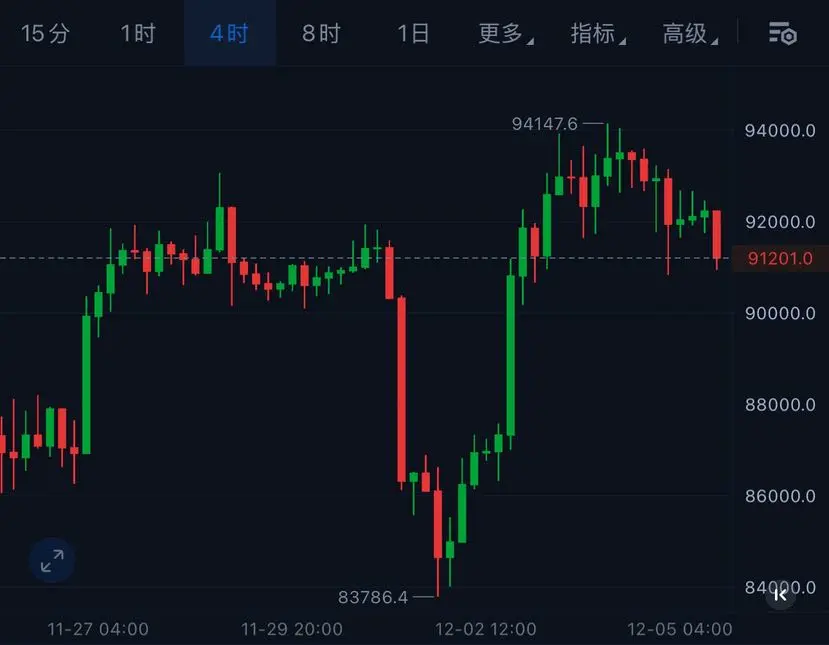
June 12, Friday Night BTC Analysis
From the 4-hour chart, BTC's pullback and consolidation are basically over. It has tested the 90,800 area twice, indicating a solid bottom. In terms of technical indicators, the EMA monthly line provides strong support compared to the price, and the KDJ indicator is in the oversold zone and is trending upward, showing an imminent upward move.
Personal suggestion, for reference only (set strict stop-loss)
BTC can be long around 90,800-90,000, targeting 92,100-94,200
BTC-0.67%
- Reward
- like
- Comment
- Repost
- Share
Next stop, financial freedom!
View Original

- Reward
- like
- Comment
- Repost
- Share
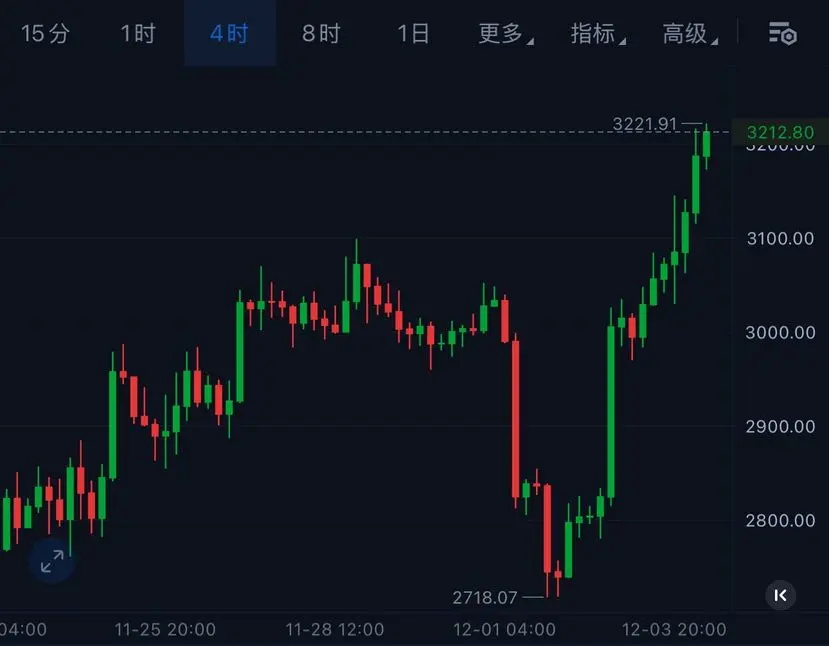
ETH Morning Analysis for Thursday, 12.4
From the 4-hour chart, ETH is showing exceptionally strong momentum. Bulls have achieved an overwhelming victory, and bears are unable to organize an effective counterattack in the short term. It is about to challenge the next resistance level around 3400. Any pullback is a buying opportunity.
Personal suggestion, for reference only (set strict stop-loss)
ETH can be bought around 3200-3180, target 3350-3400
View OriginalFrom the 4-hour chart, ETH is showing exceptionally strong momentum. Bulls have achieved an overwhelming victory, and bears are unable to organize an effective counterattack in the short term. It is about to challenge the next resistance level around 3400. Any pullback is a buying opportunity.
Personal suggestion, for reference only (set strict stop-loss)
ETH can be bought around 3200-3180, target 3350-3400
- Reward
- like
- Comment
- Repost
- Share
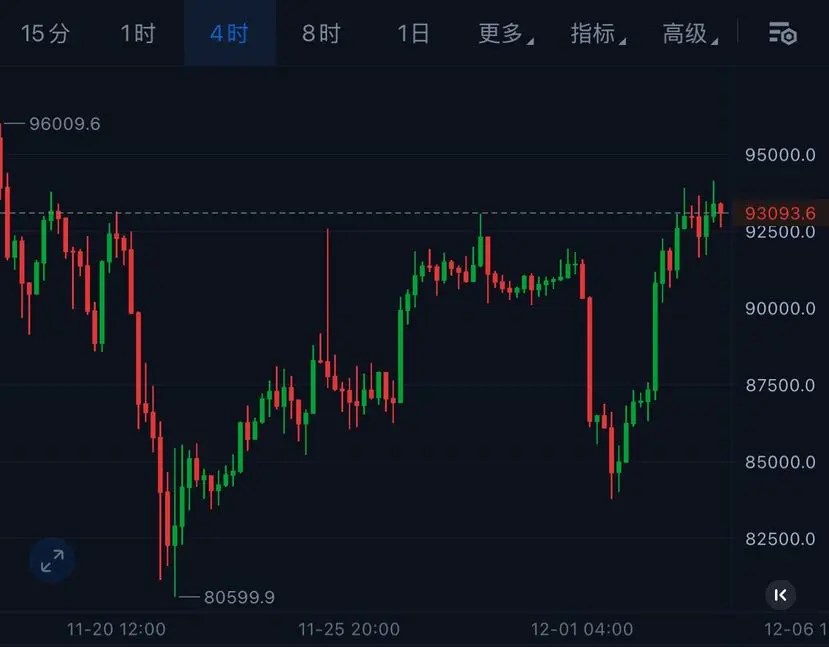
Analysis of Bitcoin on Thursday Morning, 12.4
Looking at the 4-hour chart, Bitcoin has broken through the resistance level and established itself at a key position. The upward channel is fully open, and the bulls are in control. Technically, the MACD golden cross has appeared with the green bars continuing to increase in volume. The overall strategy for today is to maintain a buy-on-dips approach.
Personal suggestion, for reference only (set strict stop-loss)
Bitcoin can be bought in the 92,500-91,700 range, with a target of 96,000-98,000.
BTC-0.67%
- Reward
- like
- Comment
- Repost
- Share
The Double Cake call given yesterday has been perfectly validated, with a 270-point move!
View Original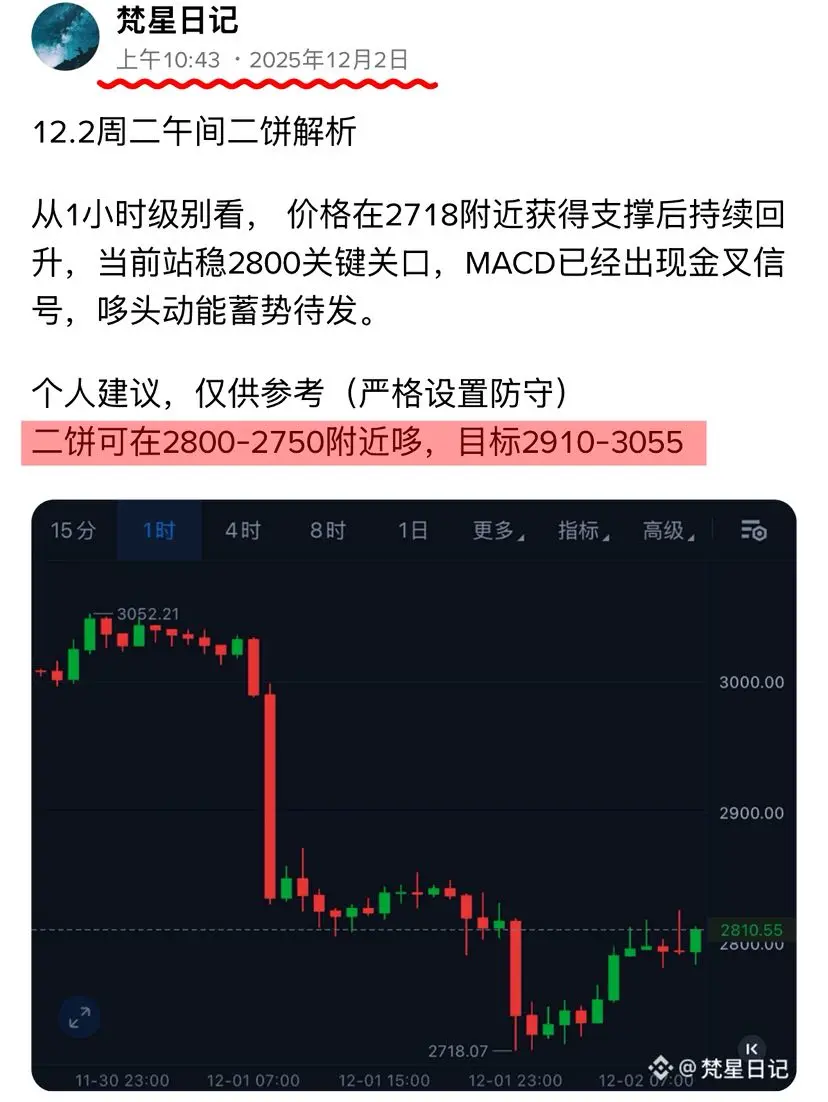
- Reward
- like
- Comment
- Repost
- Share
At noon, the big pie was given, and the single Silk Road has steadily reached the first target, breaking through the 1,300 points range, successfully taking down 5,000 oil!
BTC-0.67%
- Reward
- like
- Comment
- Repost
- Share
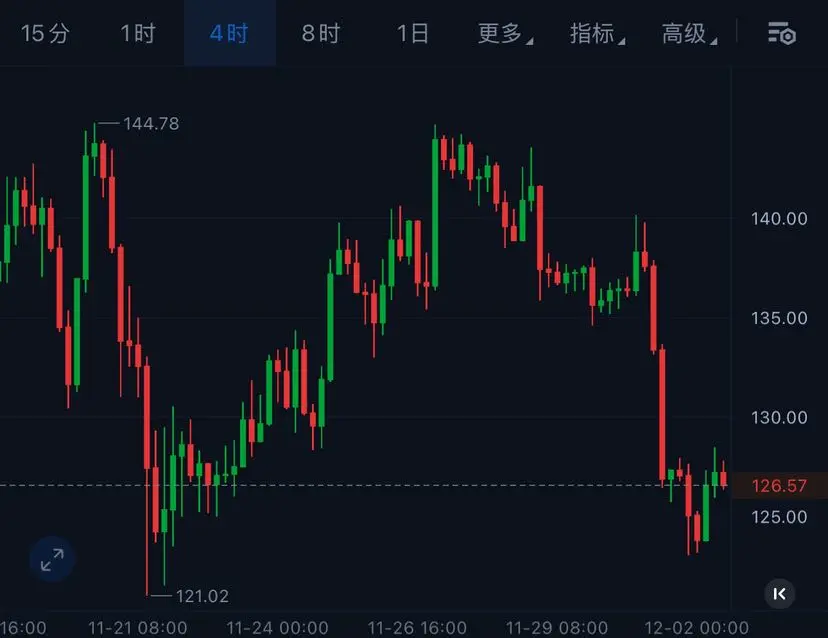
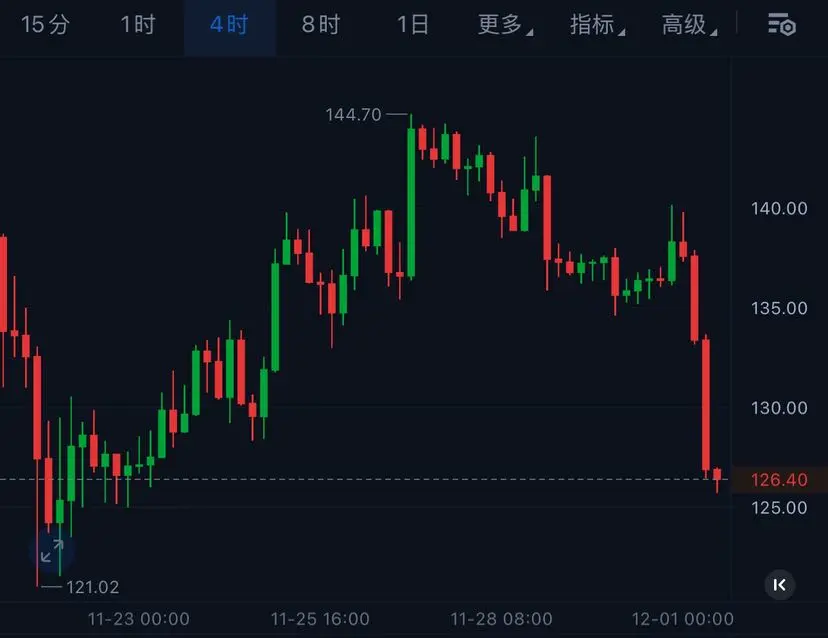
$SOL From the 4-hour level, the price has pulled back from 140 to around 125, a fall of 10.7%. After such a rapid decline, there will definitely be a rebound. The technical indicators show that the KDJ indicator is in the oversold range and has a trend of turning upwards, with a rebound about to come.
Personal advice, for reference only (strictly set defense)
Near 125-122, target around 133-140.
Personal advice, for reference only (strictly set defense)
Near 125-122, target around 133-140.
SOL-0.75%
- Reward
- like
- Comment
- Repost
- Share
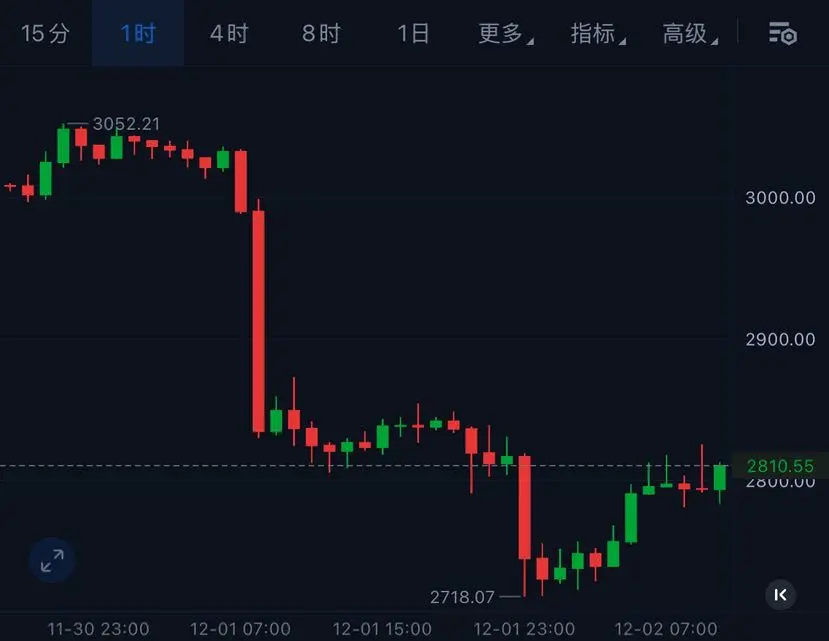
Analysis of ETH on Tuesday midday, 12.2
From the 1-hour level, the price has continued to rise after finding support near 2718, and is currently stabilizing at the key level of 2800. The MACD has already shown a golden cross signal, and the momentum is building up.
Personal advice, for reference only (strictly set up defense)
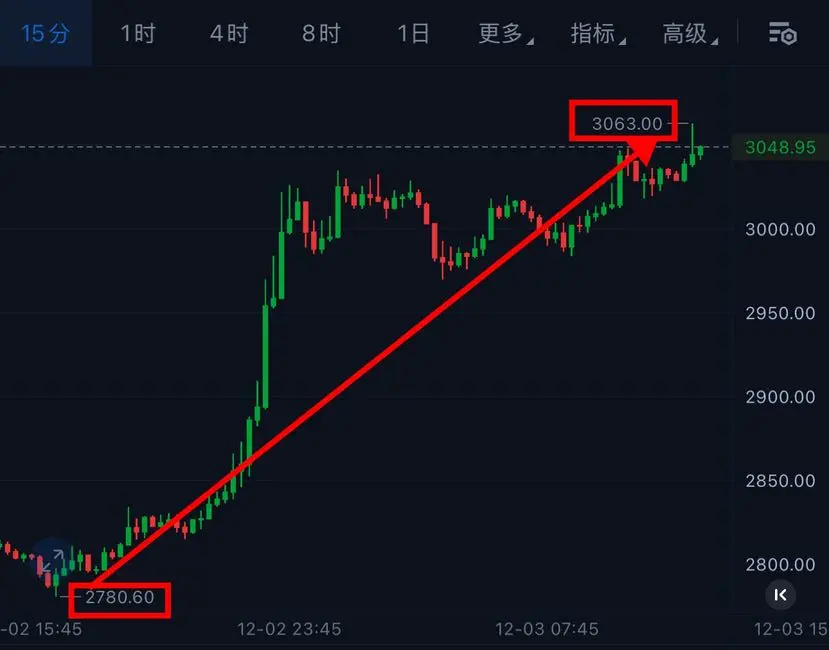
ETH can fluctuate around 2800-2750, with a target of 2910-3055.
View OriginalFrom the 1-hour level, the price has continued to rise after finding support near 2718, and is currently stabilizing at the key level of 2800. The MACD has already shown a golden cross signal, and the momentum is building up.
Personal advice, for reference only (strictly set up defense)
ETH can fluctuate around 2800-2750, with a target of 2910-3055.
- Reward
- like
- Comment
- Repost
- Share
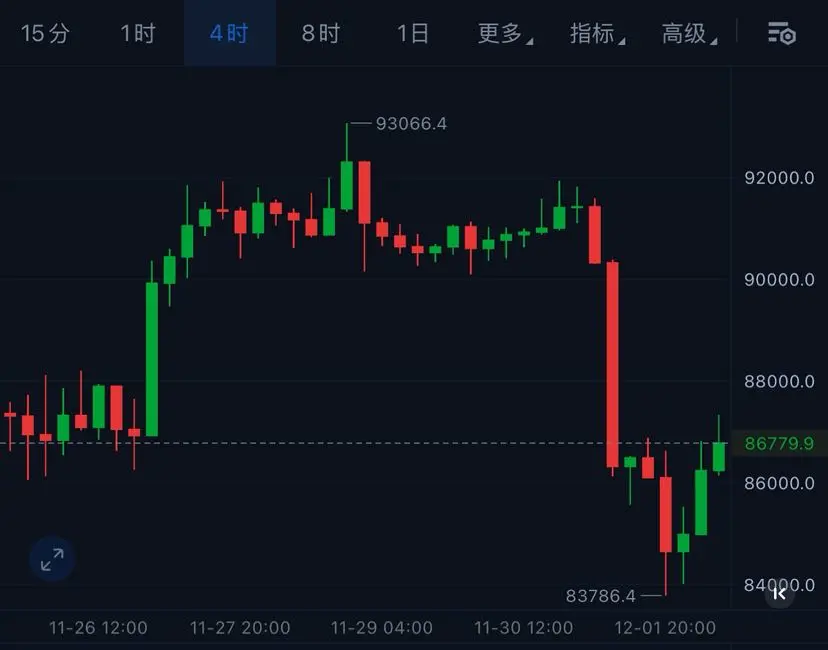
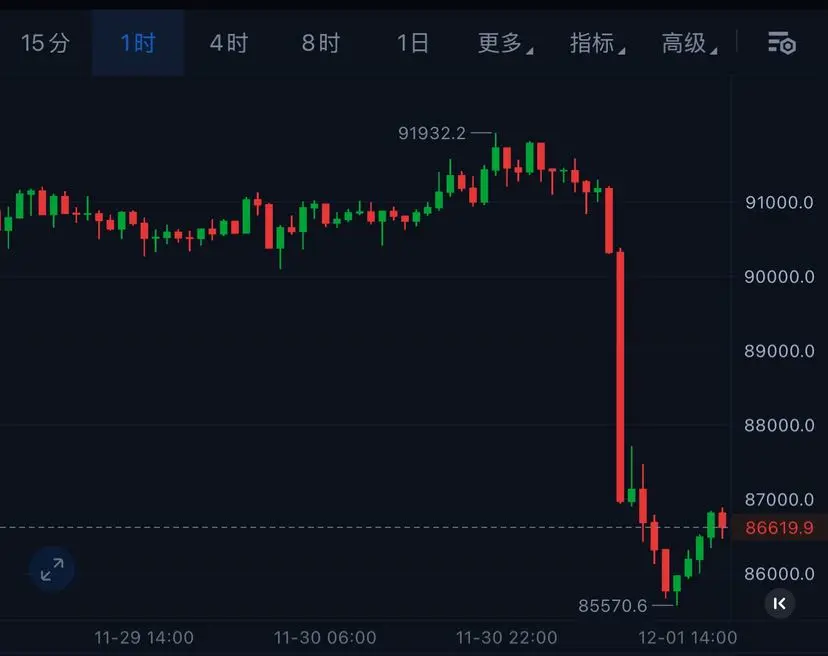
12.1 Monday evening BTC analysis
From the 4-hour chart, BTC has quickly rebounded after a sharp drop, recovering some lost ground. The short-term downward momentum has weakened. On the technical side, the price is back above the key support level of 86000+, showing a "bottoming out" signal. The trading volume has increased during the rebound, indicating that buying interest is starting to pick up. The KDJ indicator has turned upwards from a low position, suggesting the expectation of a corrective rebound. In the short term, it is important to see if it can hold above the 87000 level. If it can
From the 4-hour chart, BTC has quickly rebounded after a sharp drop, recovering some lost ground. The short-term downward momentum has weakened. On the technical side, the price is back above the key support level of 86000+, showing a "bottoming out" signal. The trading volume has increased during the rebound, indicating that buying interest is starting to pick up. The KDJ indicator has turned upwards from a low position, suggesting the expectation of a corrective rebound. In the short term, it is important to see if it can hold above the 87000 level. If it can
BTC-0.67%
- Reward
- like
- Comment
- Repost
- Share
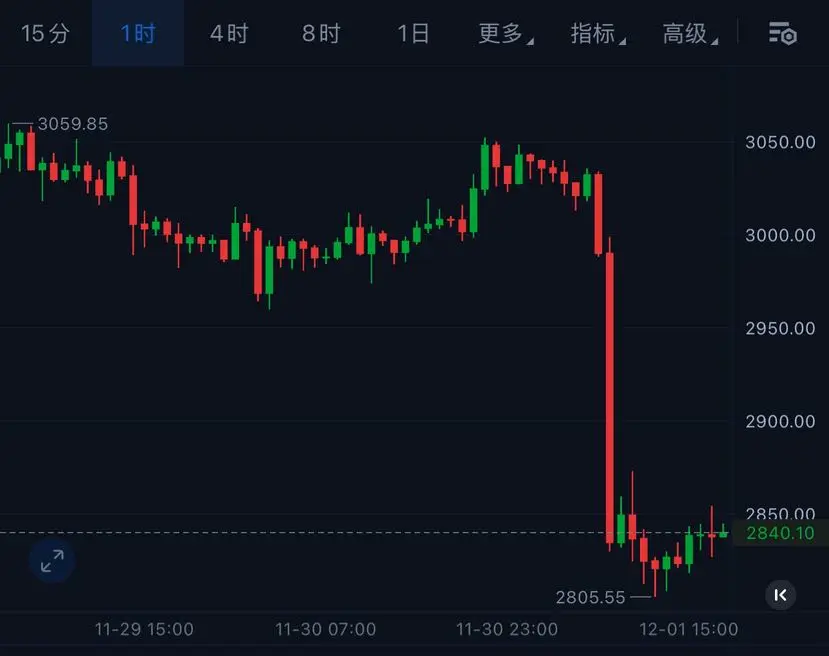
12.1 Monday night ETH analysis
From the 1-hour level, the price comparison has now stopped falling and stabilized. The MACD indicator shows a reduction in the red bars, with a golden cross emerging. The KDJ indicator is in a good state and is in a slow upward trend, while the momentum is clearly weakening.
Personal suggestion, for reference only (strictly set defense)
ETH can be traded around 2820-2800, target 2910-3055.
View OriginalFrom the 1-hour level, the price comparison has now stopped falling and stabilized. The MACD indicator shows a reduction in the red bars, with a golden cross emerging. The KDJ indicator is in a good state and is in a slow upward trend, while the momentum is clearly weakening.
Personal suggestion, for reference only (strictly set defense)
ETH can be traded around 2820-2800, target 2910-3055.
- Reward
- like
- Comment
- Repost
- Share
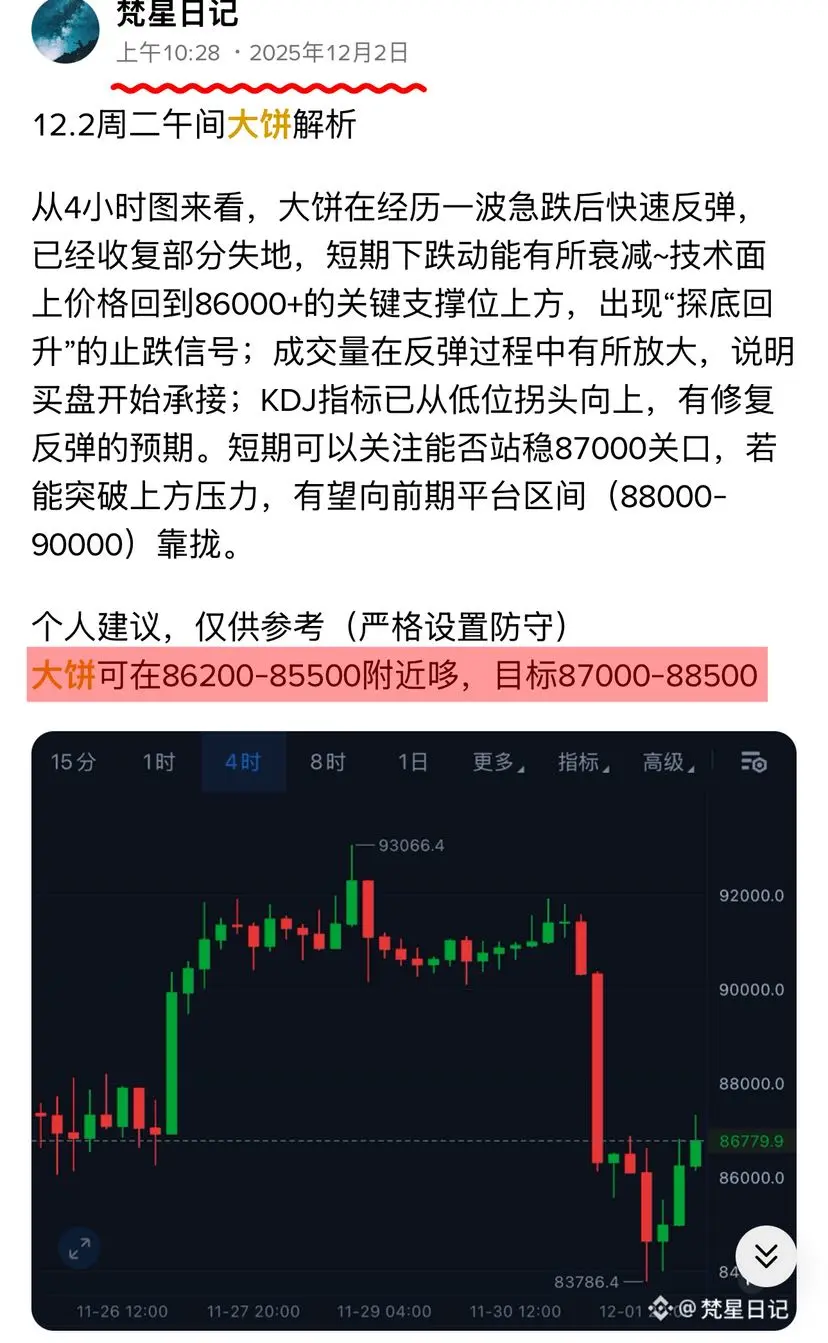
12.1 Monday Evening BTC Analysis
Affected by the suspected change in the Federal Reserve Chairman, the price dropped from 92000 to 85500, a decline of 3.8%. Currently, from the market perspective, it is gradually digesting the impact of the news and starting to stabilize and rise, allowing for a short-term long position.
Personal suggestion, for reference only (strictly set defense)
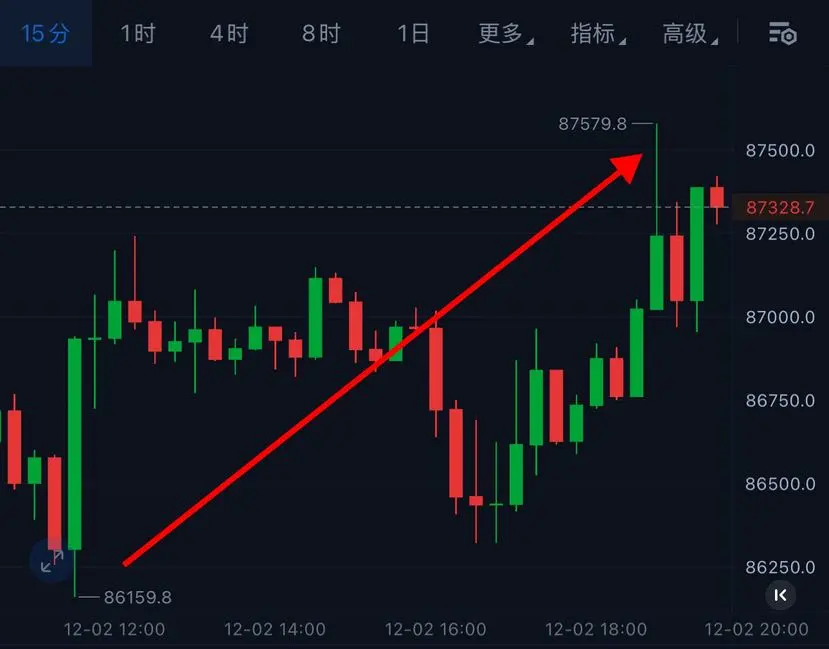
BTC can fluctuate around 86200-85500, with a target of 88300-89500.
Affected by the suspected change in the Federal Reserve Chairman, the price dropped from 92000 to 85500, a decline of 3.8%. Currently, from the market perspective, it is gradually digesting the impact of the news and starting to stabilize and rise, allowing for a short-term long position.
Personal suggestion, for reference only (strictly set defense)
BTC can fluctuate around 86200-85500, with a target of 88300-89500.
BTC-0.67%
- Reward
- like
- Comment
- Repost
- Share
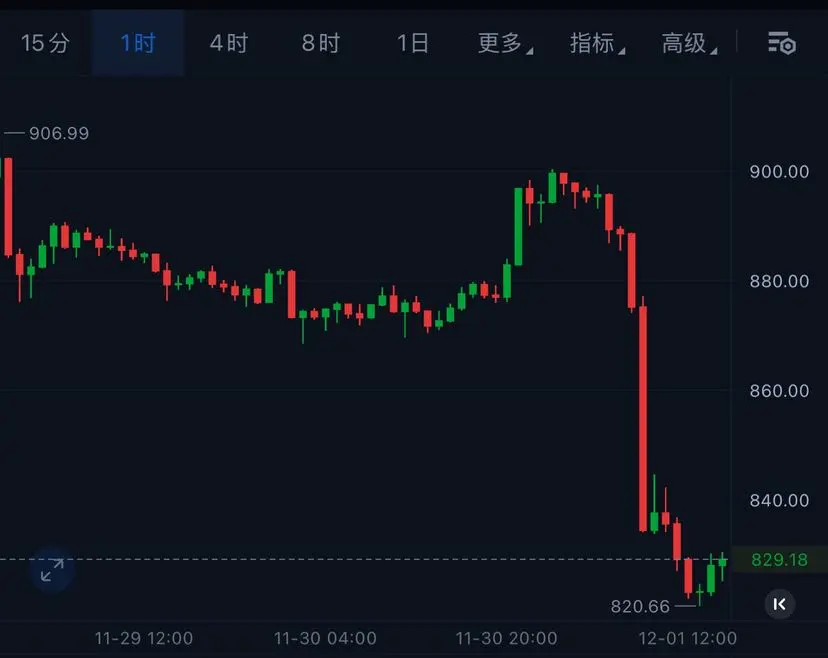
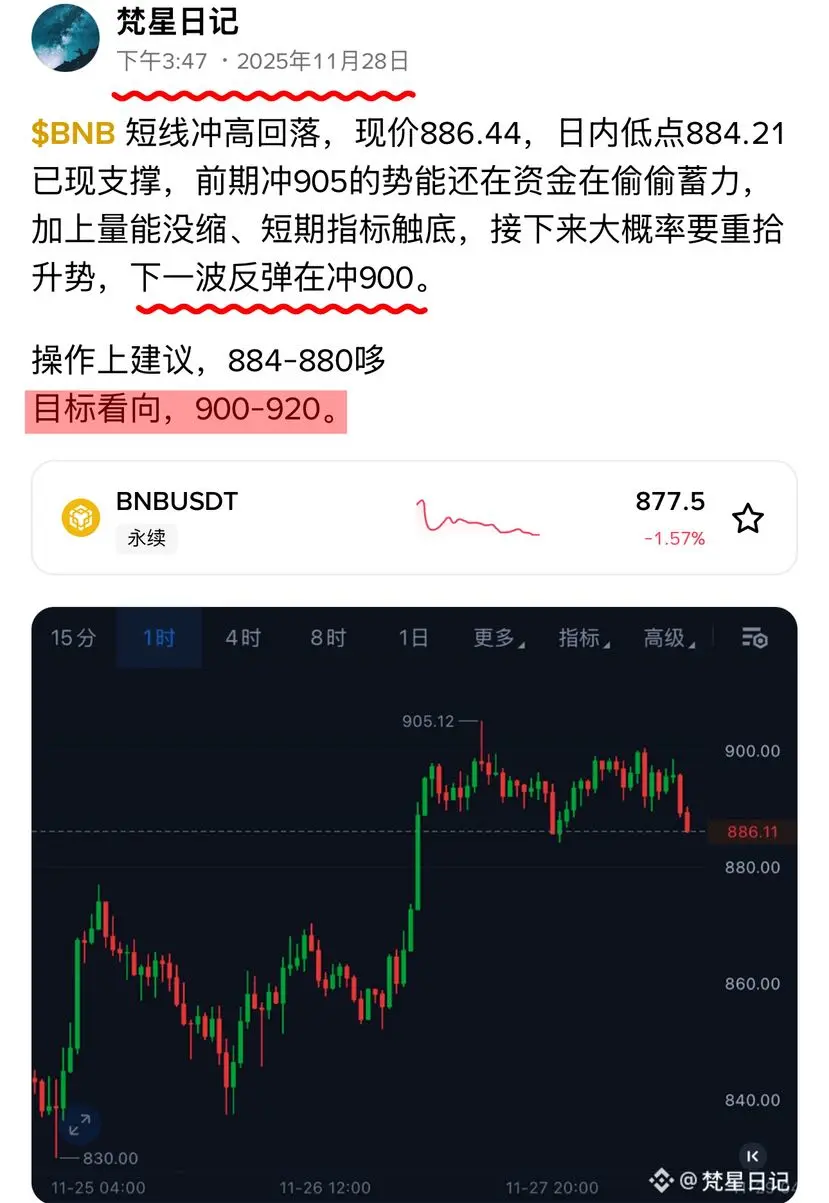
$BNB Looking at the one-hour chart, since the morning, it has been dipping, and there is now a trend of stabilizing after the fall. In terms of technical indicators, the KDJ indicator is all below 10, in the oversold zone, and the J line has crossed above the K line, with the D line forming a golden cross pattern. The market is poised for a breakout.
Personal advice, for reference only (strictly set defense)
Around 830-820, the target is around 868-882.
Personal advice, for reference only (strictly set defense)
Around 830-820, the target is around 868-882.
BNB0.2%
- Reward
- like
- Comment
- Repost
- Share
SOL, from the 4-hour level, has pulled back from 140 to around 125, a drop of 10.7%. After such a rapid fall, there will definitely be a rebound. The technical indicators show that the KDJ indicator is in the oversold zone and has a trend of turning upward, indicating that a counterattack is about to occur.
Personal advice, for reference only (strictly set defense)
Around 125-122, target near 133-140 #十二月行情展望
Personal advice, for reference only (strictly set defense)
Around 125-122, target near 133-140 #十二月行情展望
SOL-0.75%
- Reward
- like
- Comment
- Repost
- Share
12.1 Monday morning ETH analysis
From the 4-hour chart, after a significant drop in volume, the trading volume has converged and selling pressure has weakened; indicators show that KDJ is approaching oversold levels, MACD bars are shrinking, and DIF is about to cross above DEA. Combined with the current volume being higher than the average, this drop appears more like a panic sell-off clearing the way for a bottoming trend. Overall, ETH is expected to oscillate in the 2860-2950 range in the short term, with subsequent rebounds possibly reaching 3000-3050. The current pullback presents a window
View OriginalFrom the 4-hour chart, after a significant drop in volume, the trading volume has converged and selling pressure has weakened; indicators show that KDJ is approaching oversold levels, MACD bars are shrinking, and DIF is about to cross above DEA. Combined with the current volume being higher than the average, this drop appears more like a panic sell-off clearing the way for a bottoming trend. Overall, ETH is expected to oscillate in the 2860-2950 range in the short term, with subsequent rebounds possibly reaching 3000-3050. The current pullback presents a window
- Reward
- like
- Comment
- Repost
- Share
12.1 Monday morning BTC analysis
The intraday decline is 0.39%, but accompanied by a net inflow of 105 million USD, indicating that funds are entering the market during the pullback, suggesting strong support around the intraday low of 90335. On the technical side, the KDJ on the 1-hour cycle has entered the oversold zone (J value is only 0.8), and there are signs of the MACD's DIF turning upwards. Coupled with the current volume being higher than the average, the increase in selling pressure during the decline leans more towards a washout rather than a breakdown. Overall, it is highly lik
The intraday decline is 0.39%, but accompanied by a net inflow of 105 million USD, indicating that funds are entering the market during the pullback, suggesting strong support around the intraday low of 90335. On the technical side, the KDJ on the 1-hour cycle has entered the oversold zone (J value is only 0.8), and there are signs of the MACD's DIF turning upwards. Coupled with the current volume being higher than the average, the increase in selling pressure during the decline leans more towards a washout rather than a breakdown. Overall, it is highly lik
BTC-0.67%
- Reward
- like
- Comment
- Repost
- Share
Yesterday it was pointed out that BNB would make another attempt to break 900, and following the teacher's lead, I entered the market in advance, easily pocketing these 24 points!
BNB0.2%

- Reward
- like
- Comment
- Repost
- Share
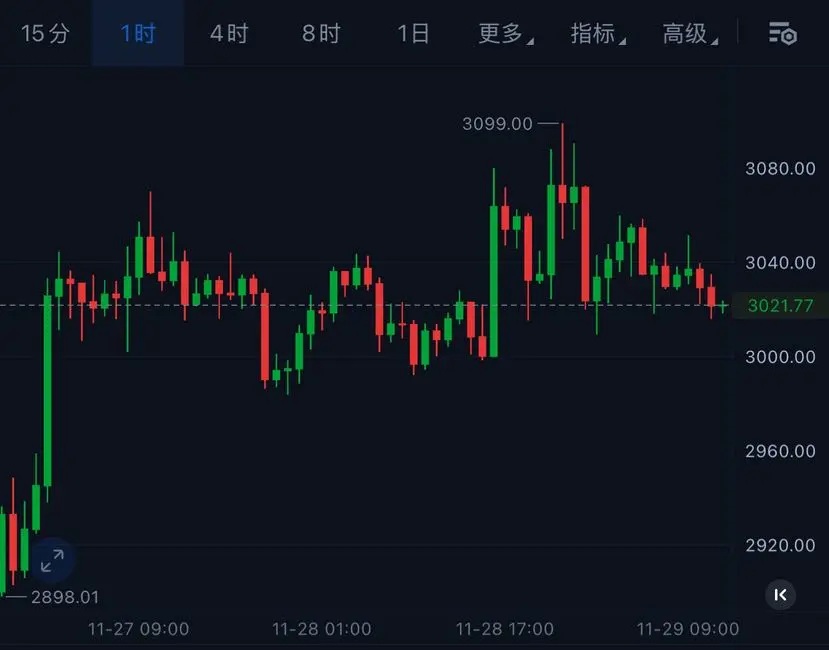
11.29 Saturday midday ETH analysis
ETH and BTC have similar trends, but ETH's downtrend is clearly stronger than BTC's. On the 1-hour level, the KDJ indicator is already in the overbought zone, and a rebound is imminent.
Personal advice, for reference only (strictly set defense)
ETH can be found around 3000-2980, target 3150-3255
ETH and BTC have similar trends, but ETH's downtrend is clearly stronger than BTC's. On the 1-hour level, the KDJ indicator is already in the overbought zone, and a rebound is imminent.
Personal advice, for reference only (strictly set defense)
ETH can be found around 3000-2980, target 3150-3255
BTC-0.67%
- Reward
- like
- Comment
- Repost
- Share
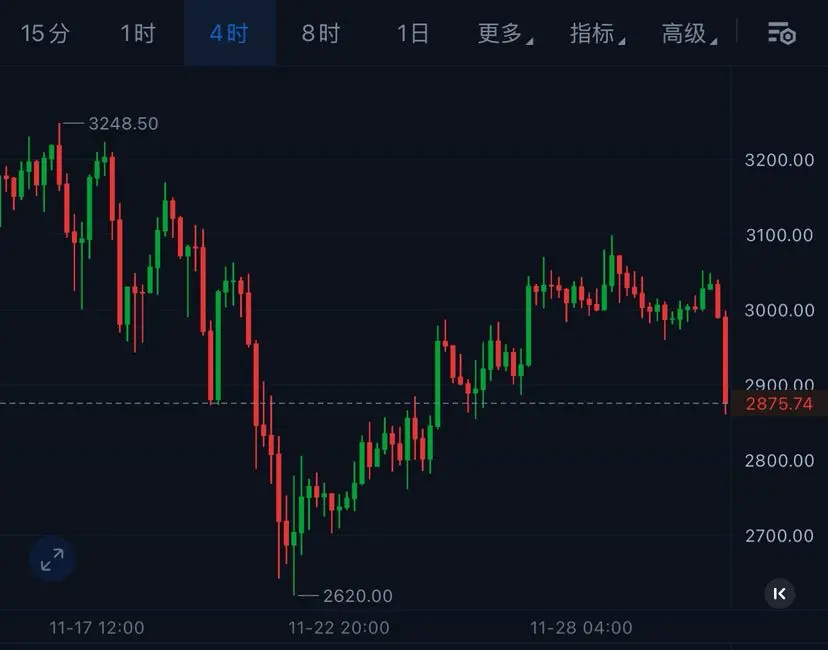
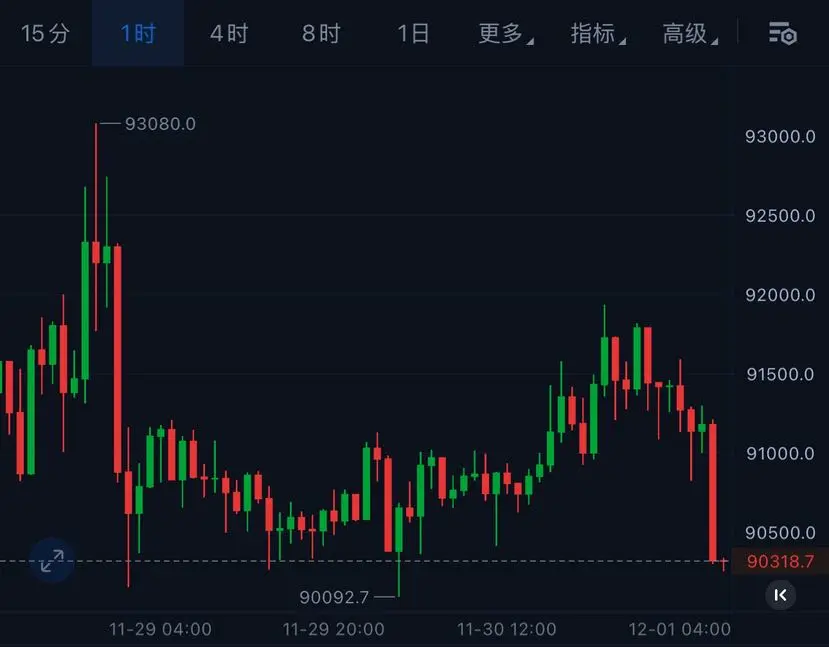
11.29 Saturday midday BTC analysis
The 1-hour chart shows BTC quickly falling back after hitting 93000, but the bottom support is strong, and the daily MACD golden cross is beginning to appear. Overall, it is still in a bullish arrangement, and the low position is a good opportunity for layout.
Personal advice, for reference only (strictly set defense)
BTC can be oscillating around 90000-89000, target 92000-93000
BTC-0.67%

- Reward
- like
- Comment
- Repost
- Share