April 9 Morning Bitcoin Analysis
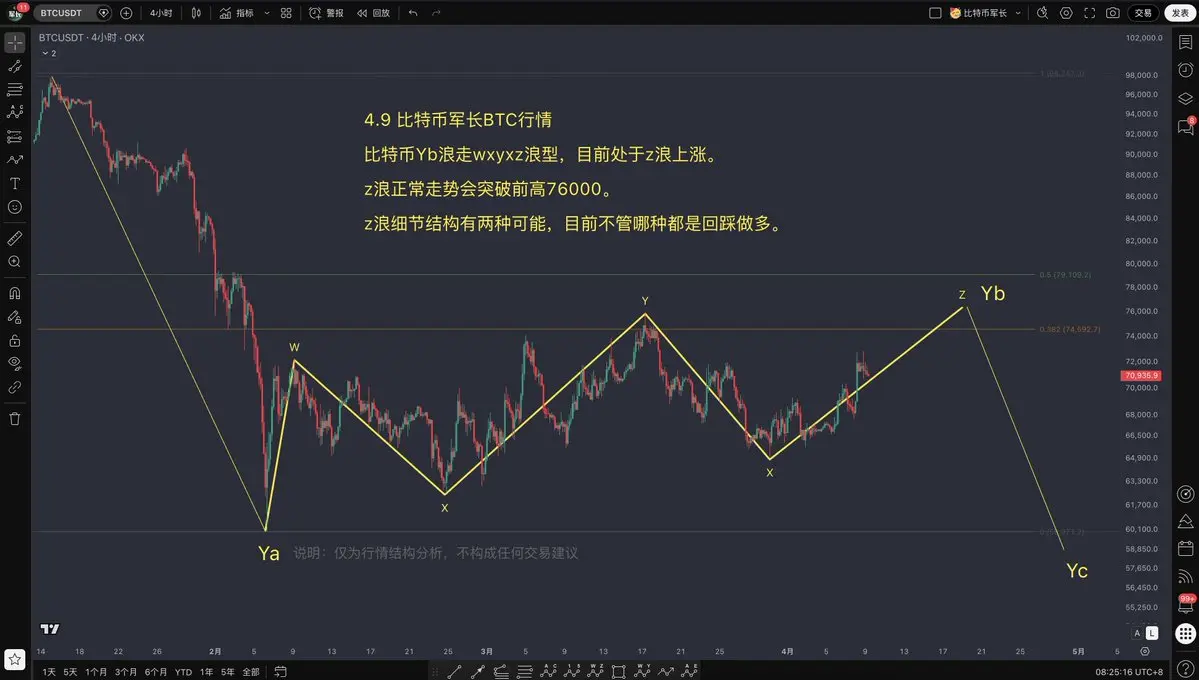
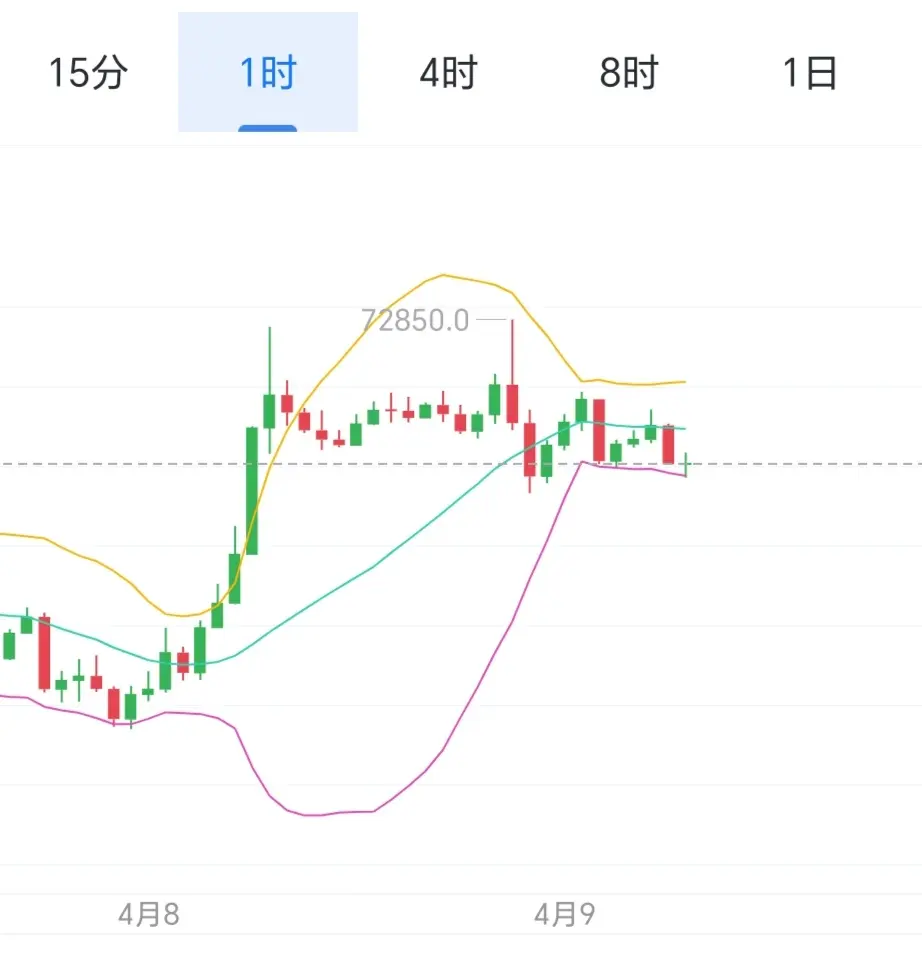
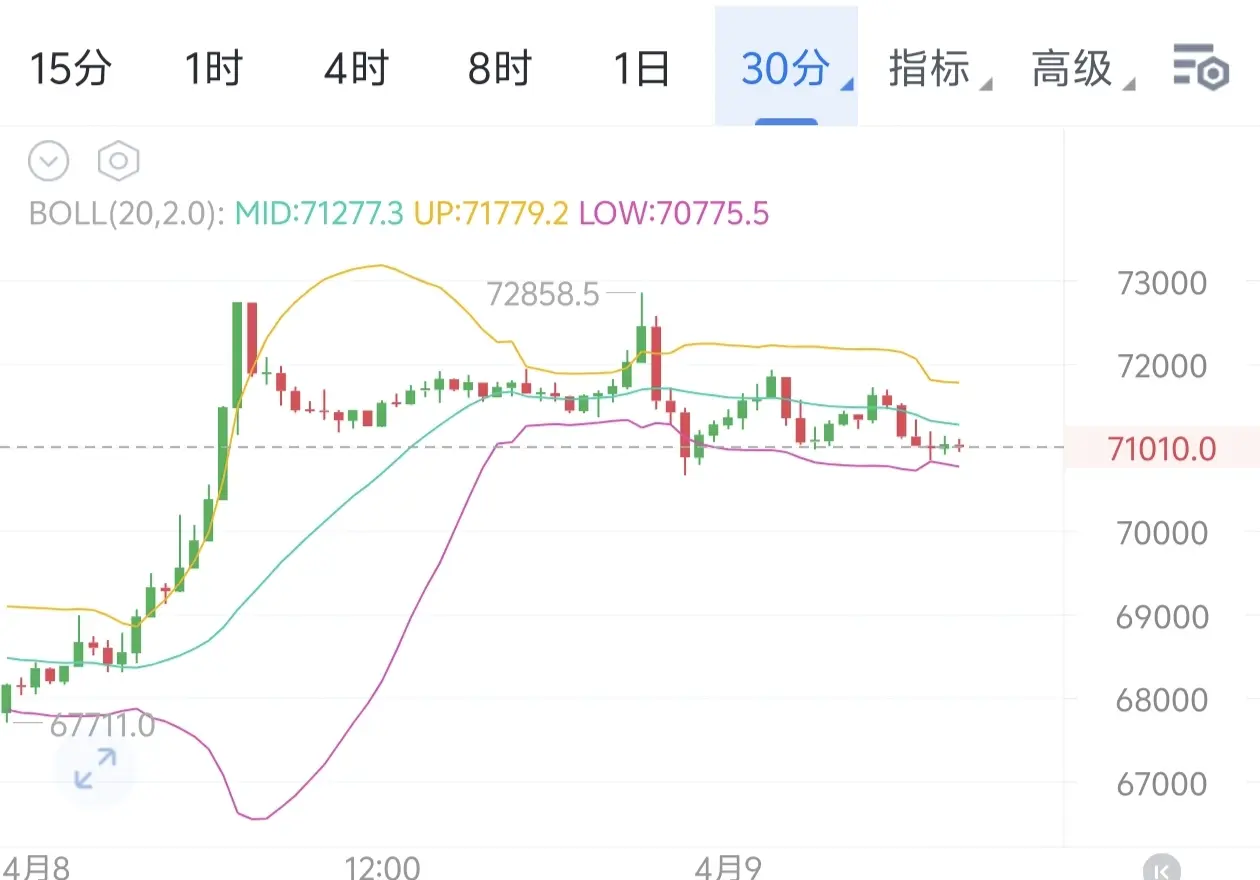
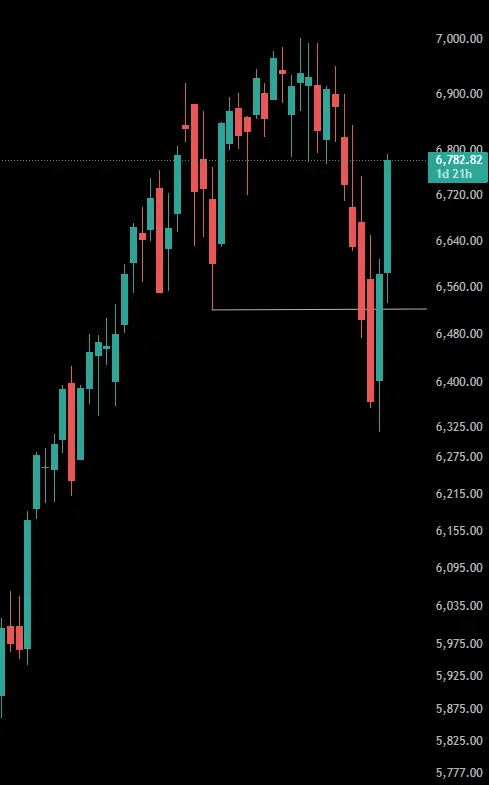
$BTC $ETH Driven by macro factors, Bitcoin launched a sharp rally from 67,711, reaching a peak at the previous high of 72,858 before topping out, then entering a deep correction cycle. The 30-minute candlestick chart shows continuous resistance, with multiple dips toward the support zone of 70,600-70,800. Currently, it has entered a high-level consolidation pattern, with short-term moving averages turning downward. The bears firmly control the short-term trend, and the market is at a critical window for direction choice.
First support: 70,500-70,000, a key def