Trade
Basic
Futures
Futures
Hundreds of contracts settled in USDT or BTC
Options
HOT
Trade European-style vanilla options
Unified Account
Maximize your capital efficiency
Demo Trading
Futures Kickoff
Get prepared for your futures trading
Futures Events
Participate in events to win generous rewards
Demo Trading
Use virtual funds to experience risk-free trading
Earn
Launch
CandyDrop
Collect candies to earn airdrops
Launchpool
Quick staking, earn potential new tokens
HODLer Airdrop
Hold GT and get massive airdrops for free
Launchpad
Be early to the next big token project
Alpha Points
NEW
Trade on-chain assets and enjoy airdrop rewards!
Futures Points
NEW
Earn futures points and claim airdrop rewards
Investment
Simple Earn
Earn interests with idle tokens
Auto-Invest
Auto-invest on a regular basis
Dual Investment
Buy low and sell high to take profits from price fluctuations
Soft Staking
Earn rewards with flexible staking
Crypto Loan
0 Fees
Pledge one crypto to borrow another
Lending Center
One-stop lending hub
VIP Wealth Hub
Customized wealth management empowers your assets growth
Private Wealth Management
Customized asset management to grow your digital assets
Quant Fund
Top asset management team helps you profit without hassle
Staking
Stake cryptos to earn in PoS products
Smart Leverage
NEW
No forced liquidation before maturity, worry-free leveraged gains
GUSD Minting
Use USDT/USDC to mint GUSD for treasury-level yields
More
ASTROLABE
No content yet
ASTROLABE
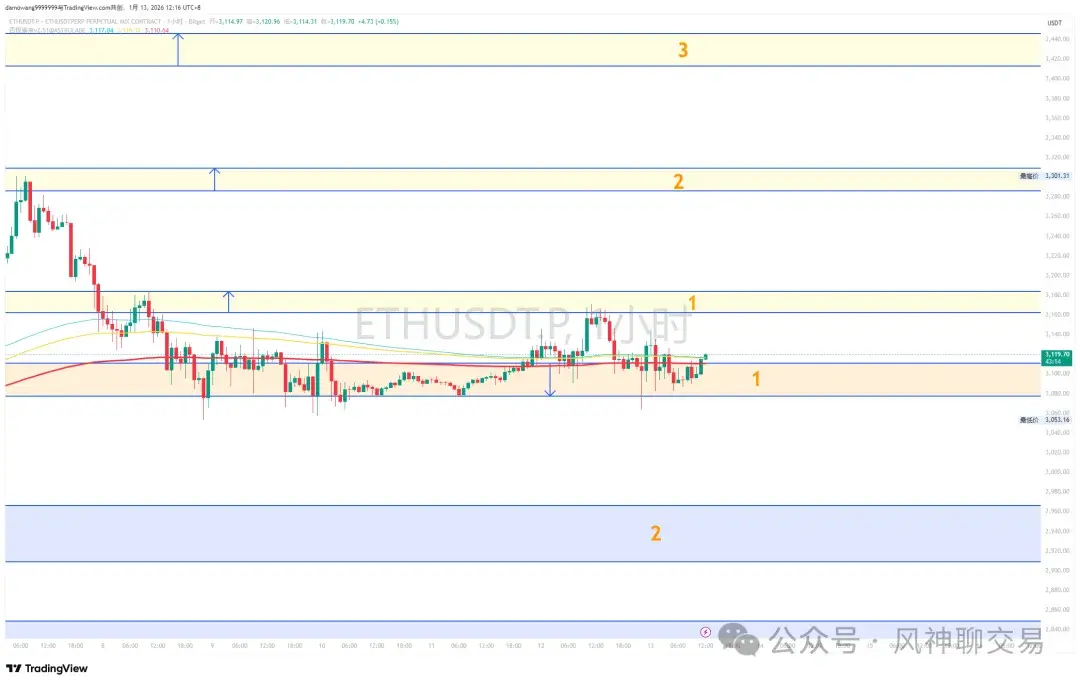
#ETH Intraday Analysis
1️⃣ Structural Interpretation Ethereum continues to fluctuate around 3120 today. The latest market data shows that ETH is facing resistance above without a significant breakout in volume, while support below remains relatively stable, and trading volume has not increased noticeably. This indicates that short-term buyers and sellers are still engaged in a tug-of-war. Structurally, ETH has not formed a clear trend breakout but is instead consolidating in a slightly steady manner within a range.
2️⃣ Capital Flow & On-Chain & Exchange Dynamics Observation
Capital Flow: Alth
View Original1️⃣ Structural Interpretation Ethereum continues to fluctuate around 3120 today. The latest market data shows that ETH is facing resistance above without a significant breakout in volume, while support below remains relatively stable, and trading volume has not increased noticeably. This indicates that short-term buyers and sellers are still engaged in a tug-of-war. Structurally, ETH has not formed a clear trend breakout but is instead consolidating in a slightly steady manner within a range.
2️⃣ Capital Flow & On-Chain & Exchange Dynamics Observation
Capital Flow: Alth
- Reward
- 1
- Comment
- Repost
- Share
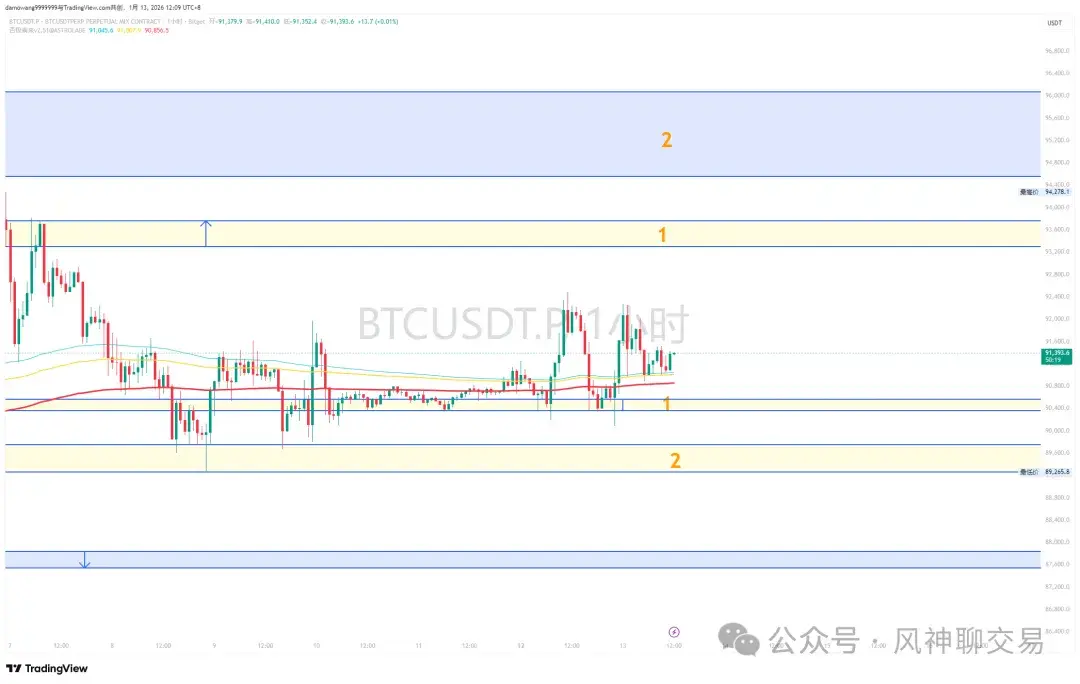
#BTC Intraday Analysis
1️⃣ Structural Interpretation
Today, Bitcoin price continues to fluctuate around 91,000. There is a slight short-term upward attempt but no strong breakout has formed. The market remains in a pattern of rebounds without sustained momentum. Overall, the current structure resembles a high-level consolidation with a rebound attempt, encountering resistance multiple times near the upper levels, while support remains relatively solid around 89,000. Until a clear breakout occurs, this pattern is likely to maintain a range-bound movement.
2️⃣ Capital Flow, On-Chain & Exchange
BTC4.41%
- Reward
- 3
- 1
- Repost
- Share
GateUser-d9148595:
Hold on tight, we're about to take off 🛫#ETH Intraday Analysis
1️⃣ Structural Interpretation
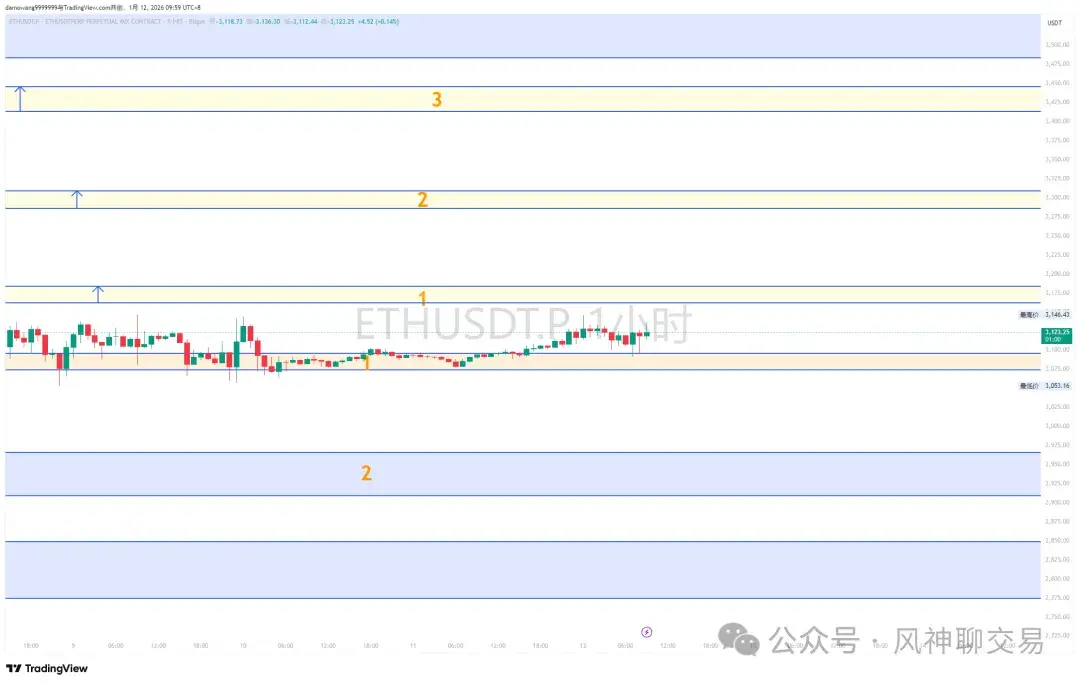
Ethereum's recent movement today has mainly been following Bitcoin's rhythm. According to the latest market data, ETH price is oscillating around 3100. Currently, there is no significant trend of a one-sided move, nor a clear divergence from BTC, showing a sideways trend overall. This structure essentially indicates that ETH is waiting for a more definitive market direction. The key resistance above is around 3300 USD, with the first pressure zone near 3150 USD. A breakout above these levels could lead to a clearer short-term trend.
2️⃣ Cap
View Original1️⃣ Structural Interpretation
Ethereum's recent movement today has mainly been following Bitcoin's rhythm. According to the latest market data, ETH price is oscillating around 3100. Currently, there is no significant trend of a one-sided move, nor a clear divergence from BTC, showing a sideways trend overall. This structure essentially indicates that ETH is waiting for a more definitive market direction. The key resistance above is around 3300 USD, with the first pressure zone near 3150 USD. A breakout above these levels could lead to a clearer short-term trend.
2️⃣ Cap
- Reward
- 1
- Comment
- Repost
- Share
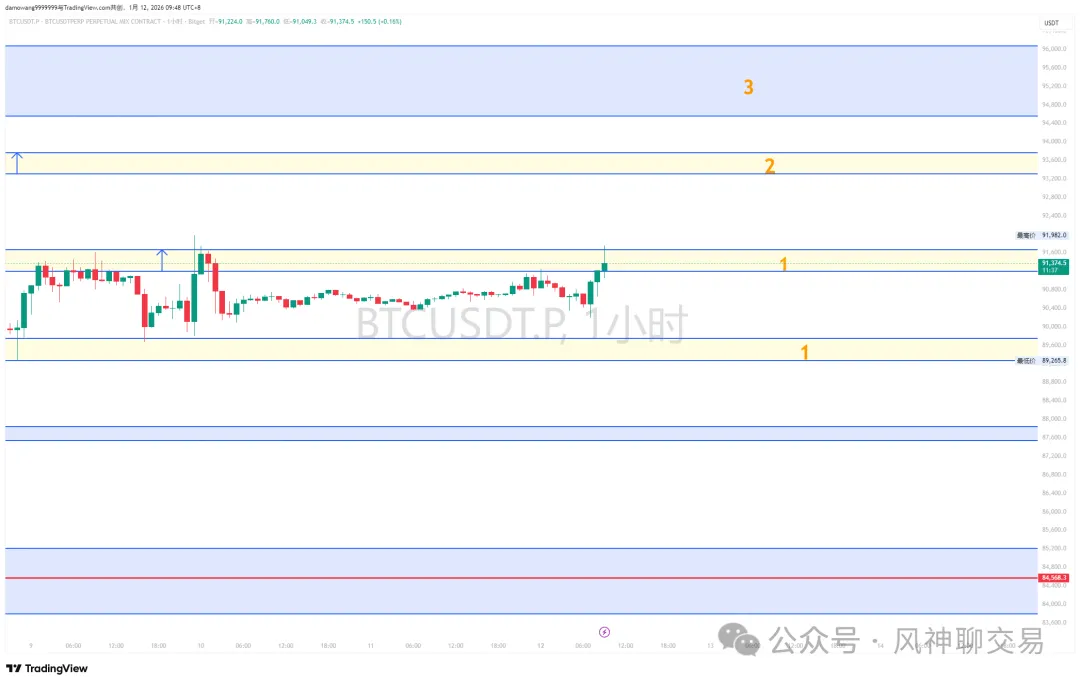
#BTC Intraday Analysis
1️⃣ Structural Interpretation
Today, Bitcoin continues to fluctuate around 91,000 USD. BTC has experienced slight volatility over the past 24 hours, maintaining an overall range of approximately 90,000-92,000 USD, without forming a clear directional trend. Many traders in the market are observing, lacking definitive bullish or bearish signals. However, I personally still lean towards bullishness.
2️⃣ Capital Flow, On-Chain, and Exchange Dynamics Observation
Capital Flow: Recently, there have been no extreme inflows or outflows of funds into BTC or ETF institutions. From
BTC4.41%
- Reward
- 1
- Comment
- Repost
- Share
#BTC Intraday Analysis
1️⃣ Structure Interpretation
BTC is still oscillating back and forth, with its position not much different from recent days. Although there was an attempt to push higher at the beginning of this week, each time it approached the upper resistance zone, it encountered significant resistance and failed to form a sustained upward trend. Overall, the rhythm is that it wants to go up, but the resistance above is not small; going down, there is no strong selling pressure to push the price sharply lower. This creates a feeling of “not strong enough, but not clearly breaking dow
View Original1️⃣ Structure Interpretation
BTC is still oscillating back and forth, with its position not much different from recent days. Although there was an attempt to push higher at the beginning of this week, each time it approached the upper resistance zone, it encountered significant resistance and failed to form a sustained upward trend. Overall, the rhythm is that it wants to go up, but the resistance above is not small; going down, there is no strong selling pressure to push the price sharply lower. This creates a feeling of “not strong enough, but not clearly breaking dow
- Reward
- 1
- Comment
- Repost
- Share
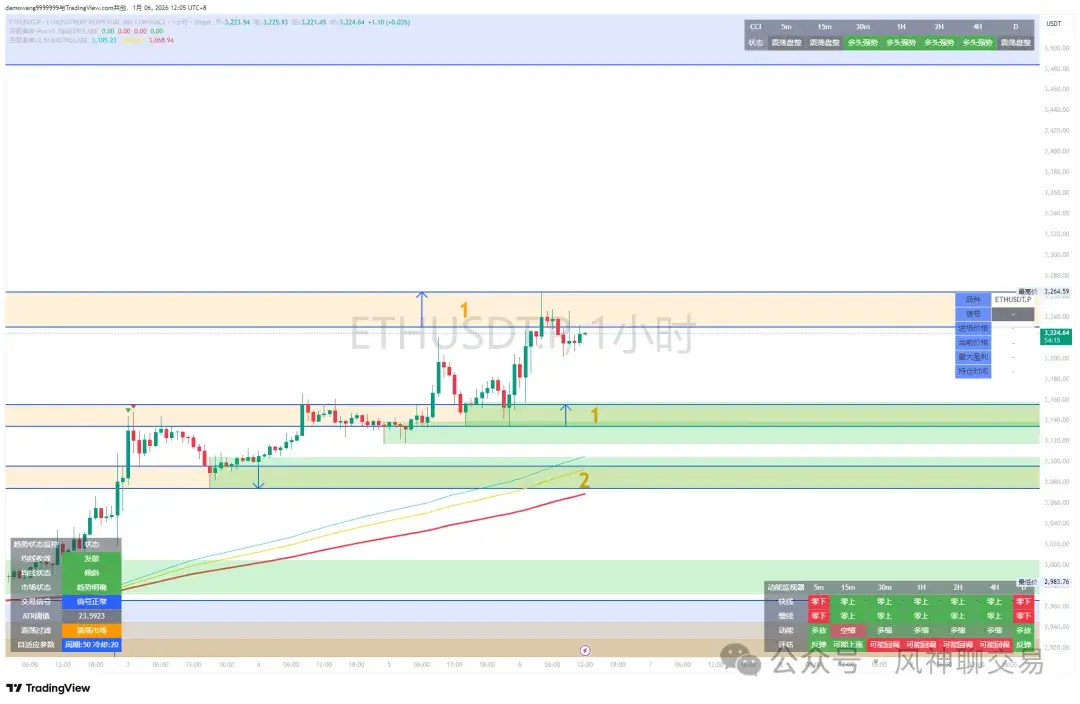
#ETH Intraday Analysis
1️⃣ Structural Interpretation: Ethereum is currently oscillating around 3150. From the market perspective, ETH has not shown a clear decline following BTC; instead, it has maintained its upper support after facing pressure. Although the upward momentum is not strong, the rebound rhythm is more stable compared to Bitcoin. The current structure can be understood as: facing resistance above, but the trading support remains intact, with no obvious signs of a unilateral breakdown.
2️⃣ Capital Flow, On-Chain, and Exchange Dynamics Observation
Capital Flow: Short-term ETH ETF
View Original1️⃣ Structural Interpretation: Ethereum is currently oscillating around 3150. From the market perspective, ETH has not shown a clear decline following BTC; instead, it has maintained its upper support after facing pressure. Although the upward momentum is not strong, the rebound rhythm is more stable compared to Bitcoin. The current structure can be understood as: facing resistance above, but the trading support remains intact, with no obvious signs of a unilateral breakdown.
2️⃣ Capital Flow, On-Chain, and Exchange Dynamics Observation
Capital Flow: Short-term ETH ETF
- Reward
- 1
- Comment
- Repost
- Share
#BTC Intraday Analysis
1️⃣ Structure Interpretation
Today, Bitcoin's market showed short-term downward pressure. The latest行情 indicates BTC once surged close to 94,700 during the week but failed to stabilize, followed by signs of a pullback, currently stabilizing around 90,800. The market feels like a rebound reaching a certain height and then encountering resistance, leading to slight retracement and consolidation. This rhythm suggests that the short-term bullish momentum is easing, with bears actively pressuring the upper zone, causing the price to oscillate repeatedly.
2️⃣ Capital Flow & O
BTC4.41%
- Reward
- 1
- Comment
- Repost
- Share
#ETH Intraday Analysis
1️⃣ Structure Interpretation
Ethereum's price movement today is mainly following Bitcoin's rhythm and continuing to rise. Currently, the price is roughly oscillating around 3200. After several days of continuous upward movement, be cautious of potential risk events. From the 1-hour structure, there is a certain possibility of a pullback, but the 4-hour remains bullish. The key is to determine the depth of the pullback before entering long positions. Structurally, ETH gives the impression that the trend hasn't changed, but the strength is limited. That is to say, when BT
View Original1️⃣ Structure Interpretation
Ethereum's price movement today is mainly following Bitcoin's rhythm and continuing to rise. Currently, the price is roughly oscillating around 3200. After several days of continuous upward movement, be cautious of potential risk events. From the 1-hour structure, there is a certain possibility of a pullback, but the 4-hour remains bullish. The key is to determine the depth of the pullback before entering long positions. Structurally, ETH gives the impression that the trend hasn't changed, but the strength is limited. That is to say, when BT
- Reward
- 3
- 2
- Repost
- Share
OnceTheWoundHeals,ThePainIs :
:
2026 Go Go Go 👊View More
#BTC Intraday Analysis
1️⃣ Structural Interpretation
Bitcoin continues its rebound after the holiday today, aiming to fluctuate around the psychological threshold of 102,000. According to the latest market data, BTC reached a high of 94,744 yesterday and showed some upward momentum in the high-range zone, but there is still a considerable distance from truly stabilizing. (Be cautious of rapid market pullbacks here. There are some uncertain risk events ahead that have not yet fully erupted.) The price is significantly higher than a few days ago, and short-term bullish sentiment is increasing,
BTC4.41%
- Reward
- 2
- 1
- Repost
- Share
EachOrderNeedsToReach200Pa. :
:
Hold on tight, we're about to take off 🛫#ETH Intraday Analysis
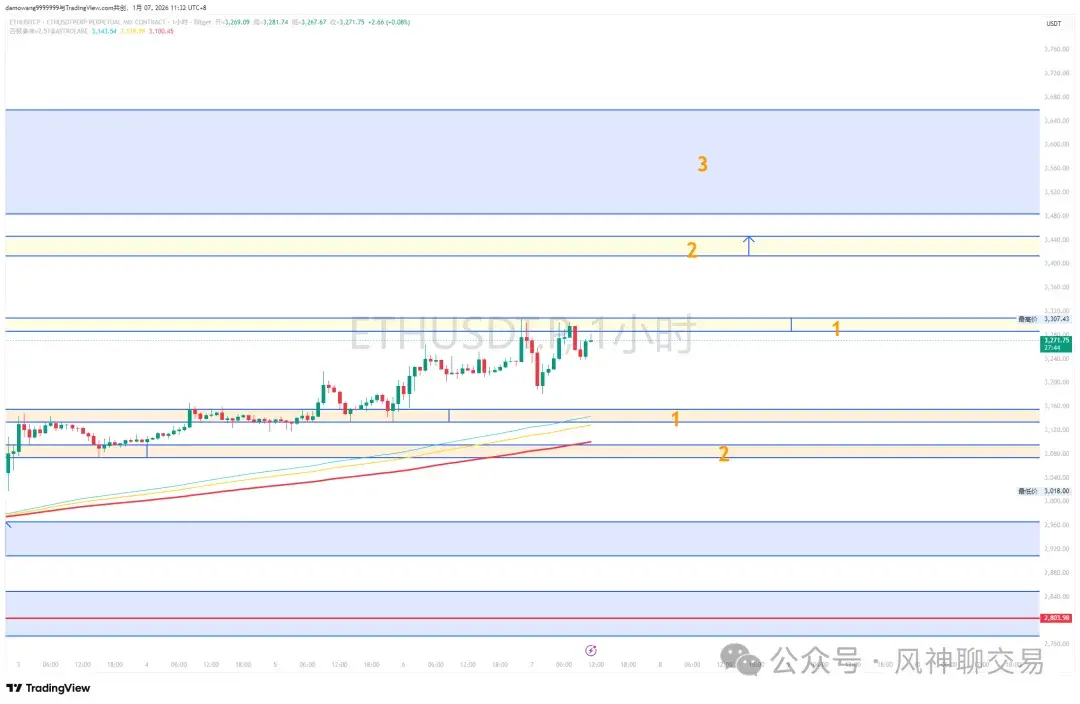
1️⃣ Structural Interpretation: The latest data shows that ETH's highest point has reached around 3265. In previous live sessions, I repeatedly mentioned that the current trend is a daily-level rebound, and it should not be considered the arrival of a major bull market for now.
2️⃣ Capital Flow & On-Chain & Exchange Dynamics Observation
Capital Flow: ETH and ETFs are also experiencing net capital inflows, indicating that some funds are willing to reallocate or add positions in ETH after the holiday, which is a sign of short-term marginal improvement.
On-Chain Data: On-ch
View Original1️⃣ Structural Interpretation: The latest data shows that ETH's highest point has reached around 3265. In previous live sessions, I repeatedly mentioned that the current trend is a daily-level rebound, and it should not be considered the arrival of a major bull market for now.
2️⃣ Capital Flow & On-Chain & Exchange Dynamics Observation
Capital Flow: ETH and ETFs are also experiencing net capital inflows, indicating that some funds are willing to reallocate or add positions in ETH after the holiday, which is a sign of short-term marginal improvement.
On-Chain Data: On-ch
- Reward
- 1
- Comment
- Repost
- Share
Intraday Analysis
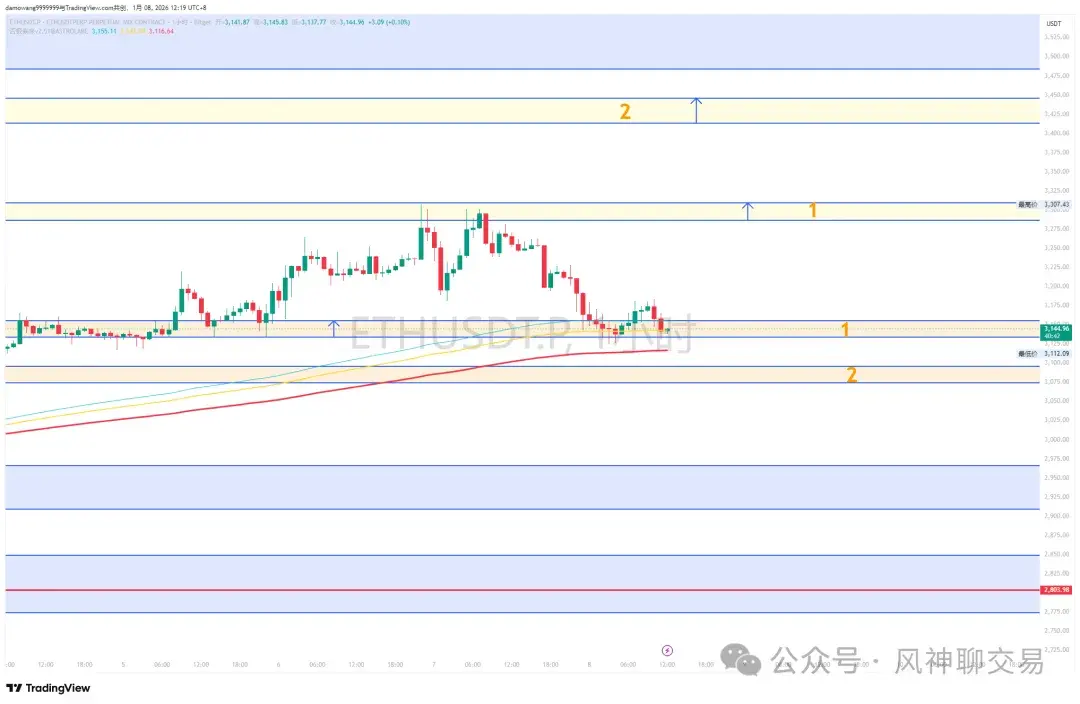
1️⃣ Structural Interpretation: Although today’s market continued its bullish rally after the close, ETH price still oscillates around 3140, with limited upward and downward space. From a structural perspective, ETH is currently stuck in a relatively awkward position, unable to break higher but not showing signs of deterioration either, more like waiting for BTC to give a clear direction.
2️⃣ Capital Flow, On-Chain Data & Exchange Dynamics Observation
Capital Flow: ETH-related capital inflow remains weak, and market risk appetite has not significantly improved, which is especi
View Original1️⃣ Structural Interpretation: Although today’s market continued its bullish rally after the close, ETH price still oscillates around 3140, with limited upward and downward space. From a structural perspective, ETH is currently stuck in a relatively awkward position, unable to break higher but not showing signs of deterioration either, more like waiting for BTC to give a clear direction.
2️⃣ Capital Flow, On-Chain Data & Exchange Dynamics Observation
Capital Flow: ETH-related capital inflow remains weak, and market risk appetite has not significantly improved, which is especi
- Reward
- 1
- Comment
- Repost
- Share
Trending Topics
View More29.52K Popularity
30.04K Popularity
55.32K Popularity
18.97K Popularity
108.6K Popularity
Hot Gate Fun
View More- MC:$3.72KHolders:10.00%
- MC:$3.71KHolders:10.00%
- MC:$3.71KHolders:10.00%
- MC:$3.7KHolders:10.00%
- MC:$3.7KHolders:10.00%
Pin
Gate Square New & Returning Creator Rewards are ongoing!
Your ideas may be more valuable than you think!
Make your first post or come back post to share a $20,000 monthly prize pool!
Post with #MyFirstPostOnSquare to receive a $50 Position Voucher each
Monthly Top Posters and Top Engagers will each earn an extra $50 reward
Your crypto insights could inspire many—start creating today!
👉 https://www.gate.com/postGate Square “Creator Certification Incentive Program” — Recruiting Outstanding Creators!
Join now, share quality content, and compete for over $10,000 in monthly rewards.
How to Apply:
1️⃣ Open the App → Tap [Square] at the bottom → Click your [avatar] in the top right.
2️⃣ Tap [Get Certified], submit your application, and wait for approval.
Apply Now: https://www.gate.com/questionnaire/7159
Token rewards, exclusive Gate merch, and traffic exposure await you!
Details: https://www.gate.com/announcements/article/47889Your First Words Matter!
Share your first post on and split $10,000 in New Year rewards.
Post with #My2026FirstPost to share your New Year wish
2026U Position Voucher, Gate New Year boxes, F1 Red Bull merch await you!
Ends on Jan 15, 2026, 16:00 UTC
2026 starts with this post!Gate 2025 Year-End Gala Square TOP50 List Announced!
The final ranking phase is now live.
Earn Votes by watching live streams and posting.
30 Votes = 1 chance — support your favorite creators now!
👉 https://www.gate.com/activities/community-vote-2025
iPhone 17 Pro Max, JD gift cards, Mi Band, Gate merch await you!
Creators are welcome to rally fans to climb the rankings and win rewards!
Voting ends: Jan 20, 02:00 UTC
Details: https://www.gate.com/announcements/article/48693