
Date: Tue, Dec 30, 2025 | 06:35 PM GMT
The broader cryptocurrency market is showing modest strength, with both Bitcoin (BTC) and Ethereum (ETH) trading in the green. This steady performance among major assets has helped stabilize overall market sentiment, creating room for select altcoins — including** eCash (XEC) **— to develop constructive technical setups.
XEC is trading with modest gains, but more importantly, its price structure is beginning to reflect a meaningful shift, as the chart now points toward a potential bullish continuation setup forming beneath key resistance.
Source: Coinmarketcap
Rounding Bottom in Play
On the 4-hour timeframe, eCash is forming a textbook rounding bottom — a classic bullish reversal pattern that typically emerges after prolonged selling pressure. This structure reflects a slow but steady transition from distribution to accumulation, where sellers gradually lose control and buyers begin stepping in with conviction.
Earlier, XEC faced strong rejection near the $0.00001221 neckline zone, which triggered a sharp decline. That sell-off eventually found support near the $0.000010 region, a level that repeatedly acted as a demand zone. Each attempt to push price lower was absorbed, preventing a deeper breakdown and helping establish a rounded base.
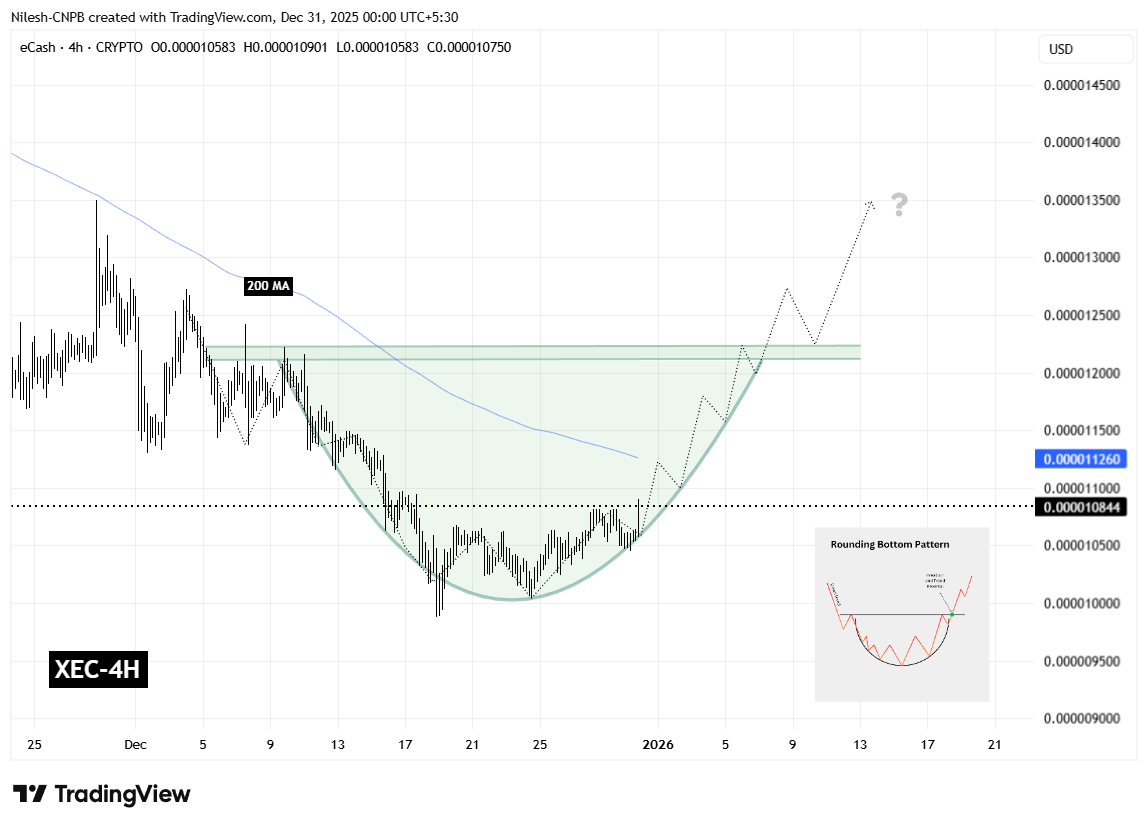
eCash (XEC) 4H Chart/Coinsprobe (Source: Tradingview)
Since then, XEC’s price action has started to curve higher in a smooth, controlled manner. The gradual recovery toward the $0.00001221 resistance suggests selling pressure is fading, while accumulation continues to strengthen. This type of rounded structure often precedes a more decisive trend shift once key resistance levels are reclaimed.
What’s Next for XEC?
For the rounding bottom pattern to fully activate, XEC must reclaim the 200-hour moving average, currently hovering near the $0.00001126 region. A decisive break and sustained hold above this level would confirm a momentum shift and signal that buyers are regaining control after an extended corrective phase.
Beyond the moving average, the most critical hurdle remains the neckline resistance around $0.00001221. A clean breakout above this zone would validate the broader reversal structure and could open the door for a bullish expansion toward the $0.00001442 region, which aligns with the projected breakout target from the rounding bottom pattern.
Until these levels are reclaimed, the setup remains in development. Short-term pullbacks or sideways consolidation are still possible if price struggles near the 200-hour MA. However, as long as XEC continues to hold above the rounded base, the broader bottoming structure remains intact.
Overall, eCash is approaching an important technical inflection point. The emerging rounding bottom, improving price structure, and proximity to major resistance levels suggest the coming sessions could play a decisive role in shaping XEC’s next directional move.
Disclaimer: The views and analysis presented in this article are for informational purposes only and reflect the author’s perspective, not financial advice. Technical patterns and indicators discussed are subject to market volatility and may or may not yield the anticipated results. Investors are advised to exercise caution, conduct independent research, and make decisions aligned with their individual risk tolerance.
Disclaimer: The information on this page may come from third parties and does not represent the views or opinions of Gate. The content displayed on this page is for reference only and does not constitute any financial, investment, or legal advice. Gate does not guarantee the accuracy or completeness of the information and shall not be liable for any losses arising from the use of this information. Virtual asset investments carry high risks and are subject to significant price volatility. You may lose all of your invested principal. Please fully understand the relevant risks and make prudent decisions based on your own financial situation and risk tolerance. For details, please refer to
Disclaimer.
Related Articles
Wintermute: Energy is building in the crypto market, but the direction is unclear—there may be a sudden surge in trading activity.
Wintermute says the easing window for the situation is coming to an end. The cap on risk assets is lower than before, making it difficult for Bitcoin to stay above $700,000. If diplomatic progress goes smoothly and oil prices pull back, Bitcoin could rebound to $70,000–$74,000; if conditions deteriorate, it could fall to $60,000, or even to $50,000–$55,000. The extent of market volatility may exceed current pricing.
GateNews24m ago
Bitcoin Breaks Crucial Neckline Area of Bullish Pattern, Analysts Prepare for $50,000 BTC Prices
Bitcoin breaks crucial neckline area of bullish pattern.
This has sent analysts into a bearish frenzy, expecting lower prices.
The price of BTC is expected to hit targets between $48,000 and $55,000 next.
The crypto community continues to watch price charts closely to determine what
CryptoNewsLand55m ago
We Asked 2 AIs: What Must XRP Do to Escape the Ongoing Crisis?
Alongside the rest of the crypto market, Ripple’s cross-border token tried to break out in the middle of the business week, surging to a monthly peak of over $1.60. However, the subsequent rejection pushed it south to under $1.50 as of press time.
Even the most recent developments on the Ripple
CryptoPotato56m ago
Bearish sentiment builds in crypto as volatility and hedging rise
The crypto market exhibited signs of volatility on Tuesday, with bitcoin BTC$66,223.90 spiking to $68,300 shortly after midnight UTC before tumbling back to $66,500.
The initial spike was spurred by reports that U.S. President Donald Trump was willing to end the war in Iran without the Strait of
CoinDesk1h ago
Stablecoins grow faster than expected as more new applications emerge
Stablecoin is experiencing faster growth than expected, driven by new applications like AI payments. However, Standard Chartered maintains its forecast of a $2 trillion market cap by 2028.
TapChiBitcoin1h ago
PI Network (PI) Price Predictions for This Week
PI Network's price has corrected from $0.30 to $0.17, indicating a 40% drop. Currently, it hovers around $0.18, presenting a bearish outlook unless it surpasses $0.20. Volume remains low, suggesting indecision among sellers, while the RSI stays under 50, signaling further potential declines.
CryptoPotato1h ago
