Trade
Basic
Futures
Futures
Hundreds of contracts settled in USDT or BTC
Options
HOT
Trade European-style vanilla options
Unified Account
Maximize your capital efficiency
Demo Trading
Futures Kickoff
Get prepared for your futures trading
Futures Events
Participate in events to win generous rewards
Demo Trading
Use virtual funds to experience risk-free trading
Earn
Launch
CandyDrop
Collect candies to earn airdrops
Launchpool
Quick staking, earn potential new tokens
HODLer Airdrop
Hold GT and get massive airdrops for free
Launchpad
Be early to the next big token project
Alpha Points
NEW
Trade on-chain assets and enjoy airdrop rewards!
Futures Points
NEW
Earn futures points and claim airdrop rewards
Investment
Simple Earn
Earn interests with idle tokens
Auto-Invest
Auto-invest on a regular basis
Dual Investment
Buy low and sell high to take profits from price fluctuations
Soft Staking
Earn rewards with flexible staking
Crypto Loan
0 Fees
Pledge one crypto to borrow another
Lending Center
One-stop lending hub
VIP Wealth Hub
Customized wealth management empowers your assets growth
Private Wealth Management
Customized asset management to grow your digital assets
Quant Fund
Top asset management team helps you profit without hassle
Staking
Stake cryptos to earn in PoS products
Smart Leverage
NEW
No forced liquidation before maturity, worry-free leveraged gains
GUSD Minting
Use USDT/USDC to mint GUSD for treasury-level yields
More
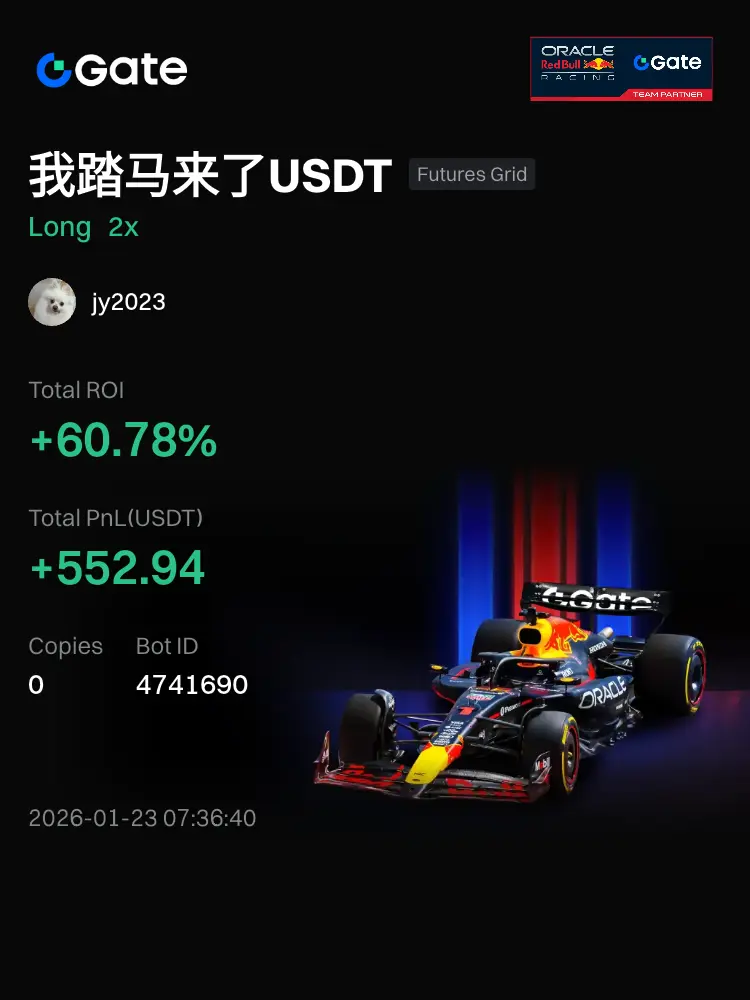
jy2023
#Bots#I'm currently using the 我踏马来了USDT Futures Grid bot on Gate. The ROI since the bot's creation has reached +60.78%
- Reward
- like
- Comment
- Repost
- Share
Brothers, don't play this coin anymore, it's a scam coin. It hasn't even reached the 63 price level. Are you kidding me?
View Original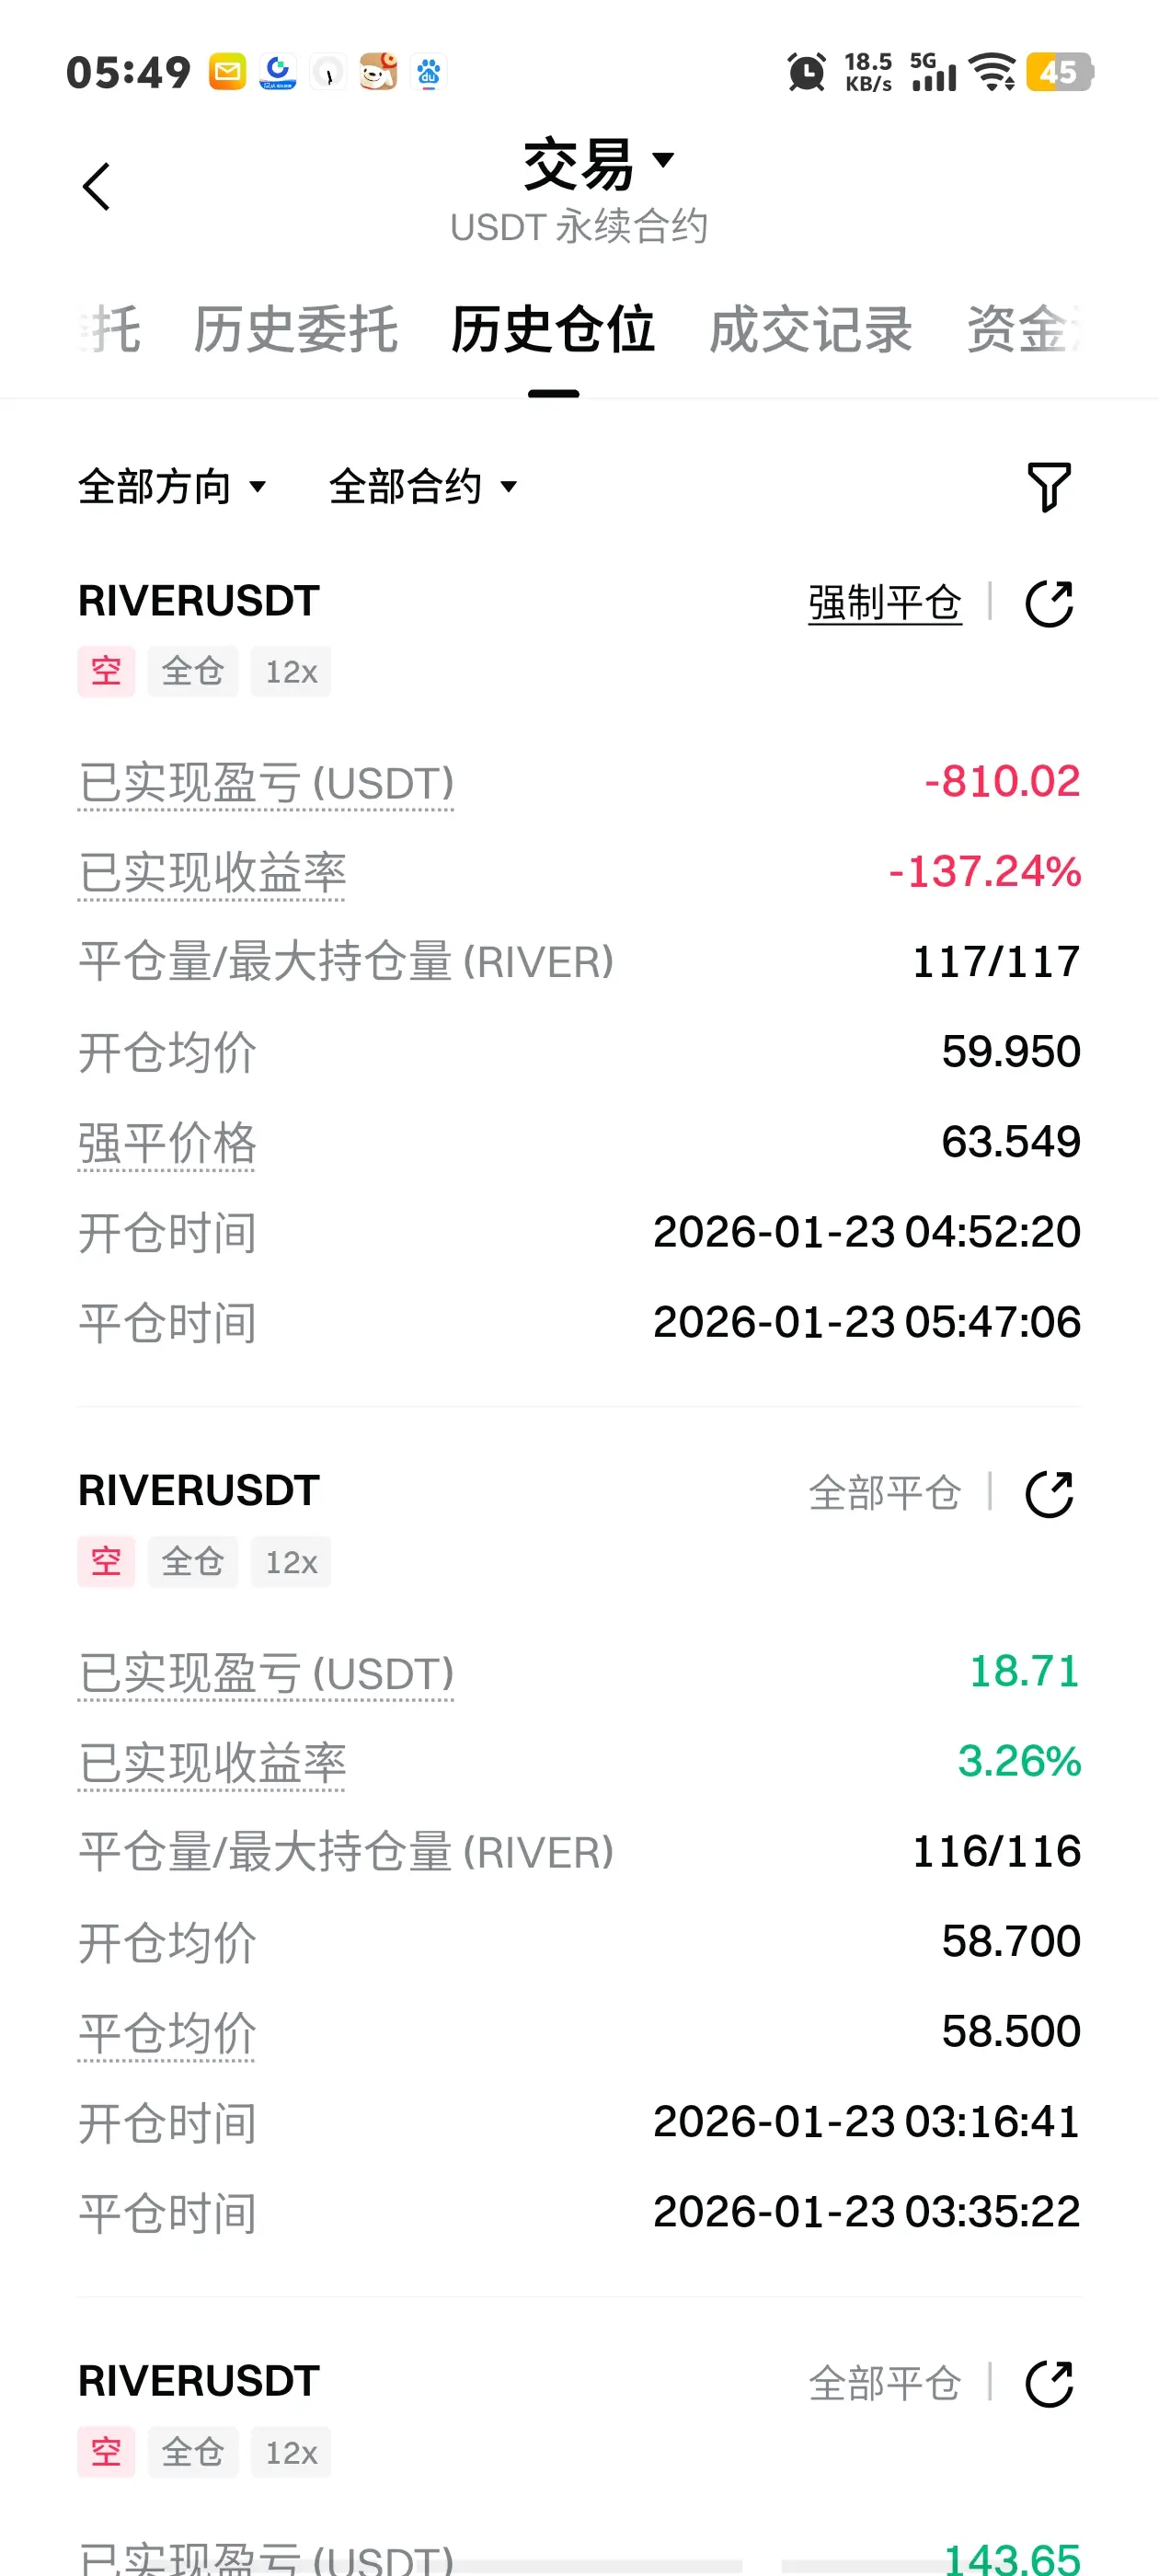
- Reward
- like
- 2
- Repost
- Share
柏仔666 :
:
2026 Go Go Go 👊View More
Hello @grok, remove the bad ones and keep the top three.
View Original
- Reward
- like
- Comment
- Repost
- Share
1
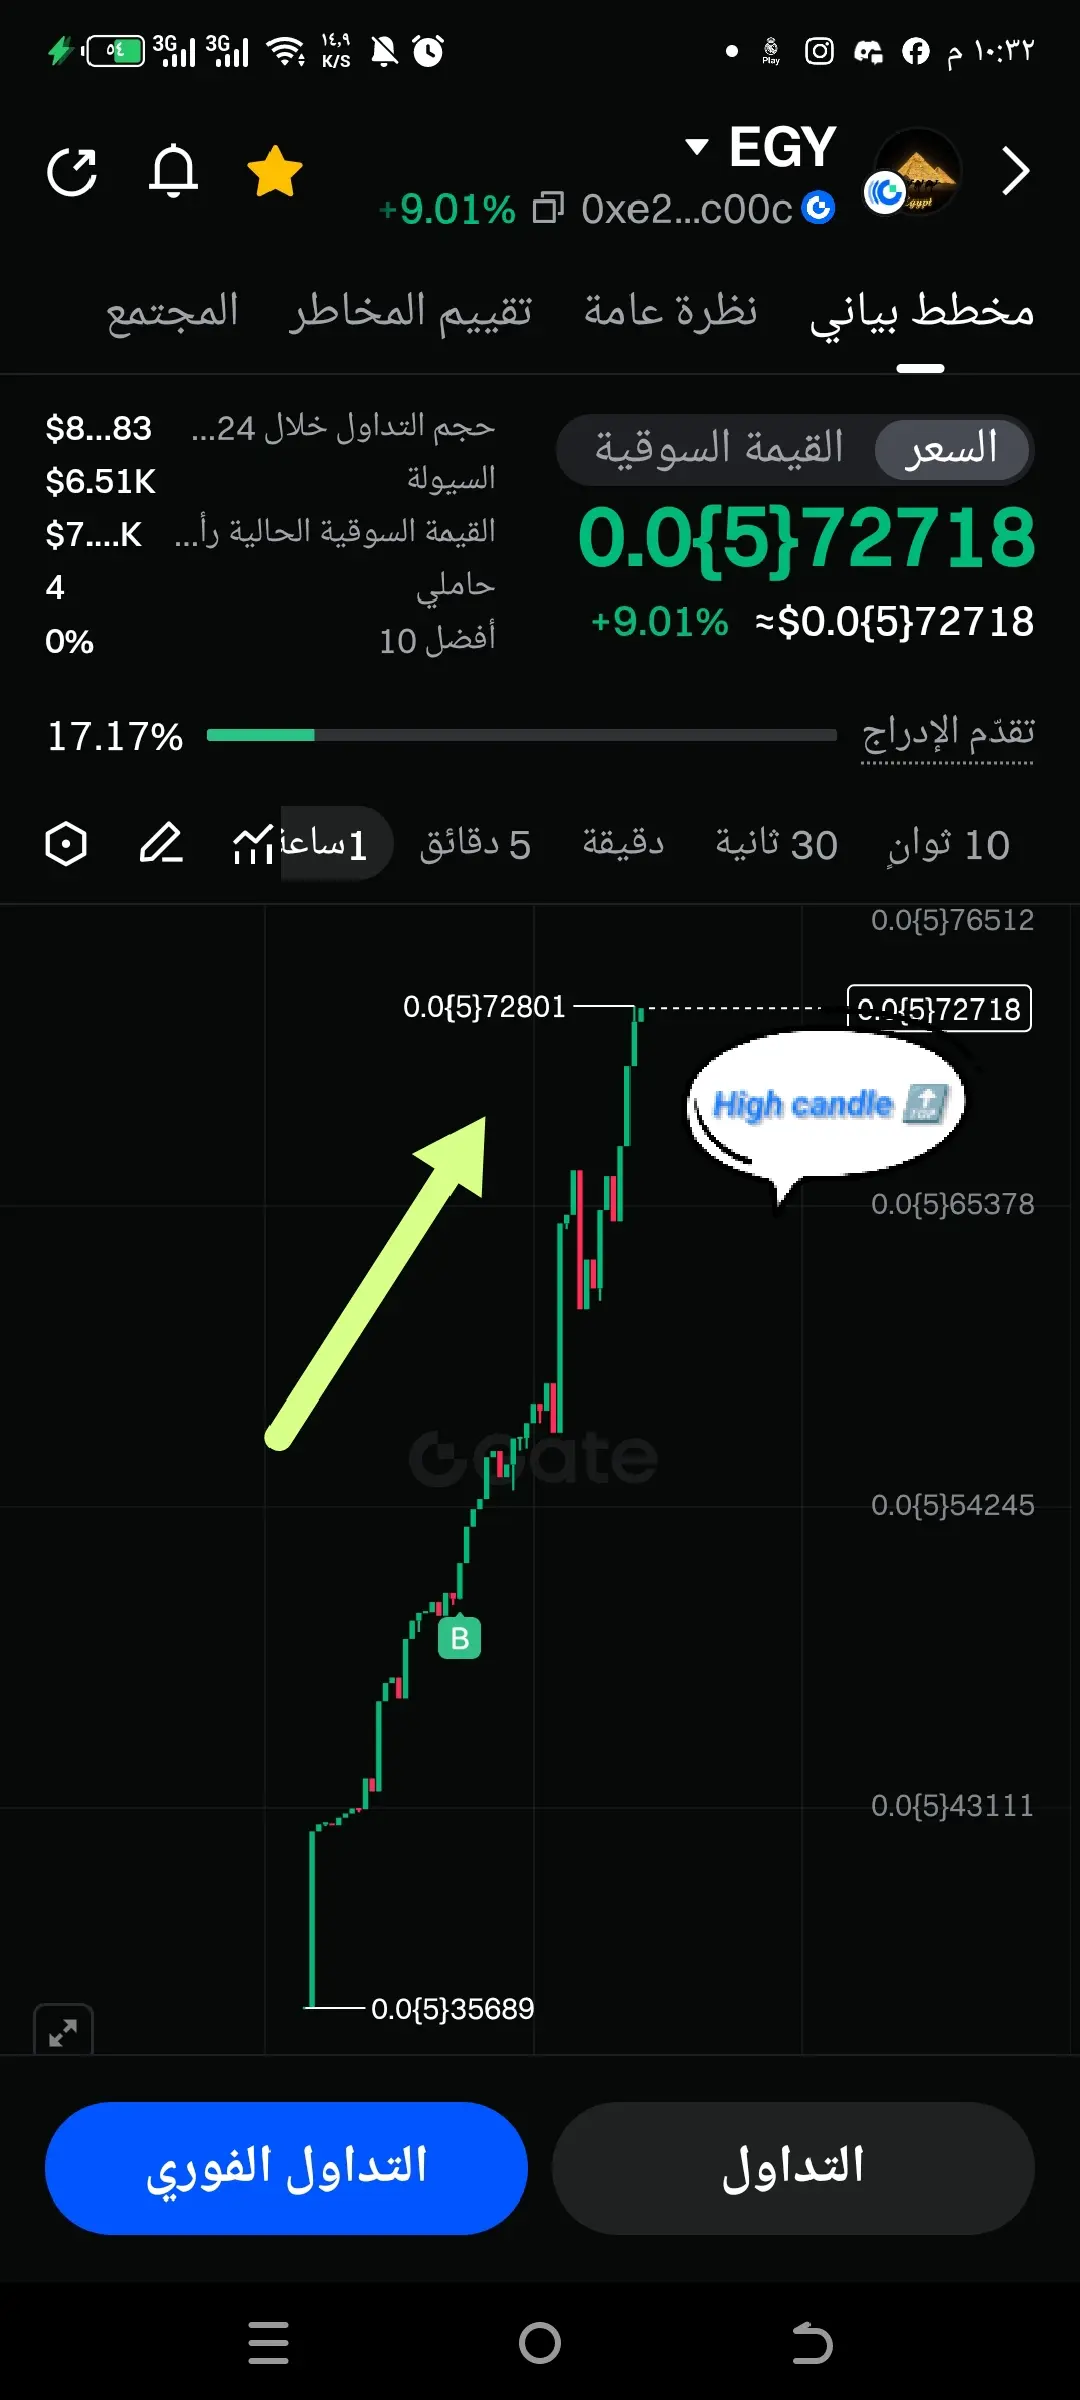
gt
Created By@Ivy
Listing Progress
0.99%
MC:
$3.52K
Create My Token
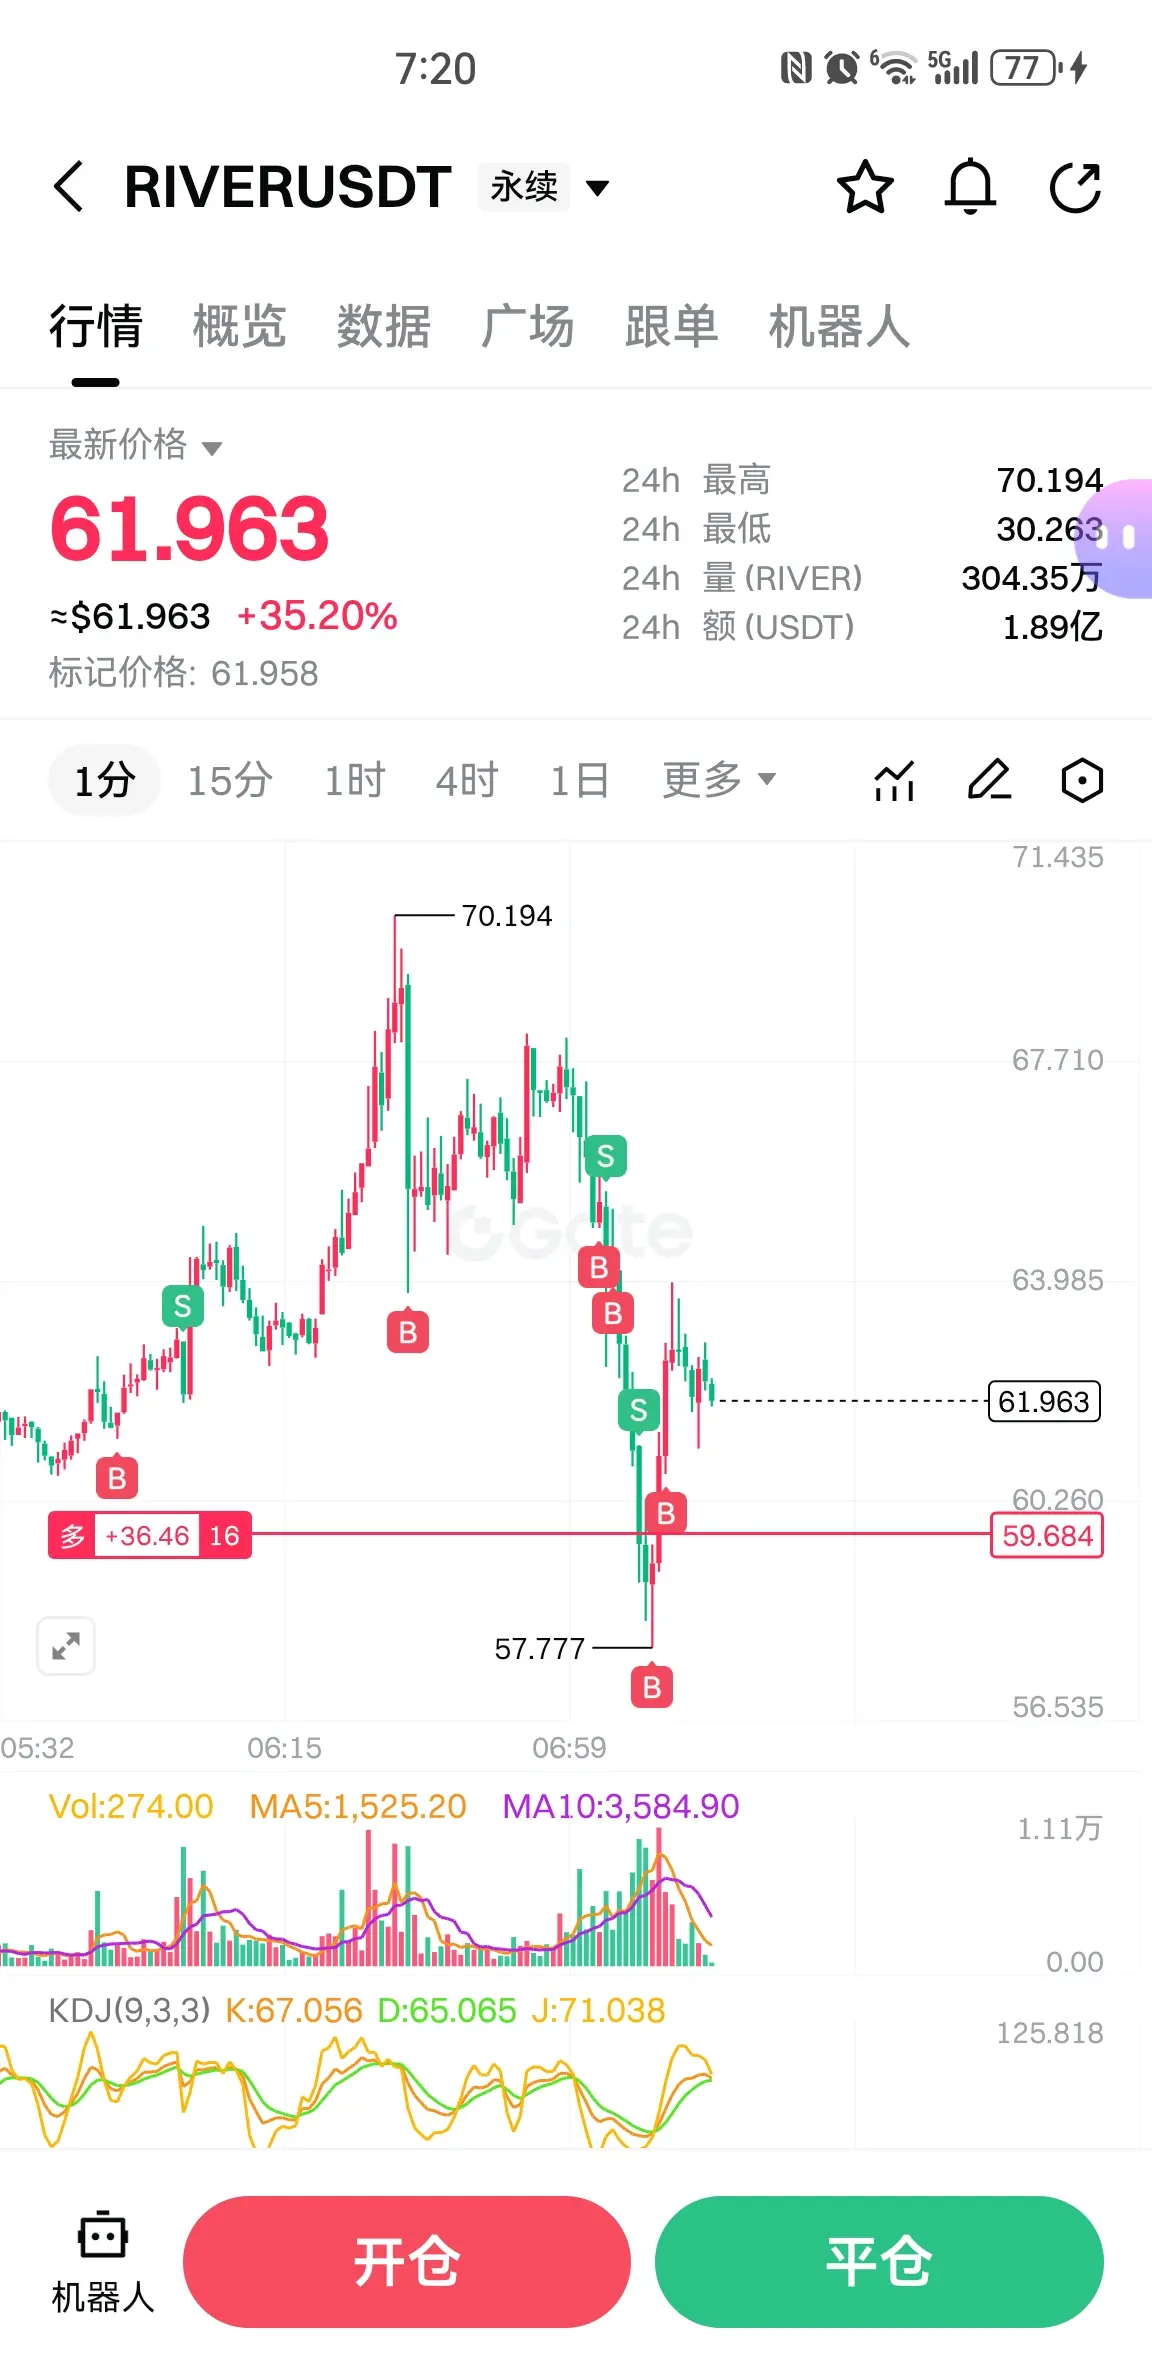
$RIVER Kill multiple armies, ready to push to 80?
View Original
[The user has shared his/her trading data. Go to the App to view more.]
- Reward
- like
- Comment
- Repost
- Share

$BTC Liquidity Signal
Heavy long liquidations are stacking again.
This is a classic liquidity sweep before a volatility move.
Price is compressing while liquidations expand —
that divergence usually comes right before a breakout.
Smart money follows liquidity, not candles.
#BTC #Bitcoin #Crypto
Heavy long liquidations are stacking again.
This is a classic liquidity sweep before a volatility move.
Price is compressing while liquidations expand —
that divergence usually comes right before a breakout.
Smart money follows liquidity, not candles.
#BTC #Bitcoin #Crypto
BTC-0,73%


- Reward
- 1
- Comment
- Repost
- Share
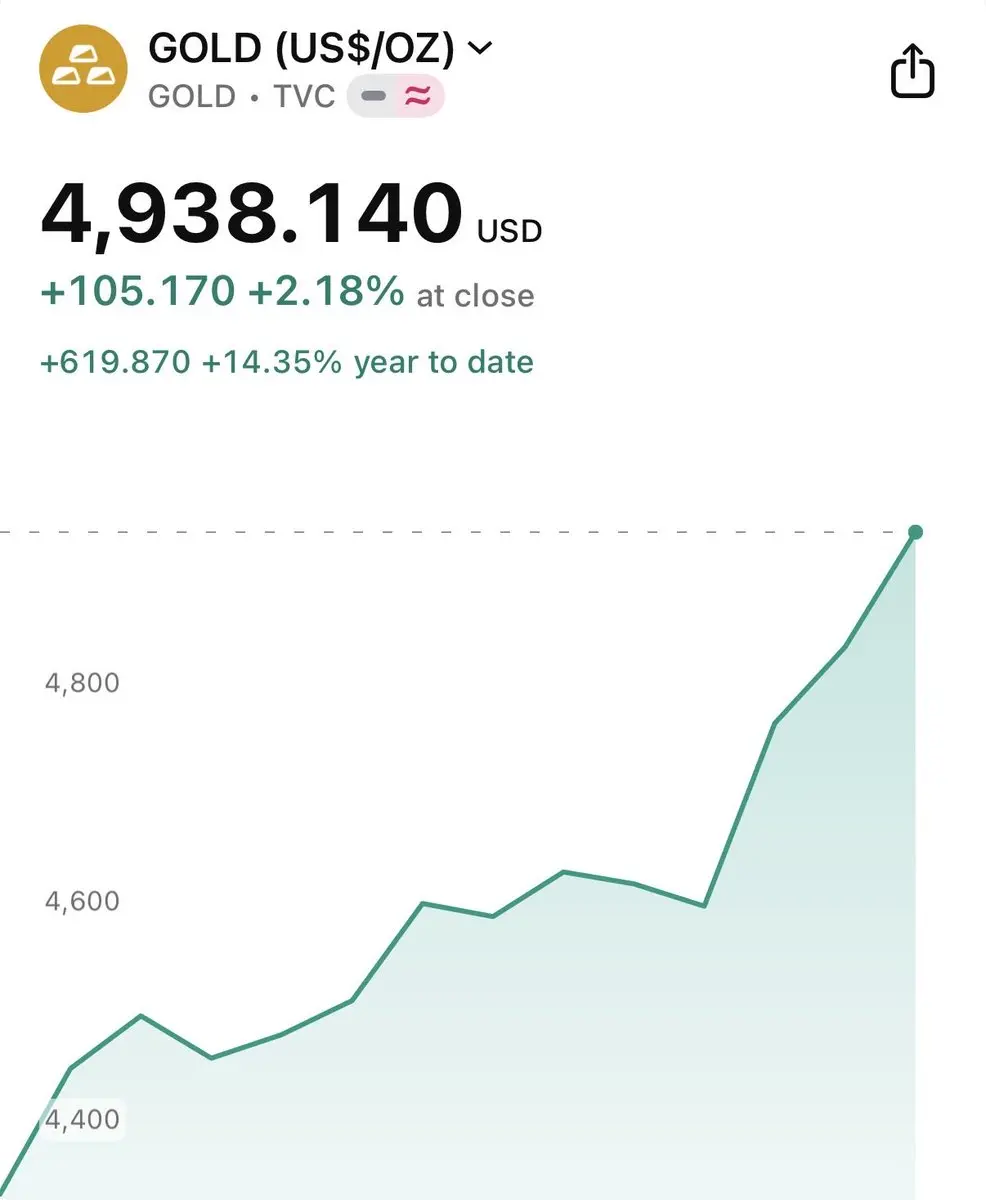
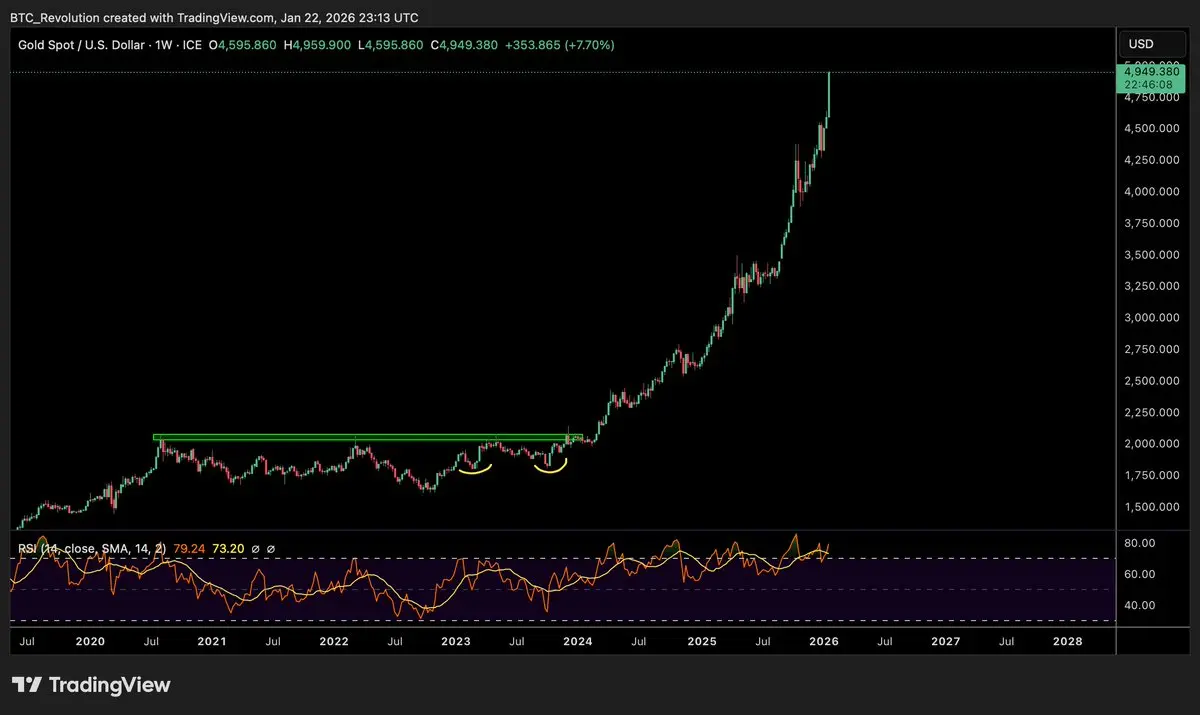
I’m getting sick to my stomach watching gold go to new all time highs every hour. Either the world is ending and the worst depression in history is coming or Bitcoin is going to $500,000. I still don’t know.
BTC-0,73%
- Reward
- like
- Comment
- Repost
- Share
- Reward
- like
- Comment
- Repost
- Share
Thanks Seeker Dan, thanks Gate
Today I gained a lot of experience from everything. Gate.io, wishing you continued success and even greater growth.
View OriginalToday I gained a lot of experience from everything. Gate.io, wishing you continued success and even greater growth.
- Reward
- 2
- Comment
- Repost
- Share
Bitcoin Target of $185,000: Insightful Projections from Tiger Research
The cryptocurrency market is always an exciting and volatile environment. Recent downturns have left investors feeling uneasy, but some analysts still paint a positive picture. The latest report from Tiger Research, an Asia-based crypto and Web3 research firm, seems to offer a glimmer of hope to the market.
Tiger Research has announced a target of $185,500 for Bitcoin in the short term. This ambitious target has sparked considerable curiosity within the market. However, analysts also emphasized that the $84,000 level remai
BTC-0,73%

- Reward
- 30
- 32
- Repost
- Share
Discovery:
DYOR 🤓View More

- Reward
- 4
- 2
- Repost
- Share
CWSJ999 :
:
2026 Go Go Go 👊View More
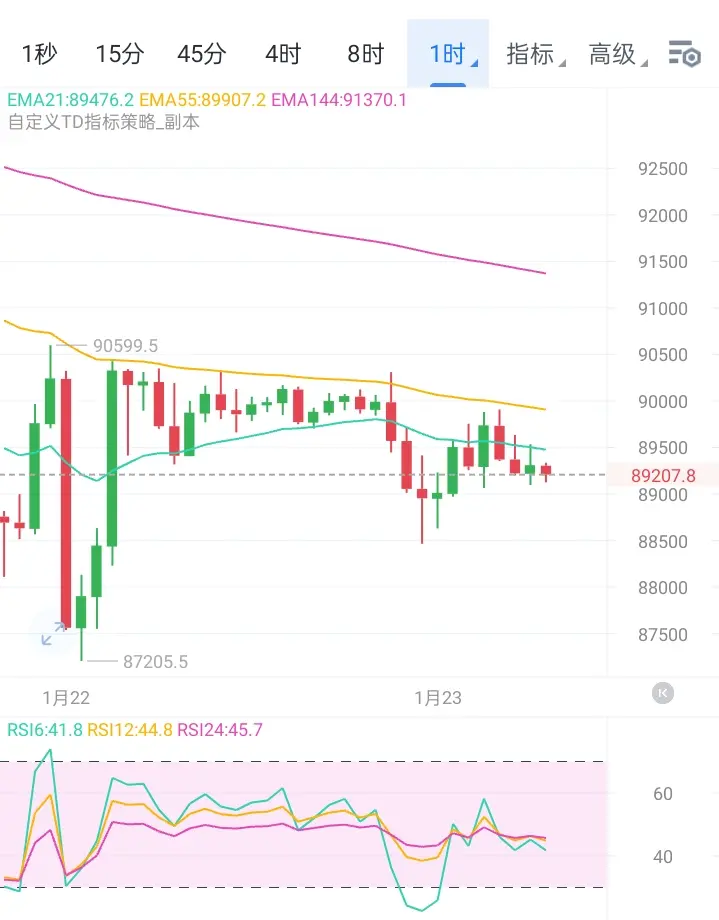
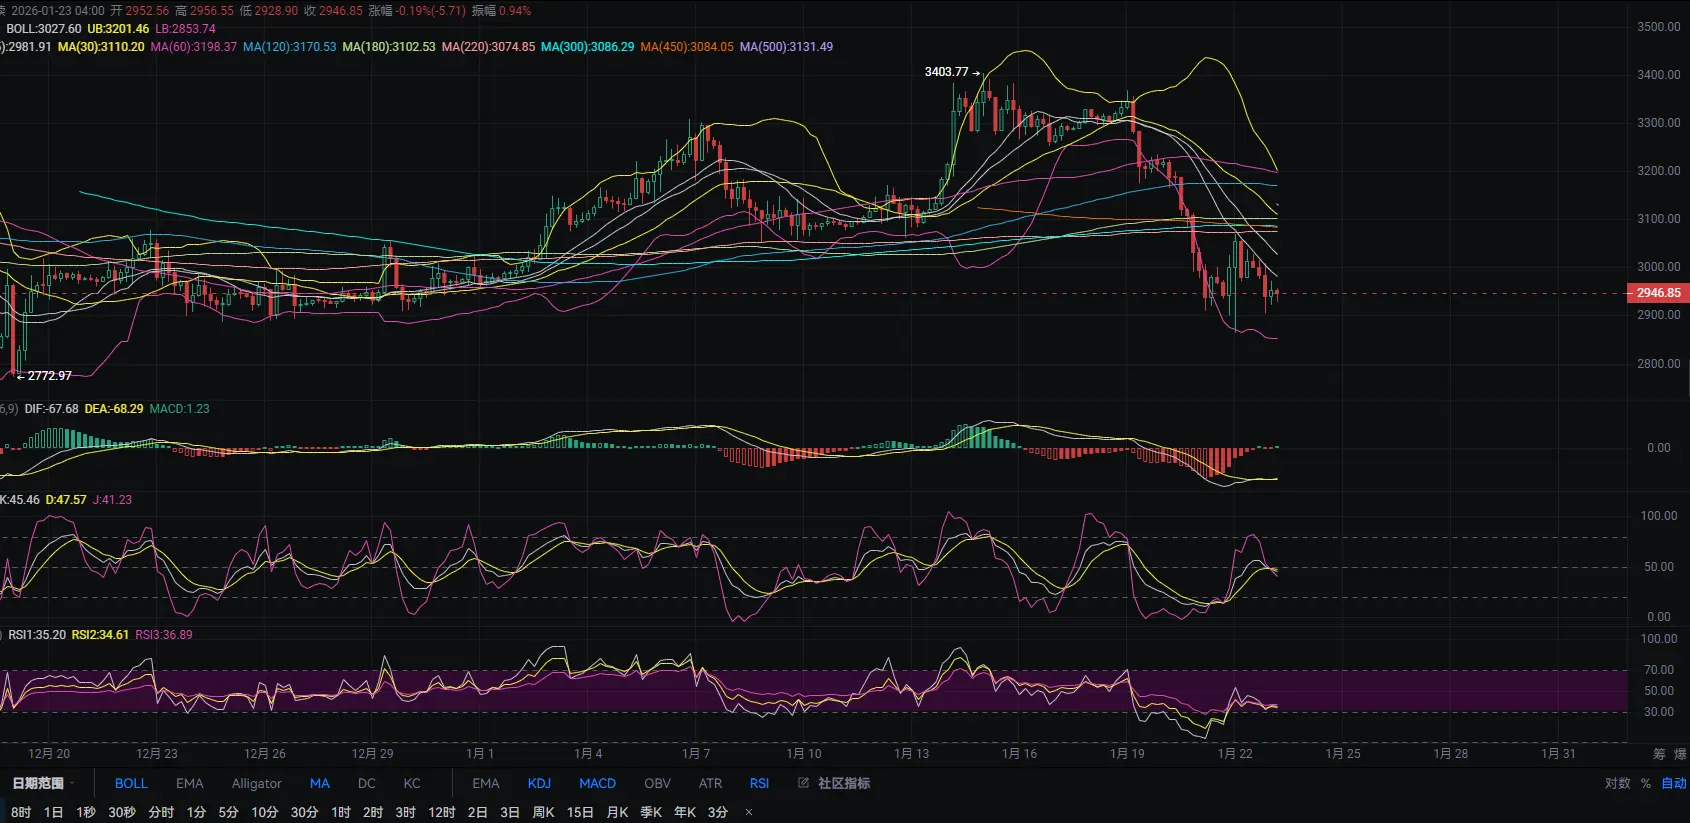
Based on price action observation, Bitcoin repeatedly oscillates around the key psychological level of $90,000 but fails to break through effectively, indicating strong selling pressure at this level. The 4-hour chart forms a potential double top pattern, with the neckline support around $88,500. If the price drops sharply below this level with increased volume, the short-term top structure will be confirmed, potentially triggering a technical sell-off, testing the support zone of $86,500-$85,500.
Momentum indicators issue a divergence warning signal. Although the price hovers near $90,000, th
Momentum indicators issue a divergence warning signal. Although the price hovers near $90,000, th
BTC-0,73%
- Reward
- like
- Comment
- Repost
- Share
- Reward
- like
- Comment
- Repost
- Share
DLDB
达利担保
Created By@SeventeenBrother
Listing Progress
0.00%
MC:
$3.41K
Create My Token
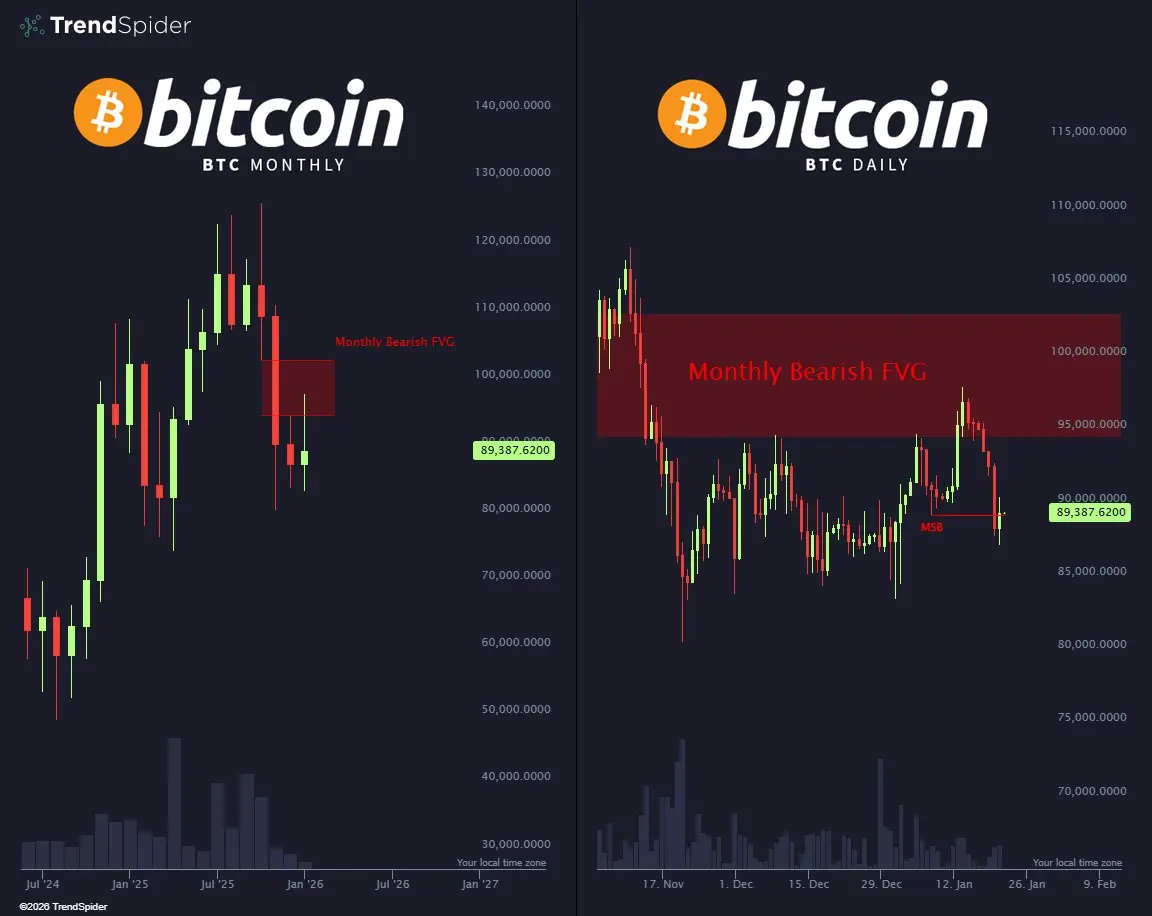
Bitcoin at $89,000... Is this a real rally or a trap for buyers? 📉₿
-
The chart is more reliable than news reports.
The monthly chart shows that we are now inside the "Bearish FVG" (Bearish FVG).
This red zone is not just a color on the screen,
but a previous "imbalance" area,
where sellers had the upper hand,
and now the price is testing whether sellers are still there.
-
The answer comes from the daily chart:
An (MSB) signal or "break of market structure" has appeared.
In simple terms: the buying momentum that pushed the price up is starting to fade,
and institutions are beginning to take p
-
The chart is more reliable than news reports.
The monthly chart shows that we are now inside the "Bearish FVG" (Bearish FVG).
This red zone is not just a color on the screen,
but a previous "imbalance" area,
where sellers had the upper hand,
and now the price is testing whether sellers are still there.
-
The answer comes from the daily chart:
An (MSB) signal or "break of market structure" has appeared.
In simple terms: the buying momentum that pushed the price up is starting to fade,
and institutions are beginning to take p
BTC-0,73%
MC:$39.49KHolders:4
89.22%
- Reward
- like
- Comment
- Repost
- Share

- Reward
- 1
- Comment
- Repost
- Share
Viewing the Top Market Coins Spot Chart and comparing them
1
- Reward
- 1
- Comment
- Repost
- Share

Fear of regulation is giving way to integration. 🔹 Putin's message on Bitcoin.
🔹 Kansas introduces a bill to create a Bitcoin & Crypto Strategic Reserve.
🔹 Iran's crypto ecosystem is projected to reach $8 billion by 2025, representing more than 2% of the country's annual GDP.
🔹 Belarus's official legalization of crypto and Bitcoin banks shows that governments are now trying to integrate crypto into the system instead of ignoring it.
BTC-0,73%


- Reward
- 17
- 16
- Repost
- Share
Discovery:
Watching Closely 🔍️View More
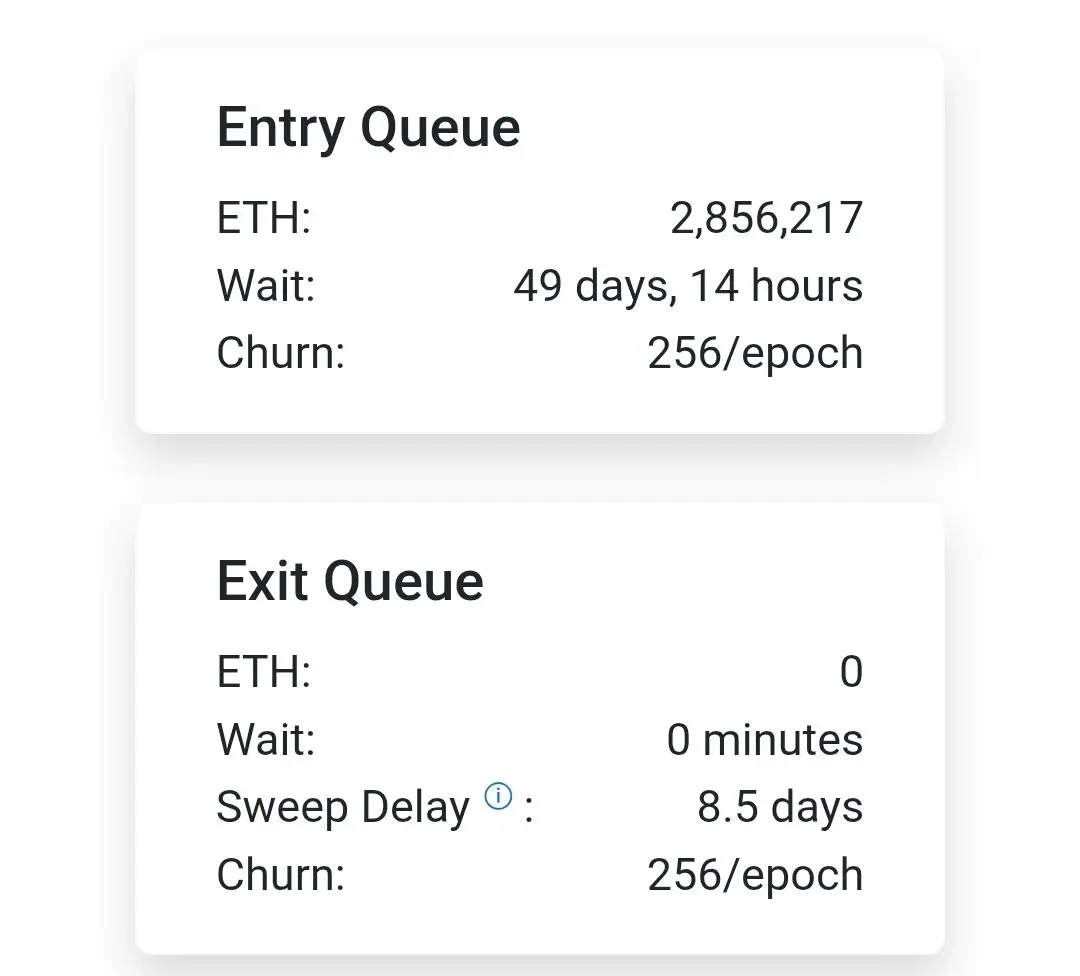
Nearly 3 million Ethereum are waiting in a staking queue that will last for exactly 40 days to be locked in.\n\nA month ago, this number was around 150,000.\n\nCurrently, there is no queue for those who want to cancel their Ethereum stake.\n\nWhy is there a entry queue?\nBecause the amount of ETH to be staked is EXCESSIVELY high.\nThe daily entry limit is not enough.\nThat's why there is a 40–50 day queue.\nThis clearly indicates long-term confidence.\n\nSo, are there no ones wanting to exit?\nThere are, but the number is very small.\nThose wanting to exit are well below the daily limit.\nTher
ETH-2,24%

- Reward
- 1
- Comment
- Repost
- Share
Load More
Join 40M users in our growing community
⚡️ Join 40M users in the crypto craze discussion
💬 Engage with your favorite top creators
👍 See what interests you
Trending Topics
View More62.51K Popularity
40.17K Popularity
24.7K Popularity
69.11K Popularity
347.96K Popularity
Hot Gate Fun
View More- MC:$3.4KHolders:10.00%
- MC:$3.4KHolders:10.00%
- MC:$3.45KHolders:20.04%
- MC:$3.39KHolders:10.00%
- MC:$3.39KHolders:10.00%
News
View MoreData: 1100 BTC transferred out from Fidelity Custody, then relayed to another anonymous address
43 m
Trump says he will bid to host the 2035 World Expo
1 h
Trump: The measure to impose a 25% tariff on any country trading with Iran will take effect soon
1 h
Kansas proposes Bitcoin Strategic Reserve Bill
1 h
Data: 2,600 ETH transferred out from Grayscale, worth approximately $7.66 million
2 h
Pin