Trade
Basic
Futures
Futures
Hundreds of contracts settled in USDT or BTC
Options
HOT
Trade European-style vanilla options
Unified Account
Maximize your capital efficiency
Demo Trading
Futures Kickoff
Get prepared for your futures trading
Futures Events
Futures Mall
Participate in events to win generous rewards
Demo Trading
Use virtual funds to experience risk-free trading
Earn
Launch
CandyDrop
Collect candies to earn airdrops
Launchpool
Quick staking, earn potential new tokens
HODLer Airdrop
Hold GT and get massive airdrops for free
Launchpad
Be early to the next big token project
Alpha Points
NEW
Trade on-chain assets and enjoy airdrop rewards!
Futures Points
NEW
Earn futures points and claim airdrop rewards
Investment
Simple Earn
Earn interests with idle tokens
Auto-Invest
Auto-invest on a regular basis
Dual Investment
Buy low and sell high to take profits from price fluctuations
Soft Staking
Earn rewards with flexible staking
Crypto Loan
0 Fees
Pledge one crypto to borrow another
Lending Center
One-stop lending hub
VIP Wealth Hub
Customized wealth management empowers your assets growth
Private Wealth Management
Customized asset management to grow your digital assets
Quant Fund
Top asset management team helps you profit without hassle
Staking
Stake cryptos to earn in PoS products
Smart Leverage
NEW
No forced liquidation before maturity, worry-free leveraged gains
GUSD Minting
Use USDT/USDC to mint GUSD for treasury-level yields
More
WOLF_DZ
No content yet

#CGN Frame: 15 minutes – coin CGN/USDT
✅ Positive Signals:
1. The price broke through a previous peak at 0.00546 and stayed above it.
2. The MA5 and MA10 averages are above the MA30 and trending upwards, indicating strong momentum.
3. An increase in trading volume means buyers are currently in control.
⚠️ Signals that require caution:
1. The price has approached a clear resistance at 0.00600.
2. The rise was swift, and this increases the likelihood of a correction or profit-taking soon.
3. MACD is in the overbought zone, it might cool down the movement.
---
🔑 Smart Deal Plan:
If you are not e
CGN-1,15%
- Reward
- 1
- 1
- Repost
- Share
abuzettin :
:
👍👍#CGN
Frame: 15 minutes – CGN/USDT coin
✅ Positive Signals:
1. The price broke through a previous peak at 0.00546 and stayed above it.
2. The MA5 and MA10 averages are above the MA30 and trending upwards, indicating strong momentum.
3. An increase in trading volume means buyers are currently in control.
⚠️ Signals that require caution:
1. The price has approached a clear resistance at 0.00600.
2. The rise was swift, and this increases the likelihood of a correction or profit-taking soon.
3. MACD is in the overbought zone, it might cool down the movement.
---
🔑 Smart Deal Plan:
If you are not
CGN-1,15%
- Reward
- 1
- 1
- Repost
- Share
ApplyForLeopard:
That's very well said, fighting fighting fighting fighting fighting fighting fighting fighting fighting fighting fighting fighting fighting fighting fighting fighting fighting fighting hard.#CGN
CGN/USDT analysis
Time Frame: 15 Minutes
1. General Trend (Trend)
The trend is still downward. The price is moving below the moving averages MA5, MA10, and MA30, indicating continued selling pressure.
2. Moving Averages (MA)
MA5 below MA10 and MA30
All averages are declining.
Negative signal and continued price weakness.
3. Support and Resistance Areas
Nearby support: 0.00300
If it breaks, we may see a price of: 0.00270
First resistance: 0.00390
Second resistance: 0.00450
4. MACD Indicator
Still below zero - Negative Histogram
This means that the selling momentum is still dominant.
5. Tr
CGN-1,15%
- Reward
- 4
- Comment
- Repost
- Share

- Reward
- like
- Comment
- Repost
- Share
- Reward
- like
- Comment
- Repost
- Share
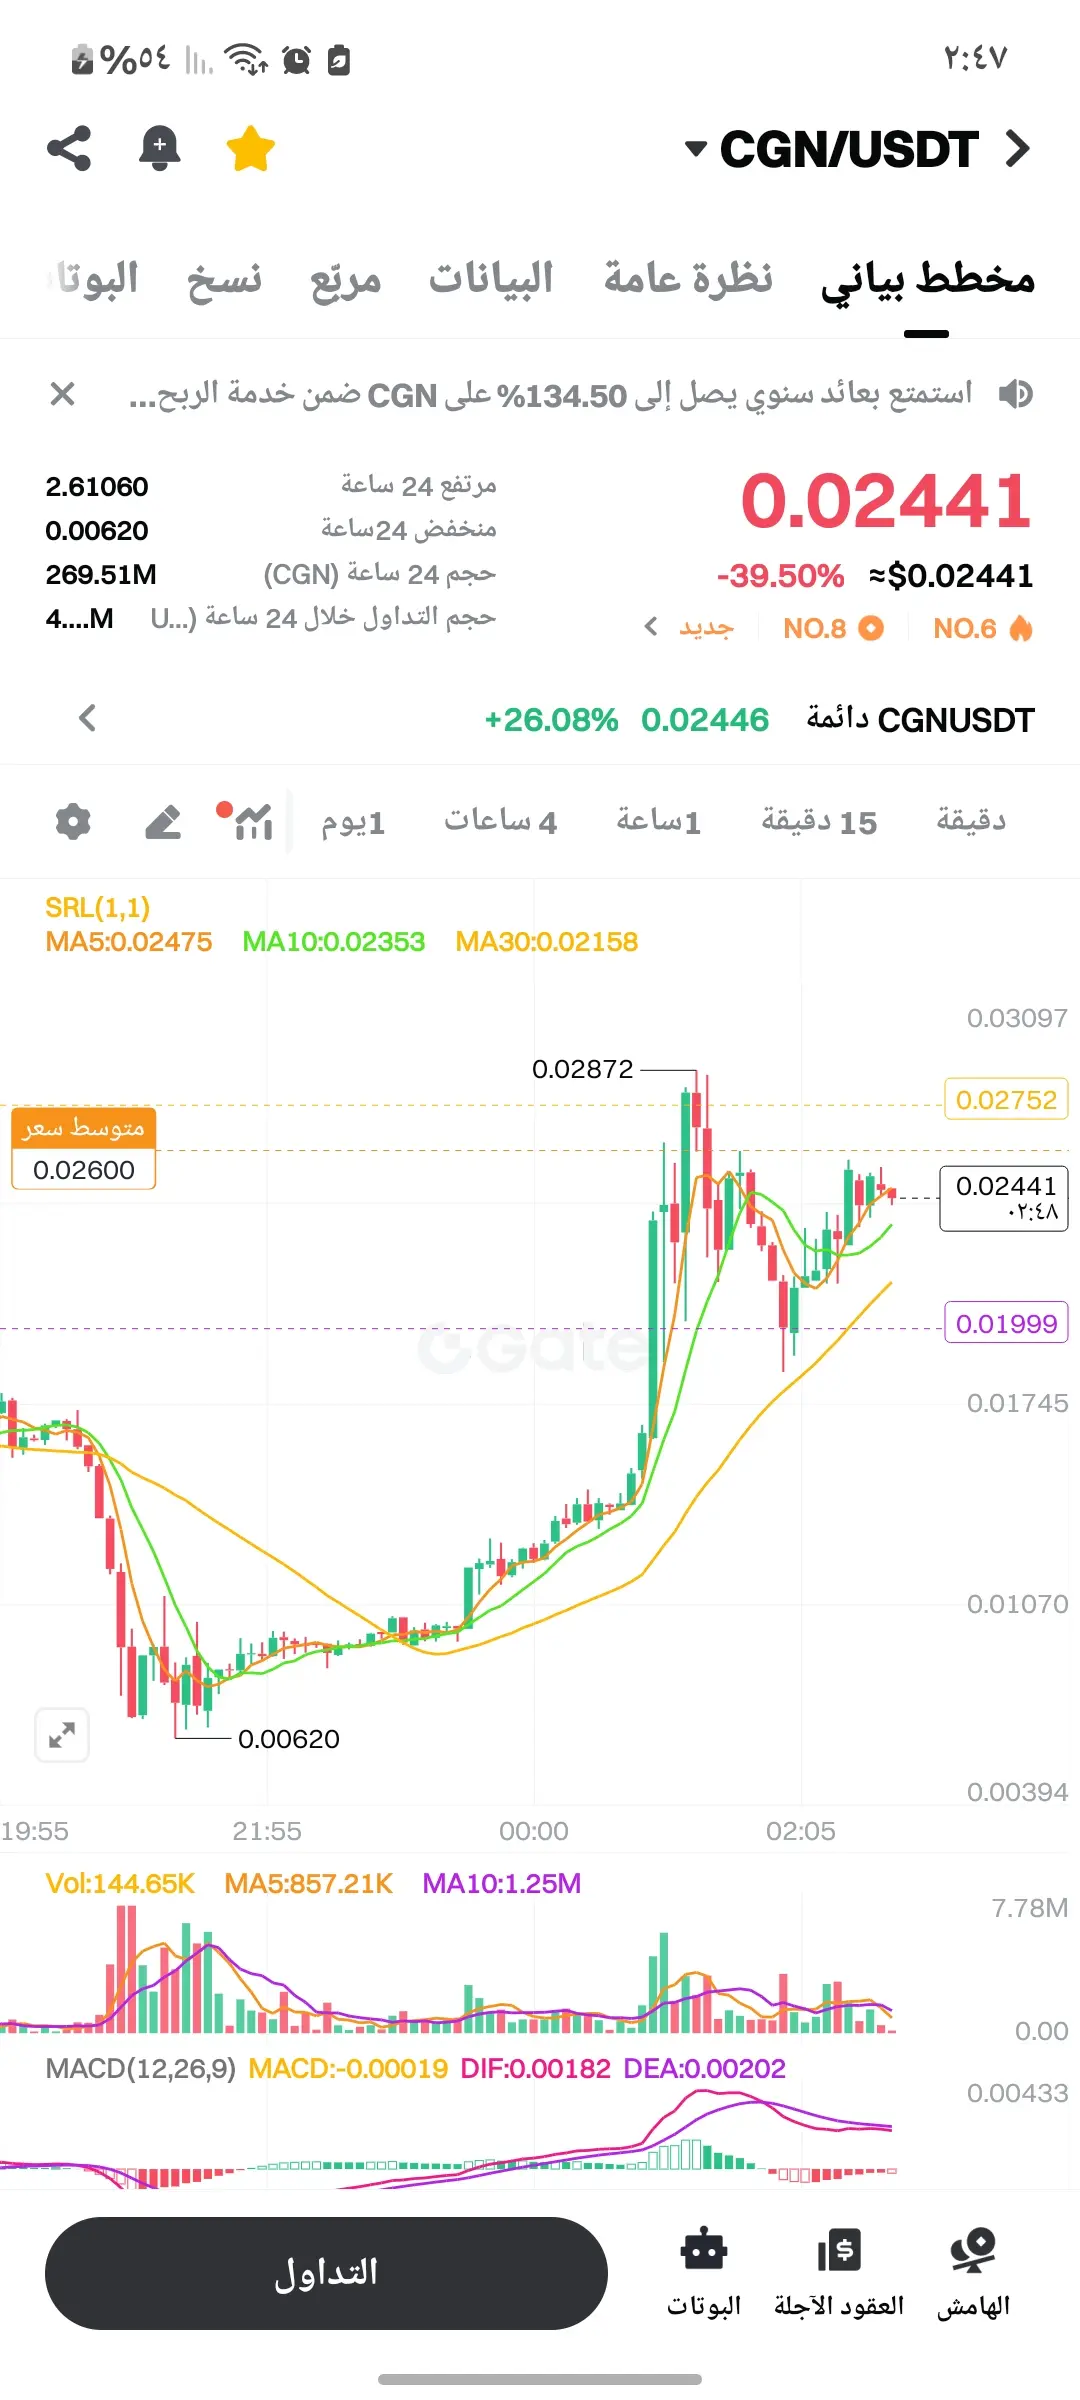
#CGN Technical Analysis for coin CGN/USDT
🔹 Current price: 0.0244
🔹 MACD (: Close to the zero line, which means that the momentum is currently balanced between buying and selling.
🔹 Moving Averages:
MA5 = 0.0247 )Slightly above the current price, near resistance(
MA10 = 0.0235 )First Support(
MA30 = 0.0215 )Main Support(
🔹 Price Action:
The price previously rose to 0.0287 then corrected to around 0.02, and now it is trying to hold around 0.024.
This indicates that the coin is currently in a accumulation phase after a strong correction.
The presence of small green candles after the decline
View Original🔹 Current price: 0.0244
🔹 MACD (: Close to the zero line, which means that the momentum is currently balanced between buying and selling.
🔹 Moving Averages:
MA5 = 0.0247 )Slightly above the current price, near resistance(
MA10 = 0.0235 )First Support(
MA30 = 0.0215 )Main Support(
🔹 Price Action:
The price previously rose to 0.0287 then corrected to around 0.02, and now it is trying to hold around 0.024.
This indicates that the coin is currently in a accumulation phase after a strong correction.
The presence of small green candles after the decline
- Reward
- 1
- 5
- Repost
- Share

#CGN Excellent timing analysis 🔍
Now the picture is clearer, and I will give you the current assessment along with the appropriate step 👇
---
🔹 Basic Data:
Current price: 0.02963 USDT
Change: -26.56 %
24-hour trading volume: 17.51 M
Highest Price: 0.05400 USDT
Lowest price: 0.01610 USDT
---
🔸 Technical Indicators ( 15-Minute Frame ):
1. Moving Averages:
MA5 = 0.02952
MA10 = 0.03178
MA30 = 0.03131
🔹 The price is close to MA5 but lower than MA10 → the trend is still slightly downward or sideways.
🔹 The averages are crossing downward, indicating that buying momentum is weak.
2. Candles:
The
CGN-1,15%

- Reward
- 2
- 1
- Repost
- Share
Rus35:
Vibe at 1000x 🤑