GateUser-5caa169c

vip
Age 0.1 Year
Peak Tier 0
No content yet
#PutinVisitsChina
Russian President Vladimir Putin’s state visit to China on May 19–20, 2026, was not a normal diplomatic engagement but a strategically timed geopolitical signal that reflected deeper global realignments already in motion across trade systems, energy markets, and financial power structures. The visit took place during a period of elevated macro uncertainty where global markets were already sensitive to inflation pressures, energy volatility, geopolitical fragmentation, and shifting monetary influence between East and West.
The meeting between Russia and China was widely inter
HighAmbition
#PutinVisitsChina
Russian President Vladimir Putin’s state visit to China on May 19–20, 2026, was not a normal diplomatic engagement but a strategically timed geopolitical signal that reflected deeper global realignments already in motion across trade systems, energy markets, and financial power structures. The visit took place during a period of elevated macro uncertainty where global markets were already sensitive to inflation pressures, energy volatility, geopolitical fragmentation, and shifting monetary influence between East and West.
The meeting between Russia and China was widely interpreted as a reinforcement of a long-term strategic alignment that is gradually reshaping global economic architecture, particularly in areas related to trade settlement systems, energy security, and alternative financial cooperation mechanisms.
2. Strategic Direction: Movement Toward a Multipolar Global Order
A central theme emerging from the summit was the continued strengthening of a multipolar world structure, where global influence is no longer concentrated in a single financial center but distributed across multiple regional power blocs. Both Russia and China emphasized expanded cooperation in trade, infrastructure, energy, and technology, while also highlighting the importance of reducing dependency on traditional Western financial systems.
This shift does not occur abruptly but gradually through repeated agreements, bilateral settlements, and infrastructure alignment, which collectively signal a long-term transition toward diversified global economic influence. Markets interpret this as a structural change rather than a short-term diplomatic event.
3. Economic Cooperation: Deepening Sectoral Integration
During the visit, multiple agreements were discussed across key strategic sectors including energy cooperation, artificial intelligence development, transportation infrastructure, scientific research, defense-related collaboration, and media coordination frameworks.
One of the most significant long-term energy discussions involved pipeline expansion projects such as the Power of Siberia 2 initiative, which, if fully developed, could significantly increase natural gas flow from Russia to China. This reflects a broader shift where Russia increasingly relies on Asian demand while China secures long-term energy supply stability.
These developments indicate not only economic cooperation but also structural reorientation of global trade routes.
4. Energy Markets: Inflation Pressure and Global Pricing Sensitivity
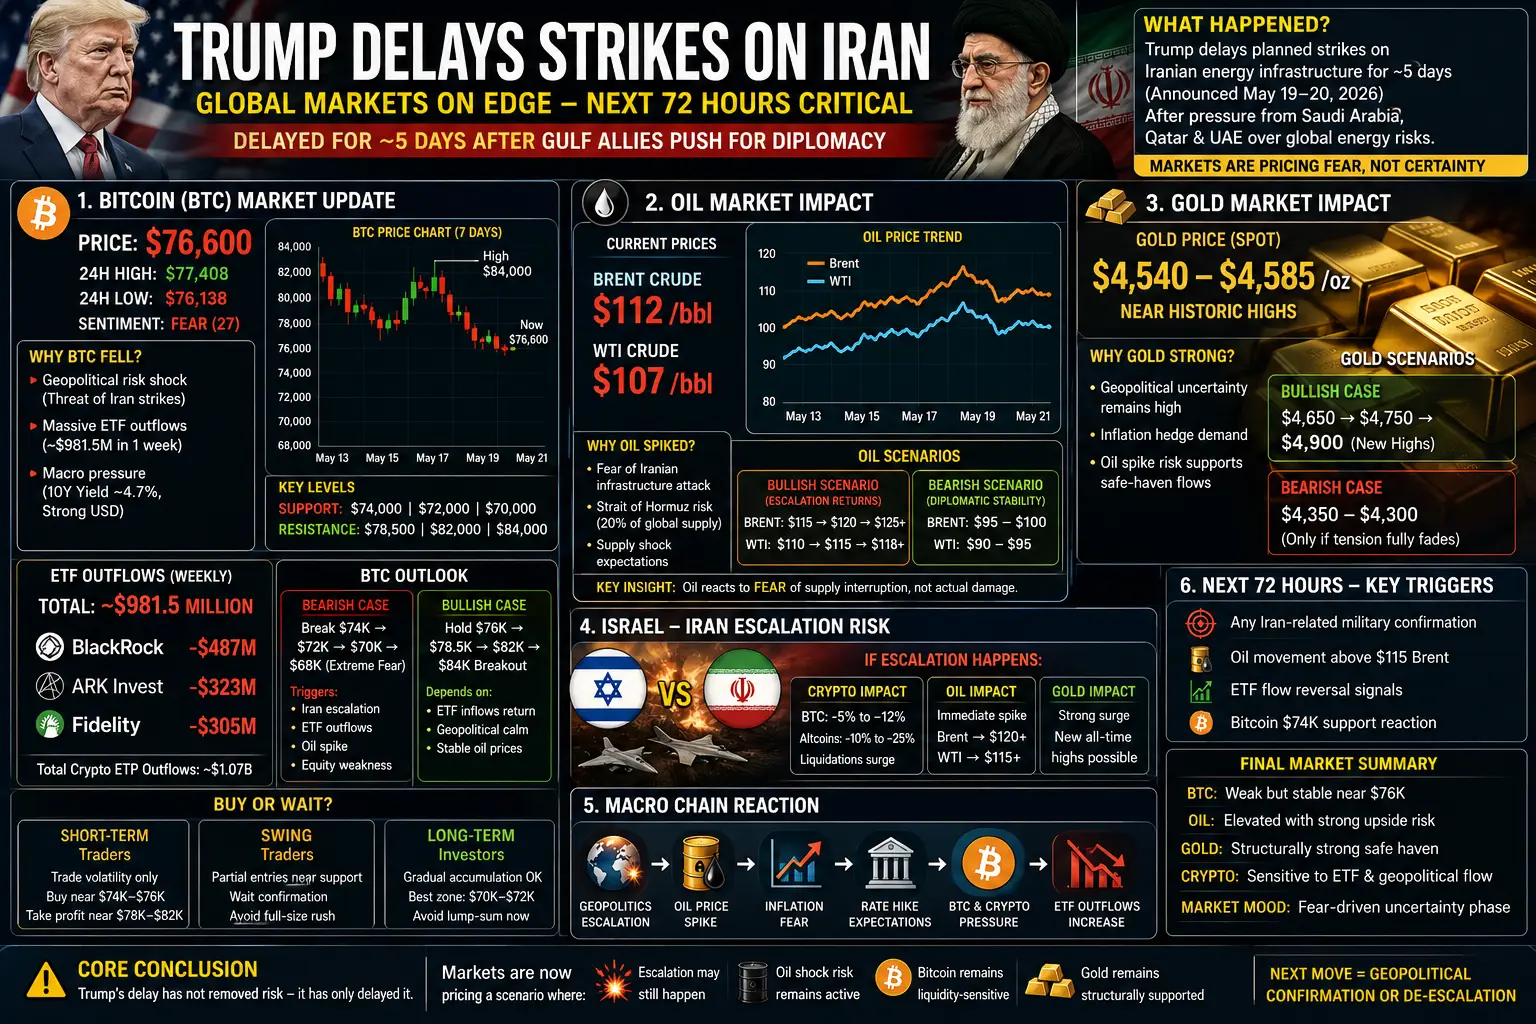
Energy markets responded to the broader geopolitical environment surrounding the summit rather than the event itself. Oil prices remained elevated during this period, with WTI trading near $99–$108 and Brent crude maintaining a higher range around $105–$110+, reflecting persistent supply risk premiums.
Several underlying drivers contributed to this volatility, including geopolitical instability in the Middle East, ongoing disruptions related to the Russia–Ukraine conflict, and structural uncertainty in global supply chains. Higher energy prices continue to play a central role in global inflation dynamics, influencing central bank decisions and risk asset performance across markets.
5. Financial System Shift: Gradual Expansion of Non-Dollar Trade
One of the most structurally important themes reinforced during the summit was the continued expansion of trade settlements outside the U.S. dollar system. Increased use of local currencies such as the Chinese yuan and Russian ruble in bilateral trade reflects a gradual reconfiguration of global settlement networks.
While this transition is not immediate or absolute, the direction is clear: countries are increasingly exploring alternative financial frameworks that reduce reliance on traditional Western banking channels.
From a macro perspective, this trend is significant because it introduces long-term questions about currency dominance, liquidity distribution, and global reserve asset competition.
₿ 6. Bitcoin Market Behavior: Stability Instead of Shock Reaction
Despite strong geopolitical narratives, Bitcoin did not experience a dramatic breakout or collapse during the summit period. Instead, it demonstrated stable and controlled price behavior, trading in a relatively narrow range around $77,000–$78,000 after earlier monthly fluctuations.
This reflects a structural change in Bitcoin market dynamics, where price action is increasingly influenced by institutional flows, macro liquidity conditions, interest rate expectations, and ETF-driven capital movements rather than short-term geopolitical headlines.
Bitcoin’s reaction suggests that it is evolving from a purely sentiment-driven asset into a macro-integrated financial instrument.
7. Institutional vs Retail Interpretation Gap
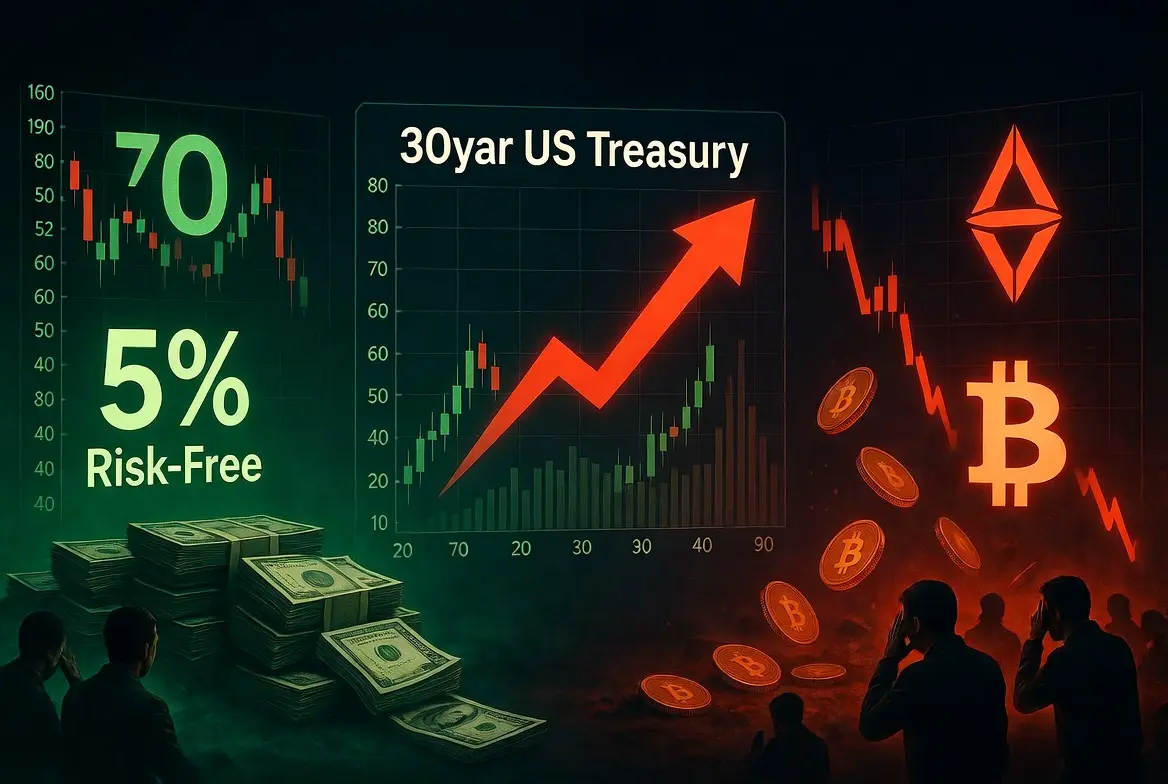
A clear divergence emerged between retail expectations and institutional positioning. Many retail participants anticipated a strong bullish reaction driven by de-dollarization narratives and geopolitical fragmentation. However, institutional investors remained focused on broader macro indicators such as inflation data, Federal Reserve policy outlook, bond yield behavior, and ETF capital flows.
As a result, the market exhibited strong narrative impact in the long term, while short-term price movement remained relatively muted, highlighting the difference between storytelling-driven expectations and liquidity-driven market behavior.
8. Gold Market Context: Parallel Safe-Haven Dynamics
Gold continued to perform strongly within a broader safe-haven framework, trading in the range of approximately $4,500–$4,700 per ounce during the same period. Its strength was supported by inflation uncertainty, geopolitical risk premiums, and concerns regarding global financial fragmentation.
Interestingly, Bitcoin maintained partial correlation with gold behavior, reinforcing its evolving narrative as a digital counterpart to traditional safe-haven assets, particularly among institutional investors who view it as a hedge against long-term monetary uncertainty.
9. Middle East and Global Risk Expansion
Additional geopolitical pressure from the Middle East contributed to elevated global risk sensitivity. Ongoing tensions created concerns around shipping routes, energy infrastructure security, and potential escalation scenarios that could significantly impact oil supply stability.
Such conditions typically increase inflation expectations while simultaneously reducing investor risk appetite, which affects both traditional and digital asset markets through liquidity tightening and volatility expansion.
10. Russia–Ukraine Conflict: Persistent Macro Influence
The ongoing conflict between Russia and Ukraine continues to act as a structural macro driver affecting energy flows, commodity pricing, and global risk sentiment. Continuous disruptions in infrastructure and supply chains maintain elevated uncertainty levels across global markets.
This sustained instability contributes to persistent inflation concerns and reinforces demand for assets perceived as neutral or decentralized in nature.
11. Crypto Market Structure: Altcoin Stability with Select Strength
While Bitcoin remained relatively stable, major altcoins also reflected macro-driven behavior without extreme volatility. Ethereum traded in the $4,100–$4,300 range, while Solana remained in the mid-$80 zone, showing consolidation rather than breakdown.
The broader crypto market was influenced by AI-related narratives, infrastructure development trends, and increasing institutional participation, which helped maintain structural support across major assets.
12. Key Bitcoin Structural Levels
Market participants closely monitored important psychological and technical levels including $75,000 as a major support zone, $80,000 as a resistance boundary, and $85,000 as a breakout confirmation level, while long-term expectations remained focused on higher macro targets depending on liquidity expansion cycles.
13. Overall Market Interpretation: Structural Change Over Immediate Reaction
The most important conclusion from the summit is that its impact was not reflected in immediate explosive price movements but rather in long-term reinforcement of existing global trends. These include increasing geopolitical fragmentation, gradual expansion of multipolar financial systems, continued discussion around de-dollarization, and strengthening narratives around Bitcoin as a neutral digital asset.
The key takeaway is that modern financial markets no longer react solely to geopolitical events in isolation; instead, they integrate such events into broader macro frameworks where liquidity, institutional positioning, and monetary policy carry significantly more weight in short-term pricing behavior.
The Putin visit china summit represents a significant geopolitical signal that reinforces long-term structural transitions in global trade, energy systems, and financial alignment between major world powers. While immediate market reactions remained controlled, the broader implications strengthen ongoing macro narratives involving de-dollarization, energy-driven inflation cycles, and the evolving role of Bitcoin as a globally neutral asset within a fragmented financial system.
This event does not create a short-term market shock, but it adds another layer to an already shifting global order where economic influence is becoming increasingly distributed and interconnected across multiple power centers.
repost-content-media
  • Reward
  • Comment
  • Repost
  • Share
#PYTHUnlocks2.13BillionTokens
PYTH Network (PYTH) 2.13 Billion Token Unlock — The Biggest Oracle Supply Shock of 2026
A Critical Moment for PYTH and the Entire Altcoin Market
The crypto market is now entering one of the most sensitive supply events of 2026 as PYTH Network prepares to unlock approximately 2.13 billion PYTH tokens between May 19–21. Across the entire digital asset industry, this unlock is being viewed as a major stress test not only for PYTH itself but also for overall market liquidity, investor confidence, and the ability of utility-focused projects to survive massive inflatio
HighAmbition
#PYTHUnlocks2.13BillionTokens
PYTH Network (PYTH) 2.13 Billion Token Unlock — The Biggest Oracle Supply Shock of 2026
A Critical Moment for PYTH and the Entire Altcoin Market
The crypto market is now entering one of the most sensitive supply events of 2026 as PYTH Network prepares to unlock approximately 2.13 billion PYTH tokens between May 19–21. Across the entire digital asset industry, this unlock is being viewed as a major stress test not only for PYTH itself but also for overall market liquidity, investor confidence, and the ability of utility-focused projects to survive massive inflationary phases without losing long-term momentum.
At current market prices fluctuating around $0.038–$0.044, the unlock carries an estimated valuation between $81 million and $94 million. However, beyond the dollar amount, what truly matters is the psychological effect this event is creating inside the market. Traders understand that sudden supply expansion can rapidly weaken price action if demand fails to absorb new circulation fast enough.
This is why PYTH has become one of the most heavily discussed tokens across crypto communities during May 2026.
Unlike smaller unlocks that markets often ignore, this event is large enough to influence sentiment across DeFi infrastructure, oracle projects, Layer-2 ecosystems, and even broader altcoin liquidity conditions. The market is now entering a phase where every major transaction, exchange inflow, whale wallet movement, and staking shift is being monitored aggressively.
Why The 2.13 Billion Unlock Matters So Much
The unlock itself represents nearly 37% of PYTH’s pre-event circulating supply and approximately 21.3% of the total 10 billion token supply. Before the unlock, circulating supply remained near 5.75 billion PYTH, but after the event circulation could expand toward the 7.87–7.9 billion range.
That is an enormous increase within a very short time period.
In crypto markets, price is heavily influenced by the balance between supply and demand. When circulating supply expands aggressively while liquidity conditions remain weak, markets usually struggle to maintain stability. Even if long-term fundamentals remain strong, short-term volatility can still become extremely violent.
Another major factor is trader psychology. In crypto, fear often arrives before actual selling. Many traders begin reducing exposure days or even weeks before major unlocks because they expect others to sell first. This creates pre-event weakness that can sometimes become stronger than the unlock itself.
That behavior is already visible in PYTH’s recent price structure.
Allocation Breakdown — Where The Tokens Are Going
The unlocked PYTH supply is distributed across several categories:
~1.13 Billion PYTH → Ecosystem Growth This allocation supports partnerships, developer expansion, liquidity programs, protocol adoption, grants, and long-term ecosystem growth initiatives.
~537.5 Million PYTH → Publisher Rewards These rewards compensate the oracle publishers and data providers responsible for delivering real-time market information into the PYTH infrastructure.
Remaining Allocation → Team, Contributors, Early Investors & Protocol Operations This section includes operational funding, contributor incentives, strategic holders, private-sale participants, and long-term ecosystem expansion programs.
However, one extremely important detail is often ignored by panic-driven traders:
Not all 2.13 billion tokens instantly become active sell pressure.
A meaningful portion may remain locked inside ecosystem initiatives, staking structures, treasury management systems, governance allocations, or long-term strategic holdings. Because of this, many analysts estimate the real immediate liquid supply entering exchanges could initially remain closer to 8–10% rather than the full 37% headline figure dominating social media.
Still, under fragile market conditions even partial sell pressure can create heavy volatility.
PYTH Is Facing a Liquidity War
This unlock is not simply about “tokens entering circulation.” It is actually a battle between liquidity and confidence.
If demand remains strong enough to absorb new supply, PYTH could stabilize and eventually recover. But if exchange inflows rise aggressively while buy-side liquidity weakens, the market may experience a prolonged downside cycle similar to previous unlock periods.
This is exactly why analysts are calling the event one of the largest “supply absorption tests” of 2026.
Large holders and institutional participants are now expected to play a decisive role. If whales begin aggressively depositing tokens onto exchanges, retail fear could accelerate quickly. On the other hand, if staking participation increases and ecosystem wallets retain holdings instead of selling, the market could absorb pressure far more efficiently than expected.
The next few weeks may determine whether PYTH enters a deeper bearish phase or transforms this period into a major accumulation zone.
Historical Performance & Why Traders Are Nervous
The market’s fear is not random.
Previous PYTH unlock cycles during May 2024 and May 2025 were followed by extended bearish periods where the token suffered drawdowns between approximately 65–72% over subsequent months.
That historical weakness is one of the main reasons traders remain extremely cautious now.
Crypto markets usually move through three stages during large unlock cycles:
Phase One → Pre-Unlock Fear Selling Traders reduce exposure ahead of uncertainty.
Phase Two → Unlock Volatility Large wallet movements and liquidation activity create sharp price swings.
Phase Three → Supply Absorption Markets eventually stabilize once buyers absorb circulating supply.
Right now, PYTH is transitioning between the fear stage and the volatility stage.
Technical Analysis & Important Price Levels
From a technical perspective, PYTH continues trading inside a weak bearish structure around the $0.038–$0.044 range.
Immediate Resistance Levels: $0.044 – $0.045 $0.050 – $0.054
Major Resistance Zones: $0.057 $0.061 $0.065
These areas remain critical because sellers repeatedly regained control near these levels during previous recovery attempts. If PYTH cannot reclaim higher resistance regions, bearish momentum could continue dominating the market for several more weeks.
Key Support Zones: $0.038 – $0.039 $0.035 – $0.036
Critical Breakdown Levels: $0.030 $0.025 $0.020
The $0.038 region has now become one of the most important psychological zones for the entire market structure. A breakdown below $0.035 could trigger aggressive liquidations, stop-loss cascades, and stronger panic across derivatives markets.
Some bearish long-range projections even discuss the possibility of PYTH revisiting the $0.020 region if macro crypto conditions deteriorate further and demand fails to recover.
However, bullish recovery scenarios still remain possible.
If the market absorbs supply efficiently and PYTH reclaims the $0.060–$0.065 region with strong volume support, momentum could shift significantly. Under stronger recovery conditions, traders may begin targeting $0.075, $0.085, and eventually the psychological $0.10 barrier once again.
PYTH’s Real Strength — Why Long-Term Investors Still Believe
Despite heavy unlock fears, PYTH remains one of the most important oracle infrastructures in the crypto ecosystem.
The network powers real-time price feeds across Solana, Sui, Aptos, Ethereum Layer-2 ecosystems, and multiple DeFi applications including lending markets, perpetual exchanges, derivatives platforms, and liquidity systems.
Without reliable oracle infrastructure, decentralized finance cannot function efficiently.
This is the strongest bullish argument supporting PYTH long term.
Unlike speculative meme-driven assets, PYTH provides infrastructure utility that many DeFi systems genuinely depend on. This creates long-term relevance even during periods of severe short-term volatility.
Bullish Arguments Supporting PYTH: Growing oracle demand across DeFi ecosystems. Increasing adoption on Layer-2 networks. Higher staking participation may reduce active circulating supply. Institutional accumulation during panic phases could stabilize valuation. A relief rally may emerge if exchange inflows remain smaller than expected. Long-term ecosystem growth could eventually absorb inflation pressure.
Some investors now believe the unlock could eventually create a major accumulation opportunity if panic becomes excessive.
Major Risks The Market Is Watching Closely
Several important risks still remain:
Large exchange inflows from unlock recipients. Weak altcoin liquidity across the broader market. Heavy derivatives leverage increasing liquidation risks. Simultaneous unlocks involving ZRO and KAITO fragmenting liquidity. Continued bearish sentiment suppressing recovery attempts. Whale-driven volatility causing panic among retail traders.
Another critical factor is Bitcoin dominance. If capital continues rotating toward Bitcoin while altcoins weaken, PYTH and similar infrastructure assets may struggle to recover quickly even if fundamentals remain strong.
Market Sentiment & Trading Strategies
Short-term traders are focusing primarily on volatility opportunities near resistance zones between $0.050 and $0.057 while targeting downside regions near $0.042, $0.038, and $0.035.
Bearish traders are searching for rejection confirmations while bullish participants are waiting for signs that supply absorption is stabilizing.
Long-term investors are approaching the situation more carefully. Many are waiting for post-unlock stabilization before opening larger accumulation positions. Their focus remains on staking growth, ecosystem adoption, on-chain activity, and whether demand can successfully absorb circulating expansion over time.
Institutional participants are expected to remain extremely active during this phase. Large funds often hedge unlock risks through derivatives while simultaneously preparing strategic accumulation during panic-driven weakness.
Final Outlook — A Defining Moment for PYTH
The PYTH 2.13 billion token unlock is not just another token release event. It is one of the biggest liquidity, confidence, and tokenomics tests facing the crypto market in 2026.
If demand successfully absorbs the new supply, PYTH could eventually transform this period into a powerful long-term accumulation zone. But if exchange inflows accelerate while liquidity remains weak, downside pressure could continue dominating price action for months.
The coming weeks will therefore become extremely important for determining PYTH’s future direction.
Traders and investors will closely monitor whale activity, staking participation, exchange reserves, derivatives positioning, ecosystem growth, trading volume, and broader crypto market momentum as the market attempts to absorb one of the largest oracle-sector unlock events in recent years.
repost-content-media
  • Reward
  • Comment
  • Repost
  • Share
#TrumpDelaysIranStrike
Trump Delays Iran Strike
President Donald Trump’s decision on May 19–20, 2026 to delay planned strikes on Iranian energy infrastructure for approximately five days has created a highly sensitive geopolitical pause in global markets. This delay came after diplomatic pressure from Gulf allies including Saudi Arabia, Qatar, and the United Arab Emirates, who warned about potential catastrophic spillover effects in global energy supply chains.
Markets are now operating inside a short-term “uncertainty window” where traders are reacting to every headline rather than fundamen
BTC-2.75%
HighAmbition
#TrumpDelaysIranStrike
Trump Delays Iran Strike
President Donald Trump’s decision on May 19–20, 2026 to delay planned strikes on Iranian energy infrastructure for approximately five days has created a highly sensitive geopolitical pause in global markets. This delay came after diplomatic pressure from Gulf allies including Saudi Arabia, Qatar, and the United Arab Emirates, who warned about potential catastrophic spillover effects in global energy supply chains.
Markets are now operating inside a short-term “uncertainty window” where traders are reacting to every headline rather than fundamentals. This has created a fragile environment across Bitcoin, altcoins, oil, and gold, with liquidity shifting rapidly between risk-on and risk-off positioning.
At the center of this reaction is one key reality:
Markets are not pricing certainty — they are pricing fear of escalation.
1. Bitcoin (BTC) & Crypto Market Reaction
Current Market Structure
BTC Price: ~$76,600
24h High: ~$77,408
24h Low: ~$76,138
Market Behavior: High volatility compression with downside pressure
Sentiment: Fear zone (~27 Fear & Greed Index)
Bitcoin is currently sitting at a technically fragile equilibrium zone where neither buyers nor sellers have full control. The $76K region is acting as a short-term battlefield between dip buyers and macro sellers.
Why BTC Fell From Higher Levels
Bitcoin’s drop from the $77K–$80K region is not caused by a single factor, but a combination of three major pressures:
2. Geopolitical Risk Shock
The initial threat of strikes on Iran triggered immediate risk-off behavior. In such environments:
Traders reduce leverage instantly
Funds move into cash or stable assets
High-beta assets like BTC face liquidity withdrawals
Even though the strike was delayed, the uncertainty remains.
3. ETF Outflows (Major Structural Pressure)
Recent ETF flow data shows strong institutional distribution:
Weekly ETF outflows: ~$981.5M
Total crypto ETP outflows: ~$1.07B
BlackRock: ~$487M outflow
Ark Invest: ~$323M
Fidelity: ~$305M
This is critical because ETF flows now act as the backbone of Bitcoin demand. When inflows reverse:
Spot demand weakens
Market depth reduces
Price becomes more sensitive to news shocks
4. Macro Pressure (Rates + Dollar Strength)
US 10Y Treasury yield: ~4.7% (multi-month high)
Strong USD index pressure
Reduced liquidity in risk assets
Higher yields make risk-free returns more attractive, pulling capital away from speculative markets.
Will BTC Fall Further From $76K?
Bearish Case (Downside Pressure Continuation)
If uncertainty escalates again:
BTC could retest: $74,000
If broken: $72,000 → $70,000 zone
Extreme fear scenario: $68,000 (liquidity flush)
Triggers for downside:
Renewed Iran escalation headlines
ETF outflows continuing
Oil spike causing inflation fear
Equity market weakness spilling into crypto
Bullish Case (Stabilization & Recovery)
If geopolitical pressure cools:
BTC stabilizes above $76K
Recovery target: $78,500 → $82,000
Breakout zone: $84,000
Recovery depends heavily on:
ETF inflows returning
Reduced geopolitical tension
Stable oil prices
Should BTC Be Bought at $76K?
Market is currently in a reaction phase, not a trend phase.
Accumulation Logic:
$74K–$76K = early accumulation zone
Stronger accumulation zone = $70K–$72K
Strategy Interpretation:
Short-term traders: wait for confirmation (do not rush)
Swing traders: partial entries near support only
Long-term investors: gradual accumulation strategy preferred
Key principle:
Liquidity + news volatility = avoid full-size entries
5. Oil Market Impact (Brent $112 / WTI $107)
Current Situation
Brent Crude: ~$108–112/bbl
WTI Crude: ~$103–107/bbl
Oil remains the most sensitive asset in this geopolitical cycle.
Why Oil Reacted Strongly
Before the delay:
Oil surged aggressively toward $111–$112
WTI pushed near $107–$108
Drivers:
Fear of Iranian energy infrastructure disruption
Risk of Strait of Hormuz instability
Supply shock expectations
After delay:
Oil pulled back slightly (~1–2%)
Traders reduced immediate war premium pricing
Can Oil Go Higher Again?
Yes — and aggressively.
Bullish Oil Scenario (Escalation Returns)
If strikes resume or tensions increase:
Brent: $115 → $120 → $125+
WTI: $110 → $115 → $118
Reasons:
Global spare capacity is limited
Shipping routes are highly vulnerable
Risk premium can re-enter instantly
Bearish Oil Scenario (Diplomatic Stability)
If diplomacy holds:
Brent: $95–$100 normalization zone
WTI: $90–$95 range
But downside is limited because:
Global inventories are already tight
Seasonal demand remains strong
Supply chain uncertainty persists
Key Oil Insight
Oil is not reacting to actual damage —
it is reacting to fear of supply interruption
So even without conflict escalation, volatility remains elevated.
6. Gold Market Impact
Current Price Behavior
Gold: ~$4,540 – $4,585/oz
Trend: Strong safe-haven consolidation
Structure: Near historic highs
Why Gold Remains Strong
Gold is benefiting from dual forces:
7. Geopolitical Uncertainty
Even delayed strikes keep uncertainty alive.
8. Inflation Hedge Flow
If oil rises again:
Inflation expectations rise
Gold demand increases further
Gold Scenarios
Bullish Case:
$4,650 → $4,750 → $4,900 possible extension
If full escalation returns: new record highs likely
Bearish Case:
Stabilization could pull gold back to $4,350–$4,300
Only if geopolitical tension fully disappears (low probability short-term)
9. Israel–Iran Risk Factor (Market Sensitivity)
Markets are closely watching whether additional military actions occur involving Israel and Iran.
If escalation happens:
Crypto Impact:
BTC drop: 5%–12% possible short-term
Altcoins: 10%–25% downside pressure
High leverage liquidations increase sharply
Oil Impact:
Immediate spike due to supply fear
$120+ Brent becomes realistic
Gold Impact:
Strong surge toward new highs
Safe-haven capital inflow increases
10. Macro Market Behavior (Why Everything Is Moving Together)
This cycle is not isolated — it is interconnected:
Geopolitics → Oil spike
Oil spike → Inflation fear
Inflation fear → Rate hike expectations
Rate fear → BTC & crypto pressure
Risk-off flow → ETF outflows
This chain reaction explains why markets are highly reactive even without actual conflict escalation.
11. BTC $76K — Buy or Wait?
Current Market Reality
Bitcoin is not in a clean trend — it is in a headline-driven liquidity zone.
Recommended Approach
Aggressive Traders:
Trade volatility only
Buy dips near $74K–$76K
Take profits quickly near resistance ($78K–$82K)
Conservative Traders:
Wait for clarity above $80K
Or wait deeper correction toward $72K
Long-Term Investors:
Gradual accumulation is reasonable
Avoid lump-sum entry in uncertain geopolitical phase
12. Final Outlook — Next 72 Hours Are Critical
The market is currently inside a geopolitical countdown phase:
Key Triggers Ahead:
Any Iran-related military confirmation
Oil movement above $115 Brent
ETF flow reversal signals
Bitcoin $74K support reaction
Final Market Summary
BTC: Weak but stable near $76K
Oil: Elevated with strong upside risk
Gold: Structurally strong safe haven
Crypto: Sensitive to ETF + geopolitical flow
Market Mood: Fear-driven uncertainty phase
Core Conclusion
Trump’s delay has not removed risk — it has only delayed it.
Markets are now pricing a scenario where:
escalation may still happen
oil shock risk remains active
Bitcoin remains liquidity-sensitive
gold remains structurally supported
The next move will be determined not by technicals alone, but by geopolitical confirmation or de-escalation signals.
repost-content-media
  • Reward
  • Comment
  • Repost
  • Share
#GateSquarePizzaDay
Bitcoin is currently trading at $76,780, and the timing couldn’t be more powerful.
We are once again celebrating the most legendary moment in crypto history — the day when 10,000 BTC bought just two pizzas… a transaction that unknowingly defined the future of digital money forever.
Today, that “pizza moment” is no longer just history — it’s a reminder of how far Bitcoin has come, from experimental code to a global financial asset shaping markets, narratives, and portfolios worldwide.
📊 Market Pulse (BTC)
Current Price: $76,780
Market Mood: Cautious but highly active
Struc
BTC-2.75%
HighAmbition
#GateSquarePizzaDay
Bitcoin is currently trading at $76,780, and the timing couldn’t be more powerful.
We are once again celebrating the most legendary moment in crypto history — the day when 10,000 BTC bought just two pizzas… a transaction that unknowingly defined the future of digital money forever.
Today, that “pizza moment” is no longer just history — it’s a reminder of how far Bitcoin has come, from experimental code to a global financial asset shaping markets, narratives, and portfolios worldwide.
📊 Market Pulse (BTC)
Current Price: $76,780
Market Mood: Cautious but highly active
Structure: Consolidation near high-value zone
Narrative: Long-term conviction vs short-term volatility
🍕 Gate Square Pizza Day Vibe
The community event on Gate.io is bringing back the spirit of Bitcoin Pizza Day through creativity, storytelling, and market reflection.
This is not just an event — it’s a reminder that:
Every trade has a story
Every cycle has a lesson
And every “cheap pizza moment” in history becomes a billion-dollar memory later
💭 Thought of the Day
“What feels expensive today… might look unbelievably cheap in the future.”
🚀 Final Take
Bitcoin at $76.7K + Pizza Day energy = a perfect moment to reflect, create, and engage.
Whether you’re a trader, builder, or believer — this is your chance to turn history into content and content into opportunity.
🍕 #GateSquarePizzaDay isn’t just an event… it’s a reminder of where it all started.
repost-content-media
  • Reward
  • Comment
  • Repost
  • Share
#PutinVisitsChina
Russian President Vladimir Putin’s visit to China on May 19–20, 2026 marks a major geopolitical milestone reflecting the ongoing transformation of global economic and political alignment. This visit follows shortly after high-level diplomatic engagement between the United States and China, indicating an active phase of strategic repositioning among the world’s largest economies.
The timing is highly significant as it coincides with the 25th anniversary of the Sino-Russian cooperation framework, reinforcing long-term coordination between Moscow and Beijing in energy, trade, i
BTC-2.75%
ETH-3.21%
XAUUSD-0.74%
HighAmbition
#PutinVisitsChina
Russian President Vladimir Putin’s visit to China on May 19–20, 2026 marks a major geopolitical milestone reflecting the ongoing transformation of global economic and political alignment. This visit follows shortly after high-level diplomatic engagement between the United States and China, indicating an active phase of strategic repositioning among the world’s largest economies.
The timing is highly significant as it coincides with the 25th anniversary of the Sino-Russian cooperation framework, reinforcing long-term coordination between Moscow and Beijing in energy, trade, infrastructure, and financial settlement systems.
Global markets are responding with increased volatility, shifting liquidity conditions, and stronger sensitivity to geopolitical developments. The global system is transitioning into a more fragmented and multi-centered economic structure.
2. Global Power Structure Transition
The world economy is gradually moving away from a single-center dominance model toward a distributed power system.
Key developments include:
Expansion of Russia–China strategic cooperation in energy and trade
Strengthening of regional economic alliances across Eurasia
Growth of cross-border settlement mechanisms outside traditional systems
Increasing diversification of global trade routes and financial channels
China continues to position itself as a central economic hub, while Russia is increasingly integrated into Asian energy and commodity supply networks.
This shift is long-term and structural, not temporary or event-driven.
3. Energy Market Dynamics & Inflation Pressure
Energy remains the strongest macro driver of global inflation.
Oil Market Overview
Brent Crude: $104 – $112
WTI Crude: $101 – $108
High volatility expansion zone: $115 – $125
Extreme stress scenario: $130 – $150+
Ongoing geopolitical tension in key maritime shipping routes continues to elevate risk premiums in energy pricing. Supply chain uncertainties are creating structural inflation pressure across global economies.
Russia’s energy exports toward Asia continue expanding, reshaping global supply distribution and increasing price divergence between regions.
Higher energy costs are directly contributing to sustained global inflation, forcing central banks to maintain restrictive monetary policies.
4. Global Interest Rates & Liquidity Conditions
Global financial markets remain under pressure due to elevated interest rates and tighter liquidity.
US 10-Year Yield: ~4.5% – 5.2%
Global credit tightening continues
Reduced liquidity flow into high-risk assets
Increased preference for fixed-income instruments
Higher yields are reducing speculative capital flow and increasing volatility across equities, crypto, and emerging markets.
This liquidity environment remains one of the most important macro drivers in 2026.
5. Bitcoin Market Structure & Behavior
Bitcoin is currently trading within a wide consolidation range:
BTC Price Range: $76,800 – $82,000
Previous cycle high: ~$126,000
Key support zone: $75,000 – $72,000
Resistance zone: $85,000 – $92,000
Market Structure Analysis
Bitcoin is increasingly behaving as a macro liquidity-sensitive asset rather than an independent hedge. Its correlation with global risk markets has strengthened significantly.
Extended Scenario Outlook
Bullish continuation zone: $92,000 – $110,000
Strong expansion cycle: $120,000 – $135,000
Macro correction zone: $70,000 – $72,000
Deep liquidity stress scenario: $62,000 – $68,000
Institutional participation remains active, but market momentum is heavily influenced by liquidity conditions and global risk sentiment.
6. Ethereum Market Outlook
Ethereum is currently trading in the range:
ETH Price: $2,050 – $2,150
Key Market Drivers
Competition with risk-free yield instruments
Slower growth in decentralized finance liquidity
Reduced staking yield attractiveness relative to government bonds
Capital rotation toward lower-risk instruments
Ethereum Price Scenarios
Recovery range: $2,400 – $2,800
Strong bullish breakout: $3,200 – $3,800
Extended bullish cycle: $4,200 – $4,800
Downside pressure zone: $1,800 – $2,000
Deep correction scenario: $1,500 – $1,700
Ethereum remains structurally strong but is sensitive to global liquidity cycles.
7. Gold Market Strength & Safe Haven Demand
Gold continues to be the primary safe-haven asset in the current macro environment.
Gold Price: $4,450 – $4,600
Previous peak levels: near $5,000
Forward Projection Scenarios
Base bullish range: $4,800 – $5,200
Strong geopolitical stress: $5,400 – $5,800
Extreme liquidity crisis scenario: $6,000+
Central bank demand remains a key structural support factor for gold.
8. Oil Market Structural Sensitivity
Oil remains the most geopolitically sensitive asset class.
Price Scenarios
Stable elevated range: $100 – $115
Expansion zone: $120 – $135
High stress environment: $140 – $160
Extreme disruption scenario: $170 – $200
Energy remains the primary transmission mechanism for global inflation trends.
9. Crypto Market Macro Conditions
The crypto ecosystem is operating under tight macro conditions:
Higher interest rates reduce speculative liquidity
Venture capital inflows are slowing
Faster deleveraging during volatility events
Increased correlation with equity markets
Stablecoin System Dynamics
Treasury-linked yield models increasing issuer profitability
Slower retail liquidity expansion
More controlled capital rotation within crypto markets
10. DeFi Ecosystem Pressure
Decentralized finance is facing structural competition from traditional yield instruments:
Reduced attractiveness of high-risk yield strategies
Slower total value locked (TVL) expansion
Capital shifting toward lower-risk financial instruments
Despite this, core DeFi infrastructure remains active and evolving.
11. Market Correlation Evolution
A key structural change in 2026 is the rising correlation between asset classes:
Bitcoin increasingly follows equity market trends
Crypto assets respond strongly to liquidity cycles
Digital assets behave as high-volatility macro instruments
This reduces diversification benefits but increases macro trading opportunities.
12. Long-Term Financial System Evolution
The ongoing geopolitical transition may lead to:
Expansion of regional payment systems
Increased cross-border settlement diversification
Greater use of alternative financial infrastructure
Gradual reshaping of global trade settlement networks
Digital assets may play a growing role in experimental settlement systems, although adoption remains gradual and controlled.
At the same time, regulatory frameworks are becoming more structured globally.
13. Final Macro Conclusion
The Putin–China diplomatic engagement represents part of a broader global transformation rather than an isolated event.
Key Market Summary
Energy markets remain inflation-driven and volatile
Liquidity conditions remain tight due to high interest rates
Gold remains the strongest safe-haven asset
Bitcoin and Ethereum remain macro-sensitive instruments
Crypto markets are highly dependent on global liquidity cycles
Global financial system is moving toward multi-regional structure
Overall Market Environment
Markets are currently in a transition phase where geopolitical developments and macroeconomic conditions dominate price direction across all major asset classes.
repost-content-media
  • Reward
  • 1
  • Repost
  • Share
Yusfirah:
To The Moon 🌕
#30YearTreasuryYieldBreaks5%
The 30-year US Treasury yield holding above the 5% level marks a major macro regime shift that is reshaping global capital allocation. With Bitcoin trading around $76,800 and Ethereum near $2,108, crypto markets are now operating under tighter liquidity conditions, stronger competition from risk-free yields, and a more defensive institutional stance. This is not just a short-term fluctuation—it is a structural repricing of risk across all asset classes.
1. Macro Shift: Risk-Free Yield Becomes a Strong Competitor
When the 30-year Treasury yield sustains above 5%, i
BTC-2.75%
ETH-3.21%
USDC0.02%
HighAmbition
#30YearTreasuryYieldBreaks5%
The 30-year US Treasury yield holding above the 5% level marks a major macro regime shift that is reshaping global capital allocation. With Bitcoin trading around $76,800 and Ethereum near $2,108, crypto markets are now operating under tighter liquidity conditions, stronger competition from risk-free yields, and a more defensive institutional stance. This is not just a short-term fluctuation—it is a structural repricing of risk across all asset classes.
1. Macro Shift: Risk-Free Yield Becomes a Strong Competitor
When the 30-year Treasury yield sustains above 5%, it fundamentally alters global capital preferences. Investors are now presented with a rare opportunity: a guaranteed ~5% annual return backed by the US government, something that has not been available in decades.
During the ultra-low interest rate era, capital had almost no choice but to move into risk assets like Bitcoin, Ethereum, equities, and venture capital. Now the situation is reversed—capital has a strong, safe alternative again.
For institutional allocators such as pension funds, insurance companies, and sovereign wealth funds, this shift is critical. The decision is no longer “cash vs risk assets,” but “safe 5% yield vs volatile growth assets.”
2. Opportunity Cost Pressure on Crypto Assets
The opportunity cost of holding crypto rises sharply in this environment.
Bitcoin at $76,800 offers no yield
Ethereum at $2,108 offers staking yield, but still volatile and risk-exposed
Treasury bonds offer ~5% guaranteed return
This creates a direct mathematical disadvantage for crypto in traditional portfolio models.
As a result:
Institutional BTC ETF inflows slow down
Profit-taking increases during rallies
Risk exposure is actively reduced across hedge funds
This does not mean capital exits crypto completely, but it becomes selectively deployed rather than aggressively allocated.
3. Bitcoin Price Behavior Under High-Yield Regime
Bitcoin increasingly behaves like a macro-sensitive risk asset, not an independent hedge instrument.
Current Market Context:
BTC: $76,800
Key psychological range under pressure: $75,000–$80,000
Key Impacts:
Strong resistance to upside expansion
Increased sensitivity to bond yield spikes
Faster corrections during liquidity contractions
Bitcoin’s “digital gold” narrative weakens temporarily when 5% risk-free yield competes directly with long-term store-of-value positioning.
However, Bitcoin still maintains long-term structural demand due to:
Fixed supply
Institutional adoption via ETFs
Sovereign debt concerns
4. Ethereum Under Dual Pressure: Yield Competition + Risk Appetite
Ethereum faces a more complex situation than Bitcoin.
Current ETH Price:
ETH: $2,108
Structural Challenge:
Ethereum staking yields (historically ~3–5%) now compete directly with Treasury yields.
This creates a compressed yield premium scenario where:
Treasuries = safe 5%+
ETH staking = similar yield but with volatility risk
Result:
Reduced attractiveness of staking for conservative capital
Lower DeFi participation
Slower liquidity inflows into ETH-based ecosystems
Ethereum remains fundamentally strong, but capital efficiency advantage temporarily weakens.
5. DeFi Ecosystem Liquidity Compression
Decentralized Finance (DeFi) is one of the most affected sectors.
When risk-free yields rise:
Stablecoin deposits shift toward Treasuries
Borrowing demand decreases
Yield spreads compress
Consequences:
Lower TVL (Total Value Locked)
Higher borrowing costs in lending protocols
Increased liquidation cascades during volatility spikes
DeFi thrives in low-rate environments—5% Treasury yields reverse that advantage.
6. Stablecoin System Stress and Capital Migration
Stablecoins such as USDT and USDC are indirectly impacted because reserves are heavily invested in Treasuries.
Key Dynamic:
Issuers earn high yield from reserves
Users earn zero yield on holdings
This creates a hidden arbitrage pressure:
Capital prefers direct Treasury exposure
Stablecoin circulation growth slows
Result:
Reduced stablecoin liquidity expansion
Lower on-chain trading depth during risk-off periods
7. Leverage Reduction and Market Fragility
Higher Treasury yields increase global borrowing costs, which directly impacts crypto leverage markets.
Effects include:
Higher futures funding rates
Reduced margin appetite
Forced deleveraging events
This leads to:
Faster downside moves
Shorter but sharper volatility cycles
Reduced speculative excess
Leverage contraction is one of the strongest short-term bearish forces in crypto.
8. Correlation Increase Across Risk Assets
A key structural change is rising correlation between:
Crypto
Equities
Tech stocks
When yields rise:
All risk assets move in the same direction
Diversification benefits weaken
Macro becomes dominant driver
This reduces Bitcoin’s independence as a portfolio hedge.
9. Venture Capital and Crypto Innovation Slowdown
High risk-free yields increase discount rates, which reduces startup valuations.
Impact:
Lower crypto VC funding
Reduced token launch valuations
Slower ecosystem expansion
Capital prefers:
Guaranteed 5% returns instead of:
High-risk long-duration crypto startups
This shifts the industry from expansion phase to capital efficiency phase.
10. Dollar Strength and Global Liquidity Drain
Rising yields strengthen the US dollar, which creates:
Capital inflows into USD assets
Pressure on emerging markets
Reduced global crypto purchasing power
Since crypto is globally traded in USD terms, this acts as an additional headwind.
11. Historical Context and Market Cycles
In previous cycles:
2020–2021: near-zero yields → crypto bull run
2022: rising yields → deep crypto bear market
Current conditions resemble a late tightening phase, where liquidity is constrained and speculative appetite weakens.
12. Forward Outlook: Key Scenarios
Bearish Scenario:
Yield moves toward 5.3%+
BTC breaks below $75,000
ETH moves toward $1,900–$2,000 range
Neutral Scenario:
Yields stabilize 4.9%–5.1%
Crypto trades in consolidation range
Low volatility accumulation phase
Bullish Relief Scenario:
Yield retreats below 5%
Liquidity returns gradually
BTC reclaims $80K–$85K zone
ETH recovers toward $2,300+
Final Conclusion
The 30-year Treasury yield above 5% is a structural macro headwind for crypto markets. It does not break the long-term thesis of Bitcoin or Ethereum, but it significantly changes short-to-mid term capital flows.
With BTC at $76,800 and ETH at $2,108, the market is currently in a defensive macro phase, where capital prioritizes safety over speculation.
Crypto is no longer operating in isolation—it is now deeply integrated into global macro liquidity cycles. The next major move will depend less on internal crypto catalysts and more on whether Treasury yields continue rising or begin to stabilize.
repost-content-media
  • Reward
  • 1
  • Repost
  • Share
Yusfirah:
To The Moon 🌕
#GtTokenAnalysis.
Current GT Price: ~$7.01
Market Cap: ~$746.52 Million
Market Rank: #66 Global Crypto Asset
GateToken (GT) has evolved from a simple exchange utility token into a major ecosystem asset supporting one of the world’s leading crypto trading platforms, gate.com. Over the years, GT has expanded into a utility-driven and ecosystem-focused digital asset that combines exchange benefits, blockchain infrastructure utility, VIP privileges, launch participation access, staking opportunities, and long-term supply reduction mechanisms.
Today, GT represents not only the growth of Gate.com i
GT-1.41%
HighAmbition
#GtTokenAnalysis.
Current GT Price: ~$7.01
Market Cap: ~$746.52 Million
Market Rank: #66 Global Crypto Asset
GateToken (GT) has evolved from a simple exchange utility token into a major ecosystem asset supporting one of the world’s leading crypto trading platforms, gate.com. Over the years, GT has expanded into a utility-driven and ecosystem-focused digital asset that combines exchange benefits, blockchain infrastructure utility, VIP privileges, launch participation access, staking opportunities, and long-term supply reduction mechanisms.
Today, GT represents not only the growth of Gate.com itself but also the expansion of the broader Gate ecosystem, including GateChain infrastructure, Web3 integrations, launch platforms, on-chain applications, and user reward systems.
🌍 1. What is GateToken (GT)?
GateToken (GT) is the native ecosystem token of Gate.com.
GT supports: • Exchange fee discounts
• VIP tier upgrades
• Launchpad participation
• HODLer rewards
• GateChain gas utility
• Web3 ecosystem integration
• DeFi and staking utilities
GT operates with a long-term ecosystem expansion and supply reduction model designed to strengthen utility across the platform.
📊 2. Current GT Market Snapshot
💰 Current Price: ~$7.01
📈 24-Hour Performance: ~ -0.2%
🏦 Market Capitalization: ~$746.52 Million
🌐 Global Ranking: #66 crypto asset globally
📉 Historical Performance: • Growth from ATL: +1,530%
• Annual growth: +227%
This growth reflects how GT has expanded alongside the development of the Gate ecosystem.
🔥 3. GT Tokenomics — Why GT Is Different
GT uses a strong supply reduction structure.
🟢 Total GT Burned: 187.37 Million GT
This represents: ~60.7% of original supply permanently removed.
🟢 Current Circulating Supply: 106.47 Million GT
This represents: ~34.49% of total historical supply.
🔥 Quarterly Burn Example: Q1 2025 Burn: 1.54 Million GT
Estimated value: ~$33.84 Million
These burns permanently reduce supply over time
⚙️ 4. Core GT Utility Inside Gate Ecosystem
GT is integrated across multiple services inside the Gate ecosystem.
💸 Trading Fee Discounts Users can receive: • Up to 20% fee discounts
• Lower futures and spot trading costs
• Additional VIP reductions
👑 VIP Tier Acceleration GT holdings help users access higher VIP levels with: • Lower fees
• Better liquidity access
• Premium account benefits
• Faster withdrawal limits
🚀 Launchpool Benefits GT holders can: • Stake GT
• Earn new project rewards
• Redeem principal flexibly
• Access ecosystem opportunities
🎁 HODLer Airdrop Program Users holding as little as: • 1 GT
can receive: • Free token airdrops
• Reward distributions
• Promotional ecosystem benefits
Total distributed: • Over 33.2 Million GT-equivalent rewards
🌟 Launchpad Access GT holders receive access to: • Early-stage token sales
• New crypto projects
• Priority participation opportunities
🍬 CandyDrop Rewards Users can complete: • Trading tasks
• Platform activities
• Social engagement
to receive additional ecosystem rewards.
🛠️ 5. GateChain Integration
GT is also the utility token of GateChain.
GT supports: • Transaction fees
• Smart contract operations
• On-chain ecosystem functions
• Validator participation
This gives GT blockchain infrastructure utility beyond exchange services.
🔗 6. Ecosystem Expansion
GT utility continues expanding across multiple services and integrations including: • Web3 applications
• Payment integrations
• Blockchain ecosystems
• Digital asset platforms
This strengthens GT utility outside traditional exchange usage.
📈 7. Staking & Passive Participation
GT holders can participate in: • Staking opportunities
• Ecosystem reward systems
• GateChain validator participation
Approximate participation rewards: ~1%+ depending on structure.
🧠 8. Why GT Value Has Increased Over Time
Several long-term factors support GT growth:
🔥 Continuous Supply Reduction Quarterly burns continue reducing available supply.
🌍 Ecosystem Expansion Gate continues expanding: • Exchange services
• Web3 integrations
• Blockchain infrastructure
• DeFi functionality
• Global ecosystem development
📊 User Growth As user activity grows: • More utility demand appears
• More Launchpool participation occurs
• More GT ecosystem usage develops
🚀 Platform Innovation Gate continues introducing: • New products
• AI tools
• On-chain integrations
• Ecosystem campaigns
• Reward systems
🟢 9. What Gate.com Is Doing to Support GT Ecosystem Growth
🔥 A. Quarterly Supply Reduction Regular GT burns continue reducing supply over time.
🚀 B. Expanding GT Utility Gate continuously adds: • New GT use cases
• Additional ecosystem integrations
• More staking systems
• Participation features
🌐 C. GateChain Development GT powers key GateChain ecosystem functions and network activity.
💰 D. Reward Programs Programs including: • HODLer Airdrop
• Launchpool
• CandyDrop
• VIP ecosystem benefits
encourage long-term ecosystem participation.
📈 E. User Ecosystem Benefits GT acts as an ecosystem participation asset where increased engagement unlocks additional platform advantages.
📊 10. GT Price Outlook & Future Potential
Current Price: ~$7.01
Important resistance levels: • $7.50
• $8.20
• $10 psychological zone
Major support levels: • $6.50
• $6.00
• $5.40
📈 Long-Term Growth Factors: • Ecosystem expansion
• User growth
• Continued burns
• Market conditions
• Broader crypto adoption
🧠 11. GT Market Interpretation
GT currently functions as: • A utility token
• An ecosystem participation token
• A blockchain infrastructure token
• A loyalty-focused ecosystem asset
Its multi-layer utility structure makes GT one of the more ecosystem-integrated exchange-related digital assets in the broader crypto market.
🎯 12. Final Conclusion
GateToken (GT) combines: • Supply reduction mechanisms
• Exchange utility
• Blockchain infrastructure functionality
• Reward systems
• Passive participation opportunities
• VIP ecosystem benefits
With more than 60% of total supply already removed from circulation, expanding ecosystem integration, growing utility demand, and continuous platform innovation from Gate.com, GT continues developing as a long-term ecosystem-focused digital asset connected directly to the growth of the broader Gate ecosystem.
repost-content-media
  • Reward
  • Comment
  • Repost
  • Share
#TradfiTradingChallenge
#BTC
Current BTC Price is trading near $77,555.70 after Bitcoin entered a major consolidation phase of the 2026 cycle following the strong rally toward the $82,000 region, where institutional inflows, ETF demand, macro liquidity expansion, and improving regulatory sentiment pushed the market into temporary overextension before a controlled pullback began shaping the current structure.
Recent geopolitical tensions in the Middle East, including renewed escalation concerns between Israel and regional adversaries and the possibility of further military strikes in the comin
BTC-2.76%
HighAmbition
#TradfiTradingChallenge
#BTC
Current BTC Price is trading near $77,555.70 after Bitcoin entered a major consolidation phase of the 2026 cycle following the strong rally toward the $82,000 region, where institutional inflows, ETF demand, macro liquidity expansion, and improving regulatory sentiment pushed the market into temporary overextension before a controlled pullback began shaping the current structure.
Recent geopolitical tensions in the Middle East, including renewed escalation concerns between Israel and regional adversaries and the possibility of further military strikes in the coming days, have added an additional layer of uncertainty across global risk assets, and Bitcoin—like other high-risk instruments—has been reacting to this uncertainty through short-term volatility and liquidity-driven swings rather than any fundamental breakdown in long-term demand.
At the same time, Bitcoin’s recent downside movement is not being driven by a single event, but rather by a combination of profit-taking from the $81K–$82K region, liquidation of leveraged long positions, strengthening macro caution, and temporary risk-off sentiment across global markets where investors are reducing exposure to volatile assets until geopolitical clarity improves.
📊 1. Current Market Snapshot & Price Action
Bitcoin is currently priced around $77,555.70 after reaching an intraday high near $77,659.90 and a low near $76,138.60, showing that despite short-term volatility, the market is still holding above critical support zones while buyers continue defending the mid-$70K region with consistent liquidity absorption.
Over the past week, Bitcoin moved from approximately $81,089 on May 14 down toward $79,113 on May 15, then further cooling toward $78,146 on May 16 and around $77,458 on May 17, followed by stabilization near $77,003 on May 18 and $76,832 on May 19 before recovering again toward the current $77,555 level, which reflects a structured retracement rather than panic-driven collapse.
This movement from $82,000 highs toward the $76,000–$77,000 range is being interpreted as a healthy reset phase inside a broader bullish cycle, where leverage is being removed and the market is preparing for its next directional expansion.
📈 2. Technical & Structural Analysis
Bitcoin’s technical behavior shows short-term weakness but medium-term structural strength remains intact, as moving averages are being tested while institutional positioning continues to support the broader trend.
🔹 RSI Structure
RSI currently sits near 44.53 after previously reaching almost 59.98 during the rally phase, showing that momentum has cooled from overbought conditions into a neutral zone where neither bulls nor bears have full control, and the market is temporarily balancing before a new directional move develops.
🔹 MACD Structure
MACD remains negative at around -702.21 with a signal gap near -421.01, showing that bearish momentum is still present, but the narrowing gap indicates weakening downside pressure and possible stabilization if buying demand increases near support zones.
🔹 Moving Averages
Bitcoin is currently trading slightly below the 30-day average near $78,670 and also below the 200-day average near $81,298, which confirms short-term weakness, but price proximity to these levels suggests that any breakout above $79K–$81K could quickly restore bullish momentum.
⚖️ 3. Liquidity & Market Structure
Bitcoin remains trapped between two major liquidity zones, creating a compression structure where volatility can expand sharply once a breakout occurs.
Upper liquidity cluster sits around $80,634–$81,654 where billions in short positions are concentrated, meaning that a breakout above this zone could trigger forced liquidations and accelerate price toward higher resistance levels.
Lower liquidity cluster sits around $73,578–$74,607 where long positions are heavily concentrated, meaning that a breakdown below this zone could trigger liquidation-driven downside volatility before larger buyers step in.
This compression between $74K and $81K is creating a coiled market structure waiting for a catalyst, whether macroeconomic, geopolitical, or liquidity-driven.
🏦 4. Institutional Flow & Whale Behavior
Institutional accumulation continues to act as a stabilizing force in the market.
Large financial entities such as Morgan Stanley have expanded exposure by adding over 321 BTC valued near $25.8 million, bringing total holdings above 3,314 BTC worth approximately $266 million, showing continued confidence in Bitcoin as a long-term macro asset.
Similarly, Capital B in France has increased holdings by adding around 192 BTC near the $78,948 level, reinforcing the trend of corporate treasury accumulation even during periods of volatility.
At the same time, whale activity shows selective profit-taking, such as a large holder transferring around 500 BTC to exchanges after accumulating near $67,646, locking in roughly $8.42 million in gains, which reflects strategic distribution rather than panic selling behavior.
📉 5. Why Bitcoin is moving lower right now
The current pullback from $82K toward $77K is primarily driven by three combined forces rather than a single trigger.
First, profit-taking pressure emerged after Bitcoin entered the $81K–$82K resistance zone where many traders locked in gains.
Second, leveraged long positions were liquidated as price volatility increased, especially around support retests near $76K–$77K.
Third, geopolitical uncertainty—especially rising tensions and renewed concerns about potential Israeli military action and broader regional escalation risks—has increased risk aversion across global markets, pushing investors temporarily toward safer assets and reducing exposure to volatile instruments like Bitcoin.
This combination has created short-term downward pressure, but importantly, it has not broken the broader accumulation structure.
📊 6. Funding & Sentiment Conditions
Funding rates remain extremely low, generally below 0.001%, which shows that excessive leverage has been flushed out of the system after the rally toward $82K.
This is typically a constructive condition because it reduces liquidation risk and allows the market to rebuild momentum in a more stable environment.
📌 7. Key Levels to Watch
Resistance zones remain at $78,500, $79,500, $80,600, and $81,300, and a breakout above these levels could rapidly accelerate momentum back toward the upper-$80K region if short liquidation pressure intensifies.
Support zones remain at $76,000, $74,600, and $73,500, and holding above these levels is critical to maintaining the current bullish cycle structure.
🧠 8. Market Psychology
The market is currently in a mid-cycle consolidation phase where volatility is being driven more by liquidity positioning and macro headlines than by structural breakdown.
Retail sentiment has cooled, while institutional accumulation continues, creating a quiet accumulation environment beneath visible price fluctuations.
Historically, this type of structure appears before major continuation moves in strong bullish cycles, especially when leverage resets and liquidity compresses tightly between defined zones.
🎯 9. Final Outlook
Bitcoin near $77,555 remains in a sensitive equilibrium zone where geopolitical uncertainty, liquidity compression, institutional accumulation, and technical consolidation are all interacting simultaneously.
The recent downside movement is being driven more by short-term risk reduction, geopolitical tension concerns, and profit-taking from higher levels rather than any structural weakness in long-term demand.
If Bitcoin stabilizes above $74K–$76K and reclaims $80K–$81K resistance, the next major expansion phase toward new highs could resume as liquidity conditions improve and market confidence returns across global risk assets.
repost-content-media
  • Reward
  • Comment
  • Repost
  • Share
#CLARITYActPassesSenateCommittee
Bitcoin Market Analysis and CLARITY Act Senate Committee Passage
Introduction: Regulatory Breakthrough Meets Market Consolidation
Bitcoin and the broader digital asset market are currently navigating a critical intersection of macroeconomic pressure, technical consolidation, and major regulatory development. The most significant recent catalyst is the advancement of the CLARITY Act (Digital Asset Market Clarity Act) through the U.S. Senate Banking Committee, where it passed with a bipartisan 15–9 vote on May 14, 2026.
At the same time, Bitcoin is trading in a
HighAmbition
#CLARITYActPassesSenateCommittee
Bitcoin Market Analysis and CLARITY Act Senate Committee Passage
Introduction: Regulatory Breakthrough Meets Market Consolidation
Bitcoin and the broader digital asset market are currently navigating a critical intersection of macroeconomic pressure, technical consolidation, and major regulatory development. The most significant recent catalyst is the advancement of the CLARITY Act (Digital Asset Market Clarity Act) through the U.S. Senate Banking Committee, where it passed with a bipartisan 15–9 vote on May 14, 2026.
At the same time, Bitcoin is trading in a tight consolidation range between approximately $79,000 and $81,000, after multiple attempts to break above resistance near $82,000 and repeated defenses of support around $78,000. This combination of regulatory progress and price compression has created a decisive environment for the next major move in the market cycle.
CLARITY Act: What the Senate Committee Passage Means
The CLARITY Act represents one of the most important legislative efforts in U.S. crypto history. Its core objective is to eliminate long-standing regulatory uncertainty by clearly defining how digital assets are classified and supervised.
The Senate Banking Committee’s approval does not make it law yet, but it is a major procedural milestone that signals strong bipartisan willingness to structure the crypto market rather than restrict it outright.
The bill now moves toward full Senate debate, potential amendments, and eventual reconciliation with the House version before reaching the President’s desk.
Core Purpose: Establishing Regulatory Clarity
The primary goal of the CLARITY Act is to resolve the long-standing jurisdictional conflict between two major regulators:
The Securities and Exchange Commission (SEC)
The Commodity Futures Trading Commission (CFTC)
For years, crypto projects have operated under uncertainty regarding whether tokens should be treated as securities or commodities. The CLARITY Act introduces clearer definitions:
Digital commodities (like Bitcoin and sufficiently decentralized assets) fall under CFTC oversight
Investment-contract tokens remain under SEC regulation
This distinction is critical because it removes overlapping enforcement pressure that has historically created legal risk for exchanges, developers, and institutional participants.
Structural Framework of the Bill
The legislation introduces a full market structure for digital assets, covering exchanges, brokers, and token issuers.
Key components include:
Mandatory registration standards for crypto trading platforms
Anti-money laundering (AML) compliance and reporting obligations
Consumer protection rules for retail participants
Defined pathways for token decentralization classification changes
Safe harbor protections for decentralized finance (DeFi) developers who do not control user funds
Stablecoin regulation with restrictions on yield-like rewards tied to passive holding
The stablecoin framework is particularly important because it attempts to balance innovation with financial stability concerns raised by traditional banking institutions.
Market Reaction: Immediate but Controlled Volatility
The immediate market response to the committee vote was cautiously positive but not euphoric. This reflects a key theme: markets are treating this as a long-term structural development rather than an immediate price catalyst.
Following the announcement:
Bitcoin briefly moved toward $82,000
Later retraced back into the $79,000–$81,000 range
Short liquidations exceeding $250 million were reported in leveraged positions
Despite this, Bitcoin did not enter a sustained breakout phase. Instead, price behavior suggests a “buy-the-rumor, moderate-the-news” structure combined with macroeconomic hesitation.
Bitcoin Price Structure: Key Levels and Behavior
Bitcoin remains locked in a defined technical corridor:
Support Zone: $78,000
Resistance Zone: $82,000
Current Trading Range: $79,000–$81,000
Repeated rejection at the upper boundary suggests sellers are active near resistance, while consistent defense of the lower boundary indicates ongoing accumulation interest.
This compression phase is often associated with volatility expansion events, where price eventually breaks sharply in one direction after liquidity builds on both sides.
Broader Market Drivers Beyond Regulation
While the CLARITY Act is a major narrative, Bitcoin’s price action is also shaped by multiple external factors:
ETF inflows and outflows affecting spot demand
Whale accumulation and distribution patterns
Futures market leverage and liquidation cascades
U.S. Federal Reserve interest rate expectations
Inflation data and macroeconomic sentiment
Equity market correlation and risk appetite cycles
These combined forces mean that regulatory optimism alone is not sufficient to trigger a breakout without supportive liquidity conditions
Institutional Impact: Why the Bill Matters Long-Term
One of the most important implications of the CLARITY Act is institutional participation.
If passed into law, it could significantly reduce legal uncertainty for:
Banks
Hedge funds
Pension funds
Asset managers
This would potentially unlock large-scale capital inflows into Bitcoin and other compliant digital assets.
Institutions generally require clear regulatory frameworks before deploying significant capital. The removal of ambiguity around SEC vs CFTC jurisdiction is therefore a major structural shift.
Market Sentiment: Cautious Optimism
Sentiment across the crypto market remains balanced between optimism and caution.
Bullish expectations are driven by:
Regulatory clarity improving legitimacy
Continued ETF demand
Strong on-chain accumulation signals
Long-term supply constraints of Bitcoin
However, caution remains due to:
Macro uncertainty
High leverage in derivatives markets
Possibility of delayed legislative progress
Resistance rejection near $82,000
Market participants are increasingly focused on confirmation rather than speculation.
Bullish Scenario: Potential Expansion Phase
If the CLARITY Act continues advancing through the full Senate with strong bipartisan support, the market could enter a new expansion phase.
In a bullish scenario:
Breakout above $82,000 could trigger momentum continuation
Bitcoin may target $85,000 initially
Extended upside could reach $88,000–$90,000
In strong macro conditions, longer-term projections extend beyond $100,000
This scenario depends heavily on sustained ETF inflows and supportive global liquidity conditions.
Bearish Scenario: Structural Risks Remain
Despite positive legislative progress, downside risks still exist independently of the bill:
Failure to pass full Senate vote due to amendments or political resistance
Macro tightening or delayed interest rate cuts
Equity market corrections triggering risk-off behavior
ETF outflows reducing spot demand
Breakdown of key support near $78,000
In a deeper correction scenario, Bitcoin could revisit:
$75,000 support
Psychological zone near $70,000 in extreme cases
However, many analysts view such pullbacks as cyclical rather than structural breakdowns.
Trading Environment: Strategy Considerations
Current market conditions favor range-based strategies until a confirmed breakout occurs.
Key strategic approaches include:
Accumulation near support zones during dips
Profit-taking near resistance levels
Strict risk management due to leveraged volatility
Avoiding overexposure during consolidation phases
Waiting for volume-confirmed breakout above $82,000
A decisive move outside the current range is likely to define the next major trend phase.
Long-Term Outlook: Structural Market Evolution
The CLARITY Act’s advancement signals a broader transformation of the crypto industry from an uncertain frontier market into a regulated financial asset class.
Over time, this may lead to:
Reduced volatility due to institutional participation
Higher liquidity across exchanges
Stronger integration with traditional financial systems
Increased legitimacy of Bitcoin as a macro asset
This transition mirrors earlier phases in commodities and equity markets where regulatory clarity preceded large-scale adoption.
Conclusion: A Critical Inflection Point
The combination of Bitcoin’s consolidation near $80,000 and the CLARITY Act’s advancement through the Senate Banking Committee represents a significant inflection point for the digital asset market.
In the short term, price action remains range-bound and sensitive to macroeconomic and liquidity conditions. In the long term, regulatory clarity has the potential to reshape the structure of the entire crypto ecosystem by enabling institutional participation at a much larger scale.
The market is now positioned in a compression phase where both regulatory progress and technical structure are building toward a potential expansion. The next decisive move—above resistance or below support—will likely define the next major trend cycle for Bitcoin.
repost-content-media
  • Reward
  • Comment
  • Repost
  • Share
#BitcoinVShapedReversalBack
Bitcoin V-Shaped Reversal Back
Bitcoin is currently in one of the most important recovery structures of this cycle, where price action is showing a potential V-shaped reversal formation after a deep macro correction from the cycle high of approximately $126,000 (Oct 2025) down to a major accumulation low near $60,000 (early 2026).
As of mid-May 2026, Bitcoin trades around $82,000–$84,000, showing strong recovery momentum and re-entry into major liquidity zones.
This structure is important because V-shaped reversals often represent:
Emotional capitulation bottoming
BTC-2.75%
HighAmbition
#BitcoinVShapedReversalBack
Bitcoin V-Shaped Reversal Back
Bitcoin is currently in one of the most important recovery structures of this cycle, where price action is showing a potential V-shaped reversal formation after a deep macro correction from the cycle high of approximately $126,000 (Oct 2025) down to a major accumulation low near $60,000 (early 2026).
As of mid-May 2026, Bitcoin trades around $82,000–$84,000, showing strong recovery momentum and re-entry into major liquidity zones.
This structure is important because V-shaped reversals often represent:
Emotional capitulation bottoming phases
Liquidity re-accumulation zones
Fast trend reversal environments
Institutional re-entry phases
2. What is a V-Shaped Reversal? (Step-by-Step Breakdown)
A V-shaped reversal is a sharp market structure where price falls aggressively and then rebounds equally fast, forming a “V” shape.
Step 1: Sharp Decline Phase
Bitcoin drops from highs near $126,000 → $100,000 → $75,000 → $60,000
Panic selling increases
Liquidity gets cleared below major support zones
Stop-loss cascades trigger accelerated downside
Step 2: Capitulation Bottom Formation
Price stabilizes near $58,000–$62,000
Volatility spikes but downside slows
Buyers begin absorbing supply aggressively
Whale accumulation begins
Step 3: Sharp Recovery Phase
Price rebounds from $60,000 → $70,000 → $80,000 → $83,000
Volume increases on upside candles
Market sentiment shifts from fear → neutral → optimism
Short sellers begin to exit positions
Step 4: Continuation or Failure Zone
Either continuation to $92K–$100K+
Or rejection leading to retest of $70K–$65K
3. Current Bitcoin Market Structure (May 2026)
Bitcoin is currently positioned in a mid-recovery zone after strong rebound.
Key Price Levels:
Major cycle high: $126,000
Breakdown zone: $100,000
Macro support: $75,000
Deep accumulation low: $60,000
Current trading range: $82,000–$84,000
Liquidity Zones:
Upper liquidity: $88,000 → $92,000 → $100,000
Lower liquidity: $78,000 → $70,000 → $65,000
4. Technical Structure Confirmation Factors
1. Trend Reclaim Structure
Bitcoin has reclaimed:
Short-term moving averages
Broken resistance zones near $78K–$80K
Mid-range liquidity bands
2. Volume Expansion Pattern
Volume increased during recovery from $60K
Lower volume during pullbacks indicates absorption
Institutional participation gradually increasing
3. Market Structure Shift
Lower highs broken upward
Higher lows forming from $60K base
Transition from bearish → neutral → bullish structure
5. Fibonacci & Price Expansion Zones
Based on full-cycle movement:
0.236 retracement: ~$70,000
0.382 retracement: ~$78,000
0.5 retracement: ~$83,000 (current zone)
0.618 retracement: ~$92,000
0.786 retracement: ~$105,000
Full extension: $120,000–$135,000
6. Institutional Flow Analysis
ETF & Institutional Behavior:
ETF inflows are stabilizing after volatility phases
Mixed positioning from large funds
Accumulation during dips near $70K–$75K
Profit-taking near $85K–$90K
Whale Behavior:
Accumulation wallets increasing exposure below $80K
Distribution pockets visible near $90K–$100K
7. Polymarket-Style Probability Mapping
Will Bitcoin sustain V-shaped reversal?
Strong bullish continuation: 45–55%
Sideways consolidation: 30–40%
Failed reversal (double dip): 20–30%
Will BTC break $92K resistance?
Yes breakout scenario: 40–50%
Rejection + retrace: 50–60%
Will BTC revisit $70K again?
Yes (liquidity sweep): 35–45%
No (trend continuation): 55–65%
8. Bullish Scenario Breakdown
If V-shaped reversal confirms:
Break above $88K–$92K
Acceleration toward $100K–$110K
Mid-term extension toward $120K–$135K
Supercycle narrative reactivation toward $150K–$180K
9. Bearish Risk Scenario
If reversal fails:
Rejection near $85K–$88K
Drop back to $75K support
Possible liquidity sweep toward $65K–$60K
Formation of broader distribution range
10. Market Sentiment Structure
Current sentiment phases:
Retail: cautiously optimistic
Institutional: neutral accumulation
Derivatives: balanced leverage positioning
Long-term holders: strong holding behavior
Market is not fully bullish yet — it is in transition phase
11. Key Confirmation Signals
V-shaped reversal confirms only if:
Daily close above $92,000
Volume expansion continues
ETF inflows remain positive
No rejection from upper liquidity zones
Failure signals:
Breakdown below $78,000
ETF outflows spike
Low volume rally rejection
Bearish divergence formation
12. Final Conclusion
Bitcoin’s current structure strongly resembles a macro V-shaped recovery phase, transitioning from deep accumulation near $60K toward a potential trend reversal zone.
However, the structure is still incomplete until price confirms breakout above $92K–$100K resistance zone.
Until then, Bitcoin remains in a high-volatility confirmation zone, where both continuation and rejection scenarios remain active.
The next major move will likely be fast, directional, and liquidity-driven.
repost-content-media
  • Reward
  • Comment
  • Repost
  • Share
#GateSquareMayTradingShare
BITCOIN (BTC) NEXT MOVE — ADVANCED PROBABILITY MODEL (MAY 2026)
Current Price: $78,500 — A Critical Liquidity Zone Where Decisions Define Outcomes
This is not just another moment in the market where price randomly fluctuates and traders chase green candles or panic during red ones, this is a structurally important phase where Bitcoin is compressing within a high-stakes zone, and beneath this calm-looking price action, a complex battle is unfolding between institutional positioning, algorithmic execution, and retail psychology, and the outcome of this phase will def
BTC-2.75%
MMT-2.64%
HighAmbition
#GateSquareMayTradingShare
BITCOIN (BTC) NEXT MOVE — ADVANCED PROBABILITY MODEL (MAY 2026)
Current Price: $78,500 — A Critical Liquidity Zone Where Decisions Define Outcomes
This is not just another moment in the market where price randomly fluctuates and traders chase green candles or panic during red ones, this is a structurally important phase where Bitcoin is compressing within a high-stakes zone, and beneath this calm-looking price action, a complex battle is unfolding between institutional positioning, algorithmic execution, and retail psychology, and the outcome of this phase will define the next major directional move that can either reward prepared traders or completely wipe out those who are operating on emotions instead of structured thinking.
Most traders at this level are still stuck in a binary mindset, constantly asking whether Bitcoin will go up or down next, but that approach is fundamentally flawed because the market does not operate on certainty, it operates on probabilities, and the only way to stay consistently profitable in such an environment is to break the market into multiple scenarios, assign realistic percentage expectations, and prepare actionable strategies for each outcome instead of reacting late when the move has already happened
At the current $78,500 level, Bitcoin is sitting at a pivot zone where liquidity is building both above and below the price, meaning the market has incentives in both directions, which increases volatility potential and decreases predictability, and this is exactly why we shift from prediction to probability-based execution models.
SCENARIO 1: BULLISH EXPANSION (+12% to +18%) — MOMENTUM IGNITION PHASE
In this scenario, Bitcoin successfully defends its support structure and begins to attract aggressive buying pressure, not only from retail participants but more importantly from institutional flows that are quietly positioning themselves before a breakout becomes obvious to the majority, and once price starts pushing above key resistance zones, the market transitions from accumulation to expansion, triggering a chain reaction of momentum-driven buying and short liquidations.
From the current $78,500, a +12% to +18% move projects Bitcoin into the range of:
$87,900 → $92,600
This move is not just a simple upward trend, it is typically characterized by acceleration phases, where price moves faster as it rises due to the presence of liquidity clusters above resistance levels, and these clusters act like magnets, pulling price toward them as market makers exploit stop-loss orders and forced exits from short sellers.
However, one of the biggest misconceptions about bullish markets is that they are easy to trade, when in reality, they are filled with manipulative micro pullbacks, sudden volatility spikes, and fake breakdowns designed to remove weak hands before continuation, which means that traders without a clear plan often exit early and miss the majority of the move.
In this environment, patience and structure are more valuable than speed, and traders who scale into positions instead of chasing entries are the ones who extract the most value.
Bullish Strategic Insight:
If Bitcoin breaks above resistance with strong volume and holds above it, the probability of continuation toward $88K–$92K increases significantly, but success depends on disciplined execution rather than emotional reaction.
SCENARIO 2: SIDEWAYS CONSOLIDATION (±5%) — LIQUIDITY ACCUMULATION PHASE
This is the most deceptive phase of the market, where Bitcoin appears stable on the surface but is internally building the conditions necessary for a larger move, and during this time, price oscillates within a relatively tight range, creating multiple false signals that trap traders on both sides.
From $78,500, a ±5% range defines:
👉 Lower Range: ~$74,500
👉 Upper Range: ~$82,400
This phase is often misunderstood as “boring” or “inactive,” but in reality, it is one of the most strategically important zones, because it is where large players accumulate positions without significantly moving the market, while retail traders exhaust themselves through overtrading and inconsistent decision-making
The defining characteristics of this phase include:
Frequent fake breakouts above resistance followed by quick reversals
Sudden dips below support that recover rapidly
Lack of sustained momentum in either direction
Declining emotional conviction among traders
This environment punishes impatience and rewards precision, and traders who understand this phase shift their focus from aggressive trend trading to range-based strategies, smaller position sizes, and strict risk management.
Sideways Strategic Insight:
Bitcoin moving between $74K–$82K is not a signal of weakness, it is a preparation phase, and those who preserve capital here gain a significant advantage when the breakout eventually occurs.
SCENARIO 3: BEARISH CORRECTION (-10% to -15%) — LIQUIDITY RESET PHASE
If Bitcoin fails to maintain its current support structure and selling pressure intensifies, the market can enter a controlled corrective phase where price moves downward with purpose, targeting liquidity zones below and resetting the overall structure
From $78,500, a -10% to -15% move places Bitcoin in the range of:
$70,600 → $66,700
This phase is often perceived as a collapse by inexperienced traders, but in reality, it is a necessary market function, where excess leverage is removed, funding rates normalize, and long positions that were built without proper risk control are forced out of the system
The transition into this phase is typically confirmed by:
Strong breakdown below support with increased volume
Weak recovery attempts that fail to reclaim lost levels
Rapid shift in sentiment from optimism to fear
This is where the majority makes critical mistakes, either by panic selling near the bottom or attempting to catch reversals without confirmation, both of which result in losses, while experienced traders either capitalize on the downside with controlled risk or patiently wait for high-probability re-entry zones.
Bearish Strategic Insight:
A move toward $66K–$70K is not the end of Bitcoin’s structure, it is a recalibration phase that creates future opportunity for those who remain patient and calculated.
DEEP MARKET REALITY — UNDERSTAND THIS OR GET LEFT BEHIND
At $78,500, Bitcoin is not simply choosing a direction, it is building a decision environment, and traders who fail to adapt to this complexity will continue to operate with outdated thinking patterns that no longer work in modern markets.
The truth is harsh but clear:
👉 The market is engineered to exploit emotional behavior
👉 Liquidity exists where traders are most vulnerable
👉 Price moves toward pain, not comfort
And this is why probability-based thinking is not optional, it is essential.
repost-content-media
  • Reward
  • Comment
  • Repost
  • Share
#GateSquareMayTradingShare
WHY YOUR STOP LOSS ALWAYS GETS HIT BEFORE THE MARKET MOVES IN YOUR DIRECTION
This is not bad luck. This is not randomness. This is engineered market structure, smart money psychology, and liquidity mechanics working in perfect harmony to extract value from predictable retail behavior.
In today’s Bitcoin market hovering around $78,500, we are in a classic consolidation zone where both bullish and bearish positions are heavily clustered. Price isn’t wandering aimlessly — it is deliberately probing liquidity pools on both sides before committing to the next major dir
BTC-2.75%
HighAmbition
#GateSquareMayTradingShare
WHY YOUR STOP LOSS ALWAYS GETS HIT BEFORE THE MARKET MOVES IN YOUR DIRECTION
This is not bad luck. This is not randomness. This is engineered market structure, smart money psychology, and liquidity mechanics working in perfect harmony to extract value from predictable retail behavior.
In today’s Bitcoin market hovering around $78,500, we are in a classic consolidation zone where both bullish and bearish positions are heavily clustered. Price isn’t wandering aimlessly — it is deliberately probing liquidity pools on both sides before committing to the next major directional leg. Most traders lose here not because their analysis is wrong, but because they fail to understand that their stop loss is often the very fuel the market needs.
THE CORE TRUTH: STOP LOSSES = LIQUIDITY POOLS
Large institutions, whales, and market makers cannot enter or exit multi-million or billion-dollar positions without sufficient liquidity. They need opposing orders to absorb their size without massive slippage.
Where does this liquidity come from?
Retail stop losses
Panic sells/buys
Overleveraged liquidations
Late breakout entries
Emotional FOMO/FUD reactions
Your stop loss is not hidden. In aggregated order flow data, clustered stops appear as clear liquidity zones. Algorithms and smart money target these zones first because that’s where the easiest order execution happens.
Markets do not move toward “fair value” — they move toward liquidity. Once liquidity is swept (collected), the real directional move often begins.
THE CLASSIC STOP LOSS HUNT MECHANISM — STEP BY STEP
Retail identifies obvious level
Example: Support at $75,000 or Resistance at $80,000.
Predictable placement
Longs put stops 1-2% below support ($74,500–$74,800)
Shorts put stops above resistance
Breakout traders set buy-stops or limit orders at round numbers
The hunt phase
Price is driven toward the cluster with increasing speed. Volume spikes as liquidations cascade and fuel the move.
Liquidity collection
Stops are triggered → large block of orders executed → smart money enters/exits the opposite side.
Reversal & real move
Price reverses sharply. The original directional bias you expected now plays out — but without you in the trade.
This pattern repeats across timeframes: 15-minute wicks, daily fakeouts, and weekly liquidity sweeps.
UPWARD STOP HUNT (BULL TRAP / SHORT SQUEEZE LIQUIDATION)
Scenario at $78,500:
Resistance cluster at $80,000 (psychological round number)
Short sellers’ stops and retail breakout buy orders stacked above
Price raids $81,000–$82,500 on strong volume and green candles
Social media turns euphoric, FOMO buying accelerates
Short liquidations add rocket fuel
Then the trap:
Sharp rejection candle with long upper wick
Price collapses back below $78,500, often targeting the lower liquidity pool
Result:
Late longs trapped at highs
Shorts liquidated at worst possible moment
Smart money distributed into strength
DOWNWARD STOP HUNT (BEAR TRAP / LONG LIQUIDATION)
Opposite scenario:
Support at $75,000 breaks
Panic selling + long liquidations drive price to $74,000 or $72,000–$70,000 zone
Headlines scream “Bitcoin crash”
Weak hands capitulate
Then the reversal:
Aggressive buying appears from lower liquidity pool
Price sweeps lows, reverses, and climbs back through $78,500 toward $80K+
Result:
Cheap accumulation by smart money
Panic sellers miss the rebound
Bears who shorted the low get squeezed
WHY YOUR STOPS ARE “TOO OBVIOUS”
Retail behavior is highly correlated because:
Same YouTube channels, Twitter accounts, and TradingView setups
Same textbook support/resistance rules
Same risk management teachings (tight stops below/above candles)
Emotional clustering around round numbers ($70K, $75K, $80K, $100K)
This creates liquidity symmetry that institutions can map and exploit with high precision.
VOLUME + WICK STRUCTURE — THE TELLTALE SIGNS
During a hunt:
Explosive volume spike
Long wick (upper or lower)
Fast move into obvious level
Immediate reversal on decreasing volume
After liquidity sweep:
Volume dries up
Price consolidates or trends cleanly
Higher probability continuation
Many traders get stopped out, then watch the market move in their original direction with perfect structure — the classic “wrong twice” feeling.
PSYCHOLOGY: THE INVISIBLE FUEL
Greed → Late entries at breakouts
Fear → Premature exits at breakdowns
Hope → Holding through hunts
FOMO → Chasing wicks
Smart money doesn’t fight this psychology — they engineer it.
PROFESSIONAL APPROACH — HOW TO STOP FEEDING LIQUIDITY
Wait for the sweep: Enter after obvious liquidity has been taken, not before.
Wider invalidation: Use structural levels (higher timeframe swing points) instead of tight candle-based stops.
Avoid round numbers for stops — place them in less obvious zones.
Lower leverage in consolidation/uncertain zones.
Think in liquidity terms: Ask “Where will stops be clustered?” instead of “Where will price go?”
Multiple timeframe confirmation: Look for alignment across daily + 4H + 1H.
Position sizing: Risk less when liquidity hunts are probable.
Fakeout trading: Some advanced traders deliberately trade the manipulation phase.
CURRENT BTC LIQUIDITY MAP — MAY 2026 ($78,500)
Upper Liquidity Pool: $80,000 – $83,000+
(Short stops, breakout buys, FOMO targets)
Lower Liquidity Pool: $74,000 – $70,000
(Long stops, panic liquidation clusters, support breaks)
Most probable near-term behavior:
Sweep one side aggressively → trap participants → reverse and target the opposite pool → then expansion into the real trend.
THE HARDEST TRUTH
Your stop loss isn’t being hunted personally. It is simply part of a statistically predictable liquidity map that the market clears before its next major move.
The market is mechanical, not emotional.
If your placement is obvious, your exit was already priced in.
ULTIMATE POWER LINE:
“The market does not punish your stop loss — it collects what was always predictable. Master liquidity, or remain part of the liquidity.”
Trade less. Observe more. Think like the institutions, not like the crowd.
Once you internalize that price is the distraction and liquidity is the truth, your entire trading psychology shifts — and so do your results.
Stay disciplined.#GateSquare #CreatorCarnival #ContentMining
repost-content-media
  • Reward
  • Comment
  • Repost
  • Share
#USSeeksStrategicBitcoinReserve
US SEEKS STRATEGIC BITCOIN RESERVE
Current BTC Context: ~$78,000 – $78,900 (Heavy Liquidity Compression Zone inside $75K–$83K Macro Range)
1. INTRODUCTION — THIS IS NOT A CRYPTO STORY, THIS IS A GLOBAL MONETARY RESTRUCTURING SIGNAL
The narrative around US Strategic Bitcoin Reserve is not something that should be treated as a normal crypto headline or temporary market catalyst. It represents a deep transformation happening inside the global financial system where Bitcoin is slowly being pulled from the category of “speculative digital asset” into the category
HighAmbition
#USSeeksStrategicBitcoinReserve
US SEEKS STRATEGIC BITCOIN RESERVE
Current BTC Context: ~$78,000 – $78,900 (Heavy Liquidity Compression Zone inside $75K–$83K Macro Range)
1. INTRODUCTION — THIS IS NOT A CRYPTO STORY, THIS IS A GLOBAL MONETARY RESTRUCTURING SIGNAL
The narrative around US Strategic Bitcoin Reserve is not something that should be treated as a normal crypto headline or temporary market catalyst. It represents a deep transformation happening inside the global financial system where Bitcoin is slowly being pulled from the category of “speculative digital asset” into the category of sovereign-level financial reserve instrument.
At the current Bitcoin price zone of approximately $78,000 to $78,900, the market is not simply reacting to technical indicators or retail sentiment. Instead, it is reacting to something much bigger — a macro shift in global capital perception, where institutions, sovereign entities, and large funds begin adjusting their long-term expectations about Bitcoin’s role in global monetary structure.
Historically, global reserve systems have always been based on trust and scarcity. Gold dominated for centuries due to physical scarcity and universal acceptance. The US dollar became dominant due to military, political, and economic influence. Treasury bonds became a reserve instrument due to debt-backed liquidity and stability.
Now Bitcoin introduces a completely new category into this system — a decentralized, mathematically fixed-supply, globally transferable digital scarcity asset with no central authority control.
This is why even the discussion of Bitcoin as a strategic reserve asset changes everything. Markets do not wait for confirmation; markets immediately begin pricing probability, positioning capital based on expectation rather than certainty.
2. STRATEGIC BITCOIN RESERVE — DEEP STRUCTURAL MEANING BEYOND SURFACE LEVEL THINKING
A Strategic Bitcoin Reserve means Bitcoin is being evaluated not for trading, speculation, or short-term profit cycles, but for long-term sovereign financial stability, macro hedging, and geopolitical financial positioning.
In traditional financial systems, governments hold reserves in multiple categories: Foreign currencies for trade stability
Gold for inflation protection
Treasury bonds for liquidity and credit strength
Introducing Bitcoin into this structure means a completely new layer is being tested — a non-sovereign, decentralized reserve asset that operates outside traditional monetary control systems.
This changes Bitcoin’s identity fundamentally because:
Bitcoin becomes a hedge against long-term fiat currency debasement
Bitcoin becomes a diversification layer for sovereign balance sheets
Bitcoin becomes a global liquidity reserve that is not controlled by any central bank
Bitcoin becomes a mathematically scarce asset with absolute supply limit of 21,000,000 BTC
Unlike traditional assets, Bitcoin does not rely on trust in an issuer — it relies on cryptographic certainty and global network validation.
This is why Bitcoin is no longer just a trading asset — it is becoming a candidate for global monetary system evolution.
3. CURRENT MARKET STRUCTURE — BITCOIN AT $78K LIQUIDITY WAR ZONE
At current levels between $78,000 and $78,900, Bitcoin is not trending. It is trapped inside a highly engineered liquidity compression structure, where price is being deliberately rotated between two major liquidity pools before a major directional expansion.
This structure exists between:
Upper liquidity zone: $80,000 – $83,500
Lower liquidity zone: $75,000 – $73,000
This means the market is currently in a dual-sided trap environment, where: Both bullish and bearish participants are positioned
Stop losses exist above resistance and below support
Liquidity is stacked on both sides equally
This creates a situation where price movement is not driven by direction first, but by liquidity extraction first, direction second.
This is why Bitcoin appears unpredictable in this zone. In reality, it is extremely structured — just not in a way retail traders usually understand.
4. GLOBAL MARKET IMPACT — HOW THIS NARRATIVE REWIRES CAPITAL BEHAVIOR
When sovereign-level Bitcoin reserve discussions emerge, markets enter a transition phase where perception of Bitcoin changes from speculative asset to macro strategic instrument.
This creates three major structural effects in global markets:
First, institutional confidence increases significantly because Bitcoin is no longer viewed as purely volatile speculation, but as a macro hedge asset with potential long-term reserve utility.
Second, capital allocation shifts gradually as large players begin positioning before confirmation. This leads to slow accumulation phases beneath volatility, where price appears unstable but underlying demand strengthens.
Third, volatility increases in the short term because retail participants react emotionally to headlines and price swings, while smart money uses that volatility as liquidity for execution and positioning.
This creates a widening structural gap between: Narrative-driven retail behavior
And liquidity-driven institutional behavior
5. WHY BITCOIN IS STUCK BETWEEN $75K AND $83K — LIQUIDITY ENGINEERING EXPLAINED
Bitcoin remains stuck in a range because it is being compressed between two opposing liquidity forces.
Below current price: Between $75,000 and $73,000, there are large clusters of long stop losses, panic sell orders, and forced liquidation zones. These represent downside liquidity.
Above current price: Between $80,000 and $83,500, there are short liquidations, breakout traders, and FOMO-driven buy orders. These represent upside liquidity.
This creates a structural system where: The market moves upward to collect one liquidity pool
Then reverses to collect the opposite liquidity pool
Then prepares for expansion once both sides are sufficiently harvested
This is why traders repeatedly experience fake breakouts above $80K and fake breakdowns below $75K.
The market is not random — it is liquidity-driven, engineered, and structurally balanced before expansion.
6. BTC PRICE OUTLOOK — SHORT, MID & LONG TERM STRUCTURAL SCENARIO (DETAILED RANGE EXPANSION MODEL)
Short term outlook: Bitcoin is expected to continue operating inside $75,000 – $83,500 consolidation band, where volatility remains high but directional clarity remains low. Price will continue to interact with key zones such as $78,000, $79,500, $81,000, and $75,500 as liquidity is repeatedly harvested.
Mid term outlook: If strategic reserve narrative strengthens and institutional inflows remain consistent through ETFs and treasury adoption channels, Bitcoin has structural potential to expand toward $90,000 – $105,000 range, with volatility spikes possibly extending toward $88,000, $92,000, and $98,000 during breakout phases.
Long term outlook: If Bitcoin begins to be integrated into sovereign reserve diversification frameworks, global macro valuation models shift significantly. In such a scenario, Bitcoin can enter a structural revaluation cycle targeting $110,000 – $150,000+ range, depending on global liquidity conditions, interest rates, and institutional accumulation speed.
Important reality: Bitcoin does not move in straight lines. It moves in cycles of: Compression → Liquidity Sweep → Expansion → Correction → Re-accumulation
7. MARKET PSYCHOLOGY WAR — WHY MOST TRADERS FAIL AROUND $78K BTC ZONE
Most traders fail in this environment not because they lack knowledge, but because they misinterpret market structure.
At $78K BTC level, retail behavior typically follows predictable emotional cycles: They buy after breakout above $80K too late
They sell in panic below $75K too early
They place stop losses in obvious liquidity zones
They trade based on emotion instead of structure
Meanwhile, smart money behavior is opposite: They accumulate during fear phases
They distribute during hype phases
They use volatility as liquidity opportunity
They position before confirmation, not after it
This creates a system where retail traders unintentionally become the liquidity source required for institutional execution.
8. PROFESSIONAL TRADING STRATEGY — LIQUIDITY-FIRST EXECUTION MODEL
In this environment, prediction-based trading is ineffective. The only reliable approach is liquidity-based execution.
Core strategy includes: Avoid trading mid-range zones like $78K
Wait for liquidity sweeps above $80K or below $75K
Enter only after rejection confirmation or structural displacement
Avoid breakout chasing without validation
Focus on liquidity behavior, not candle patterns
Example logic: If BTC sweeps below $75,000 and shows strong rejection → potential long setup
If BTC sweeps above $80,000 and fails to sustain → potential short reaction setup
This ensures traders enter after manipulation, not during manipulation.
9. RISK MANAGEMENT — SURVIVAL SYSTEM IN HIGH VOLATILITY BTC STRUCTURE
In a liquidity-engineered market environment, survival depends on risk discipline.
Key principles: Risk only 1–2% per trade maximum
Avoid high leverage in consolidation zones
Use structural stop-loss placement instead of tight emotional stops
Take partial profits at liquidity zones like $80K and $75K
Avoid revenge trading after stop-outs
Capital preservation is the foundation of long-term success.
10. NEXT MARKET EXPECTATION — STRUCTURAL OUTLOOK
Bitcoin is currently building energy inside a liquidity compression environment.
Most likely sequence: Price continues ranging between $75K–$83K
One side liquidity sweep occurs first
False breakout or breakdown traps traders
Sharp reversal follows liquidity collection
Then strong expansion phase begins
Direction will depend on macro liquidity flow and institutional positioning influenced by strategic reserve narrative progression.
11. FINAL CONCLUSION — BIG PICTURE MARKET REALITY
Bitcoin at $78,000 level is not in trend phase — it is in global liquidity engineering phase before macro expansion cycle.
Short term = manipulation + volatility + traps
Mid term = breakout preparation phase
Long term = structural adoption + scarcity-driven valuation expansion
FINAL POWER LINE
👉 Bitcoin at $78K is not moving randomly — it is being structurally engineered through global liquidity cycles, sovereign narrative shifts, and institutional positioning. Those who understand liquidity zones, macro adoption trends, and market structure behavior will always stay ahead of retail crowd cycles.
repost-content-media
  • Reward
  • Comment
  • Repost
  • Share
##FedHoldsRateButDividesDeepen
FED RATE CUT EXPECTATIONS vs BITCOIN
(BTC Context: trading around ~$80,000 after recent spike to ~$80,161, currently ranging $78K–$82K)
1. INTRODUCTION — FED POLICY IS NOW A MARKET DRIVER, NOT JUST A DECISION
The Federal Reserve’s interest rate policy has entered a phase where the decision itself is no longer the main story — expectations about future rate cuts are now the real market engine.
Even though rates are currently held steady, markets are aggressively pricing future possibilities, and this expectation game is directly shaping liquidity flows, risk a
BTC-2.75%
HighAmbition
##FedHoldsRateButDividesDeepen
FED RATE CUT EXPECTATIONS vs BITCOIN
(BTC Context: trading around ~$80,000 after recent spike to ~$80,161, currently ranging $78K–$82K)
1. INTRODUCTION — FED POLICY IS NOW A MARKET DRIVER, NOT JUST A DECISION
The Federal Reserve’s interest rate policy has entered a phase where the decision itself is no longer the main story — expectations about future rate cuts are now the real market engine.
Even though rates are currently held steady, markets are aggressively pricing future possibilities, and this expectation game is directly shaping liquidity flows, risk appetite, and Bitcoin price behavior across global markets.
In simple terms, the Fed is no longer just controlling rates — it is controlling future liquidity imagination, and that imagination is now moving Bitcoin more than actual policy action.
2. FED RATE CUT OUTLOOK — MARKET PRICING BREAKDOWN
Markets are currently trading Fed expectations dynamically rather than statically:
Short-Term Outlook (1–3 Months)
Rate cut probability: ~20% to 35%
Market view: uncertain, data-dependent
Inflation still sticky → prevents aggressive easing bets
Mid-Term Outlook (3–6 Months)
Rate cut probability: ~45% to 60%
Market view: conditional easing cycle expected
Depends on employment cooling + inflation stabilization
If inflation rises again:
Rate cut probability drops below 20%
Hawkish repricing returns immediately
This creates a constant volatility loop in expectations, not policy itself.
3. BITCOIN CURRENT STRUCTURE — $80K IS THE CORE BATTLEFIELD
Bitcoin is currently positioned in one of the most sensitive macro zones:
Recent high: $80,161
Current price: ~$80,000
Active trading band: $78,000 – $82,000
Structure Meaning:
$80K = psychological + liquidity equilibrium zone
$82K+ = breakout + liquidity expansion zone
$78K–$79K = dip demand + stop-loss sweep zone
This is not a trend market — this is a liquidity battlefield
4. WHY FED RATE CUT EXPECTATIONS MOVE BITCOIN MORE THAN NEWS
Bitcoin reacts not to Fed decisions, but to liquidity expectation shifts.
If rate cuts are expected:
liquidity expands in financial system
USD weakens
risk assets strengthen
BTC targets $82K → $85K → $88K+
If rate cuts are delayed:
liquidity tightens
USD strengthens
risk assets lose momentum
BTC risks $78K → $75K retest
Market moves on anticipated liquidity, not current liquidity.
5. MARKET TREND STRUCTURE — WHY BTC IS NOT BREAKING CLEANLY
Current price behavior shows classic macro indecision:
no strong directional trend
repeated fake breakouts above $80K
sudden liquidity sweeps below $79K
fast reversals from both sides
This happens because:
Fed is divided internally
liquidity expectations are unstable
institutions are hedging instead of committing
Result = range + volatility + traps
6. FED DIVISION EFFECT — WHY MARKETS ARE CONFUSED
Inside the Fed:
Hawkish View:
inflation still not fully controlled
early cuts = risk of inflation return
USD strength must be protected
Dovish View:
economy slowing down
credit tightening visible
delay may cause recession risk
No unified message = no clear market direction
7. BITCOIN BEHAVIOR UNDER FED UNCERTAINTY
When Fed is divided:
liquidity becomes cautious
institutions reduce leverage
volatility increases but direction weakens
price stays range-bound
This is exactly why BTC is stuck near $80K
8. TRADING STRUCTURE — HOW SMART MONEY IS PLAYING THIS
Institutional behavior:
selling volatility instead of chasing trend
using options for hedging exposure
accumulating during liquidity dips
avoiding breakout FOMO
Retail behavior:
chasing $80K breakouts
getting trapped in fake moves
stop-loss hunting repeatedly
Result: wealth transfer through volatility
9. SCENARIO MODEL — BTC NEXT MOVE BASED ON FED CUT PATH
Bullish Case (Rate Cut Expectations Rise)
BTC breaks $82K
targets: $85K → $88K
liquidity expansion phase begins
Bearish Case (Cuts Delayed / Hawkish Fed)
BTC loses $78K support
retrace toward $75K possible
liquidity contraction phase
Neutral Case (Most Likely Short-Term)
BTC stays in $78K–$82K range
repeated liquidity sweeps
no clean breakout yet
10. WHY $80K IS A GLOBAL LIQUIDITY MAGNET
This level is critical because:
psychological round number
heavy institutional positioning
options strike clustering
profit-taking zone
breakout trigger threshold
Price is constantly attracted and rejected from this zone
11. FINAL MARKET INTERPRETATION
Bitcoin is no longer reacting to simple technical analysis — it is now directly linked to:
Fed rate expectations
global liquidity forecasting
institutional hedging behavior
macro inflation trajectory
👉 This means BTC is now a macro liquidity instrument, not just a crypto asset
FINAL POWER LINE
👉 Bitcoin at ~$80K is not stuck — it is waiting. Waiting for one thing only: clarity in Fed rate cut expectations. Until then, the market will not trend — it will hunt liquidity, trap traders, and remain in controlled volatility mode driven by macro uncertainty.#GateSquareMayTradingShare #CreatorCarnival #ContentMining
repost-content-media
  • Reward
  • Comment
  • Repost
  • Share
#DeFiLossesTop600MInApril

1. INTRODUCTION — A HISTORIC CAPITAL DESTRUCTION EVENT IN DEFI
April 2026 became one of the most devastating months in DeFi history, with total losses surpassing $600–625 million across nearly 28–30 separate incidents, according to DefiLlama and security firms like CertiK. This wasn't a single black swan but a convergence of sophisticated exploits, liquidation cascades, and liquidity shocks in a highly interconnected ecosystem.1185c7
DeFi TVL, which hovered around $95B+ earlier in the month, saw significant outflows exceeding $13B in some reports amid panic withdr
ETH-3.21%
BTC-2.75%
SOL-3%
AAVE-2.72%
HighAmbition
#DeFiLossesTop600MInApril

1. INTRODUCTION — A HISTORIC CAPITAL DESTRUCTION EVENT IN DEFI
April 2026 became one of the most devastating months in DeFi history, with total losses surpassing $600–625 million across nearly 28–30 separate incidents, according to DefiLlama and security firms like CertiK. This wasn't a single black swan but a convergence of sophisticated exploits, liquidation cascades, and liquidity shocks in a highly interconnected ecosystem.1185c7
DeFi TVL, which hovered around $95B+ earlier in the month, saw significant outflows exceeding $13B in some reports amid panic withdrawals. The events served as a brutal stress test, exposing lingering vulnerabilities even as the broader crypto market cap traded in the $2.5T+ range.
2. WHAT EXACTLY CAUSED THE $600M+ DEFI LOSSES
Losses stemmed from multiple overlapping vectors, dominated by two mega-incidents:
Major Exploits:
KelpDAO (April 19): ~$292–294M drained via LayerZero bridge vulnerability. Attackers minted ~116,500 rsETH (fake/restaked ETH) and used it as collateral to borrow assets across 20+ chains. This was one of the largest single DeFi exploits of 2026.
Drift Protocol (early April): ~$285M lost on Solana through social engineering and fake collateral manipulation. North Korea-linked groups (e.g., Lazarus) were implicated in some high-profile cases.
Smaller Incidents: Dozens more added up, including oracle manipulations, re-entrancy attacks, and bridge weaknesses (e.g., Aftermath Protocol ~$1.14M, others in the $0.4M–$7M range). Cross-chain bridges and price feed issues were recurring themes.
Leverage Liquidation Cascades:
High-leverage positions in lending protocols (e.g., Aave) amplified damage. The KelpDAO hack triggered mass redemptions — Aave saw deposits drop ~38% and active loans ~31% in a bank-run-like scenario. Forced liquidations created cascading sells, with inefficient liquidity pools absorbing massive slippage.
Liquidity Withdrawal Shock:
TVL dropped sharply post-exploits. Users withdrew liquidity en masse, reducing pool depth. This spiked slippage on even moderate trades and increased overall market fragility. Idle capital estimates in DeFi remained high (tens of billions underutilized pre-event), but active liquidity fled to safer assets.
Oracle & Price Feed Stress:
Delayed or manipulated feeds led to erroneous liquidations. Low-liquidity assets saw pricing errors that unfairly wiped out positions.
3. QUANTITATIVE MARKET IMPACT (PRICES, PERCENTAGES, VOLUMES, LIQUIDITY)
DeFi TVL: Peaked near $95B early/mid-April but faced $13B+ outflows. Ethereum held ~57% dominance (~$54B TVL) despite the chaos.
Bitcoin (BTC): Traded around $75,000–79,000 in April (e.g., ~$75.3K on April 20). It absorbed spillover without crashing, gaining slight dominance as capital rotated from risky DeFi alts. BTC rose over 10% for the month in some periods amid broader recovery.
Ethereum (ETH): Fluctuated ~$1,900–2,300 (e.g., recovering to ~$2,195 mid-month). Underperformed BTC due to heavy DeFi exposure.
Trading Volumes: Overall crypto 24h volumes hit $100B+ during recovery phases but contracted in high-risk DeFi tokens. Stablecoin dominance rose as fear increased.
Liquidations: Billions in leveraged positions wiped out, with DeFi lending utilization spiking then contracting sharply.
Altcoin/DeFi Token Performance: Tokens with heavy DeFi exposure dropped 10–30%+ in many cases, while BTC/ETH and stables held firmer.
4. IMPACT ON OVERALL CRYPTO MARKET STRUCTURE
The shock caused liquidity contraction and risk repricing. Capital rotated out of experimental DeFi into BTC, ETH, and stables. Altcoins with DeFi ties underperformed significantly. BTC acted as the "safe haven" within crypto, with dominance ticking up.
Psychological effects included heightened volatility around key levels and stronger reactions to liquidity zones. Total market cap hovered in the $2.5T area amid the turbulence.
5. TRADER PSYCHOLOGY & SENTIMENT (APRIL–MAY 2026)
Retail: Panic exits from DeFi, fear of hidden risks, shift to BTC/stables. Frustration over repeated hacks.
Institutions: Further avoidance of raw DeFi exposure; preference for liquid BTC/ETH and regulated/hedged products. Increased demand for audits and insurance.
Yield Farmers: De-leveraging, migration to audited/safer pools, higher focus on risk controls.
Overall Sentiment: Cautious optimism with selective risk-taking. Market filtering DeFi rather than abandoning it. Fear & Greed Index reflected "Extreme Fear" at points.
6. WHY APRIL 2026 WAS PARTICULARLY BRUTAL
High cross-chain activity, aggressive yield farming, elevated leverage, and protocol competition aligned with macro volatility. Bridge exploits alone accounted for a massive share of losses.
7. LONG-TERM EFFECTS ON DEFI & CRYPTO
Security: Accelerated audits, better oracles, circuit breakers (e.g., withdrawal pauses), and improved bridge designs.
Leverage & Design: Lower leverage caps, safer ratios, and standardized risk controls.
Institutionalization: Push toward compliant, regulated DeFi products to attract bigger capital.
Maturation: This stress test weeds out weak projects and strengthens survivors. DeFi TVL has shown resilience in past cycles despite shocks.
FINAL CONCLUSION & POWER LINE
The $600M+ April 2026 DeFi losses (driven by ~$577M+ from two major hacks alone) highlight crypto's high-risk nature: rapid innovation outpacing security. Yet the ecosystem didn't collapse — it adapted. Liquidity rotated toward established assets like Bitcoin (acting as macro safe haven) and Ethereum, while DeFi begins its next maturation phase with stronger foundations.
DeFi is not collapsing — it is being stress-tested and refined. Every major loss removes fragility, reprices risk, and channels capital toward more resilient structures. The cycle of explosive growth and correction continues, but with each iteration, the foundation grows stronger.
Stay vigilant, manage risk, and focus on audited, battle-tested protocols moving forward into May 2026 and beyond.#GateSquareMayTrafingShare #CreatorCarnival #ContentMining
repost-content-media
  • Reward
  • Comment
  • Repost
  • Share
#DailyPolymarketHotspot
#DailyPolymarketHotspot — Crypto Market Benefits & Why It Matters for Traders
The current dominance of AI milestones and AGI timeline predictions on Polymarket is not just limited to prediction markets themselves, because its impact is directly spilling over into the crypto market, influencing trader psychology, capital flow, and even short-term price behavior, which means that understanding this hotspot is no longer optional for crypto traders but has become a strategic advantage for those who want to stay aligned with where smart money and attention are moving.
HOW
BTC-2.75%
ETH-3.21%
HighAmbition
#DailyPolymarketHotspot
#DailyPolymarketHotspot — Crypto Market Benefits & Why It Matters for Traders
The current dominance of AI milestones and AGI timeline predictions on Polymarket is not just limited to prediction markets themselves, because its impact is directly spilling over into the crypto market, influencing trader psychology, capital flow, and even short-term price behavior, which means that understanding this hotspot is no longer optional for crypto traders but has become a strategic advantage for those who want to stay aligned with where smart money and attention are moving.
HOW POLYMARKET HOTSPOT BENEFITS CRYPTO MARKET
When a strong hotspot like AI and AGI dominates Polymarket, it creates a ripple effect across crypto because both ecosystems are driven by speculation, future expectations, and narrative-based momentum, which means that when traders become highly active in AI-related predictions, they also begin reallocating capital into crypto sectors that are directly or indirectly connected to AI, resulting in increased trading activity, higher volatility, and stronger directional moves in selected assets rather than the entire market moving uniformly.
This effect is especially visible in AI-related crypto tokens, where traders anticipate that if AI adoption accelerates in the real world, then blockchain projects connected to artificial intelligence, data processing, and decentralized compute networks will gain traction, leading to increased buying pressure and speculative rallies, even if the fundamental developments are still in early stages, because in both Polymarket and crypto, perception often moves faster than reality.
CAPITAL FLOW SHIFT — FROM PREDICTION TO TRADING
One of the biggest advantages for crypto traders is understanding how capital rotates between markets, because when a topic becomes a hotspot on Polymarket, it signals that large groups of traders are already focused on that narrative, and many of these participants are also active in crypto markets, meaning they often carry the same bias into their trading decisions, which results in synchronized sentiment where prediction markets and crypto charts begin reflecting similar expectations about the future.
For example, if AI probabilities increase sharply on Polymarket, traders may start accumulating AI-related crypto assets or even large-cap coins like Bitcoin and Ethereum in anticipation of a broader tech-driven rally, because historically, strong narratives tend to lift the entire market sentiment, even if only specific sectors are directly related.
VOLATILITY ADVANTAGE FOR TRADERS
Hotspot-driven markets create one of the most important conditions for crypto traders: volatility, because when a narrative is active and constantly evolving, price movements become sharper and more frequent, allowing traders to capture opportunities in shorter timeframes rather than waiting for long-term trends to develop.
AI as a hotspot is particularly powerful because it generates continuous news flow, including model releases, partnerships, regulatory discussions, and public statements from influential figures like Elon Musk, all of which contribute to rapid sentiment changes that can translate into crypto price fluctuations, especially in narrative-driven tokens and tech-aligned assets.
SENTIMENT EDGE — READING THE MARKET BEFORE IT MOVES
Polymarket provides crypto traders with an informational edge because it acts as an early indicator of shifting sentiment, allowing traders to see probability changes before they are fully reflected in crypto prices, which means that instead of reacting to price movement, traders can anticipate it by analyzing how expectations are evolving in prediction markets.
When probabilities related to AI adoption, technological breakthroughs, or macro tech dominance start increasing, it often signals that the broader market sentiment is turning bullish toward innovation-driven sectors, which can eventually lead to capital inflow into crypto markets, particularly in narratives aligned with that trend.
WHY HOTSPOT = STRONG TRADING SIGNAL
A hotspot on Polymarket is powerful because it combines three key elements at the same time: high liquidity, strong narrative, and rapid probability movement, and when these three factors align, they create a feedback loop where more traders enter the market, more capital flows in, and volatility increases further, making it one of the most attractive environments for active trading.
For crypto traders, this means that instead of scanning hundreds of random indicators, they can focus on a single dominant narrative and align their strategy accordingly, because markets tend to move strongest when a clear story is driving participant behavior.
PRACTICAL TRADER APPROACH
Smart traders do not treat Polymarket as a separate platform but as a sentiment tool that complements crypto trading, because by identifying the daily hotspot, they can understand where attention is building and position themselves in advance rather than chasing moves after they happen.
When AI is dominating, traders look for:
AI-related crypto tokens gaining volume
Increased activity in tech-driven narratives
Correlation between AI news and crypto price spikes
This approach allows traders to stay ahead of the curve and operate with a clearer understanding of why the market is moving rather than relying purely on technical patterns.
FINAL INSIGHT
The connection between Polymarket hotspots and the crypto market lies in shared psychology, shared participants, and shared narratives, which means that when a powerful trend like AI milestones and AGI timelines takes control of prediction markets, its influence naturally extends into crypto trading behavior, creating opportunities for those who can read and interpret these signals correctly.
In simple terms, Polymarket shows what traders are thinking, while crypto shows how they are acting, and when both align around a strong hotspot, it creates one of the most profitable environments for informed and disciplined traders.
repost-content-media
  • Reward
  • Comment
  • Repost
  • Share
#DailyPolymarketHotspot
#DailyPolymarketHotspot — Crypto Market Benefits & Why It Matters for Traders
The current dominance of AI milestones and AGI timeline predictions on Polymarket is not just limited to prediction markets themselves, because its impact is directly spilling over into the crypto market, influencing trader psychology, capital flow, and even short-term price behavior, which means that understanding this hotspot is no longer optional for crypto traders but has become a strategic advantage for those who want to stay aligned with where smart money and attention are moving.
HOW
AGI-10.01%
BTC-2.75%
ETH-3.21%
HighAmbition
#DailyPolymarketHotspot
#DailyPolymarketHotspot — Crypto Market Benefits & Why It Matters for Traders
The current dominance of AI milestones and AGI timeline predictions on Polymarket is not just limited to prediction markets themselves, because its impact is directly spilling over into the crypto market, influencing trader psychology, capital flow, and even short-term price behavior, which means that understanding this hotspot is no longer optional for crypto traders but has become a strategic advantage for those who want to stay aligned with where smart money and attention are moving.
HOW POLYMARKET HOTSPOT BENEFITS CRYPTO MARKET
When a strong hotspot like AI and AGI dominates Polymarket, it creates a ripple effect across crypto because both ecosystems are driven by speculation, future expectations, and narrative-based momentum, which means that when traders become highly active in AI-related predictions, they also begin reallocating capital into crypto sectors that are directly or indirectly connected to AI, resulting in increased trading activity, higher volatility, and stronger directional moves in selected assets rather than the entire market moving uniformly.
This effect is especially visible in AI-related crypto tokens, where traders anticipate that if AI adoption accelerates in the real world, then blockchain projects connected to artificial intelligence, data processing, and decentralized compute networks will gain traction, leading to increased buying pressure and speculative rallies, even if the fundamental developments are still in early stages, because in both Polymarket and crypto, perception often moves faster than reality.
CAPITAL FLOW SHIFT — FROM PREDICTION TO TRADING
One of the biggest advantages for crypto traders is understanding how capital rotates between markets, because when a topic becomes a hotspot on Polymarket, it signals that large groups of traders are already focused on that narrative, and many of these participants are also active in crypto markets, meaning they often carry the same bias into their trading decisions, which results in synchronized sentiment where prediction markets and crypto charts begin reflecting similar expectations about the future.
For example, if AI probabilities increase sharply on Polymarket, traders may start accumulating AI-related crypto assets or even large-cap coins like Bitcoin and Ethereum in anticipation of a broader tech-driven rally, because historically, strong narratives tend to lift the entire market sentiment, even if only specific sectors are directly related.
VOLATILITY ADVANTAGE FOR TRADERS
Hotspot-driven markets create one of the most important conditions for crypto traders: volatility, because when a narrative is active and constantly evolving, price movements become sharper and more frequent, allowing traders to capture opportunities in shorter timeframes rather than waiting for long-term trends to develop.
AI as a hotspot is particularly powerful because it generates continuous news flow, including model releases, partnerships, regulatory discussions, and public statements from influential figures like Elon Musk, all of which contribute to rapid sentiment changes that can translate into crypto price fluctuations, especially in narrative-driven tokens and tech-aligned assets.
SENTIMENT EDGE — READING THE MARKET BEFORE IT MOVES
Polymarket provides crypto traders with an informational edge because it acts as an early indicator of shifting sentiment, allowing traders to see probability changes before they are fully reflected in crypto prices, which means that instead of reacting to price movement, traders can anticipate it by analyzing how expectations are evolving in prediction markets.
When probabilities related to AI adoption, technological breakthroughs, or macro tech dominance start increasing, it often signals that the broader market sentiment is turning bullish toward innovation-driven sectors, which can eventually lead to capital inflow into crypto markets, particularly in narratives aligned with that trend.
WHY HOTSPOT = STRONG TRADING SIGNAL
A hotspot on Polymarket is powerful because it combines three key elements at the same time: high liquidity, strong narrative, and rapid probability movement, and when these three factors align, they create a feedback loop where more traders enter the market, more capital flows in, and volatility increases further, making it one of the most attractive environments for active trading.
For crypto traders, this means that instead of scanning hundreds of random indicators, they can focus on a single dominant narrative and align their strategy accordingly, because markets tend to move strongest when a clear story is driving participant behavior.
PRACTICAL TRADER APPROACH
Smart traders do not treat Polymarket as a separate platform but as a sentiment tool that complements crypto trading, because by identifying the daily hotspot, they can understand where attention is building and position themselves in advance rather than chasing moves after they happen.
When AI is dominating, traders look for:
AI-related crypto tokens gaining volume
Increased activity in tech-driven narratives
Correlation between AI news and crypto price spikes
This approach allows traders to stay ahead of the curve and operate with a clearer understanding of why the market is moving rather than relying purely on technical patterns.
FINAL INSIGHT
The connection between Polymarket hotspots and the crypto market lies in shared psychology, shared participants, and shared narratives, which means that when a powerful trend like AI milestones and AGI timelines takes control of prediction markets, its influence naturally extends into crypto trading behavior, creating opportunities for those who can read and interpret these signals correctly.
In simple terms, Polymarket shows what traders are thinking, while crypto shows how they are acting, and when both align around a strong hotspot, it creates one of the most profitable environments for informed and disciplined traders.
repost-content-media
  • Reward
  • Comment
  • Repost
  • Share
#TapAndPayWithGateCard
The Future of Crypto Spending: Tap, Pay, and Move On
The evolution of digital finance is no longer limited to trading screens and long-term holding strategies, because cryptocurrency is now stepping directly into everyday life through seamless payment solutions that eliminate the traditional gap between owning digital assets and actually using them in real-world transactions, and this transformation is being driven by innovations like the Gate Card introduced by Gate.io, which allows users to convert their crypto balance into instant purchasing power with nothing more
BTC-2.75%
ETH-3.21%
HighAmbition
#TapAndPayWithGateCard
The Future of Crypto Spending: Tap, Pay, and Move On
The evolution of digital finance is no longer limited to trading screens and long-term holding strategies, because cryptocurrency is now stepping directly into everyday life through seamless payment solutions that eliminate the traditional gap between owning digital assets and actually using them in real-world transactions, and this transformation is being driven by innovations like the Gate Card introduced by Gate.io, which allows users to convert their crypto balance into instant purchasing power with nothing more than a simple tap.
Instant Payments Without Complexity
One of the biggest limitations of crypto adoption in the past has always been usability, because even though people could hold assets like Bitcoin or Ethereum, spending them required multiple steps, conversions, delays, and technical understanding, but with a tap-to-pay system, that entire process is reduced to a single smooth action where the user simply taps the card on a payment terminal and the system handles everything in the background, converting crypto into fiat instantly without interrupting the user experience or slowing down the transaction flow.
Bridging Crypto and Real-World Commerce
The real strength of this system lies in how effectively it connects the crypto ecosystem with traditional financial infrastructure, because instead of waiting for global merchants to adopt direct crypto payments, the Gate Card works within existing payment networks, allowing users to spend their digital assets at millions of locations worldwide, including retail stores, restaurants, and online platforms, which means that crypto is no longer isolated within exchanges but becomes a functional part of daily economic activity.
Speed, Convenience, and Everyday Utility
Speed is one of the defining features of contactless payments, and when combined with crypto, it creates a powerful financial tool where transactions are completed in seconds without the need for cash handling, PIN entry in many cases, or complicated approval processes, making it ideal for fast-paced environments where efficiency matters, while also giving users the freedom to access their funds instantly without worrying about withdrawal delays or banking restrictions.
Smart Asset Usage and Flexibility
Another major advantage is flexibility, because users are not limited to a single currency or payment source, and instead can manage multiple crypto assets within their account while deciding how and when to use them, effectively turning their portfolio into a dynamic spending wallet that adapts to their needs, whether they want to hold long-term or use short-term gains for real purchases, creating a balance between investment strategy and practical usage.
Security Without Sacrificing Ease
Despite its simplicity, the system maintains strong security standards through encrypted transactions, controlled limits, and account-level protections, ensuring that users can enjoy the convenience of tap-to-pay functionality without exposing themselves to unnecessary risks, which is critical in building trust and encouraging wider adoption among users who may still be cautious about using crypto in everyday transactions.
Expanding Financial Access Globally
This type of payment solution also has broader implications for global financial inclusion, especially in regions where traditional banking services are limited or inefficient, because a crypto-backed card provides an alternative way to store, manage, and spend value without relying entirely on local financial institutions, giving users more independence and access to a globally connected payment system that operates beyond geographical restrictions.
A New Layer of Utility for Traders
For active traders, this innovation introduces a practical advantage that goes beyond convenience, because it allows them to access and use their funds instantly without disrupting their trading flow, making it easier to move between market activity and real-world spending, which improves overall liquidity management and removes the friction that previously existed between profit realization and usability.
The Bigger Picture: Crypto Becoming Everyday Money
What this system ultimately represents is a shift in how cryptocurrency is perceived and used, because it moves beyond the idea of digital assets being purely speculative instruments and positions them as functional, spendable money that can integrate seamlessly into daily life, and as more platforms continue to develop similar solutions, the line between traditional finance and crypto will continue to blur until using digital assets becomes as natural as using a debit or credit card.
Final Thought
The ability to tap and pay using crypto is not just a convenience feature, but a clear signal that the industry is moving toward real-world practicality, where speed, simplicity, and accessibility define the user experience, and where holding crypto is no longer the final step, but only the beginning of how it can be used in a modern financial system.
repost-content-media
  • Reward
  • Comment
  • Repost
  • Share
  • Pinned